
MODIS与Landsat 8地表温度融合拼接——以粤港澳大湾区为例
|
闫李月(1994—),女,河南焦作人,硕士研究生,主要研究方向为遥感应用,(E-mail)18566735218@163.com; |
收稿日期: 2019-09-05
要求修回日期: 2019-09-29
网络出版日期: 2019-11-08
基金资助
中国科学院战略性先导科技专项(A类)资助(A类资助XDA19030301)
深圳市科技计划基础研究(JCYJ20170818155853672)
国家自然科学基金(41771403)
版权
Surface Temperature Splicing Study Fusing MODIS and Landsat 8: A Case Study in the Guangdong-Hong Kong-Macao Greater Bay Area
Received date: 2019-09-05
Request revised date: 2019-09-29
Online published: 2019-11-08
Copyright
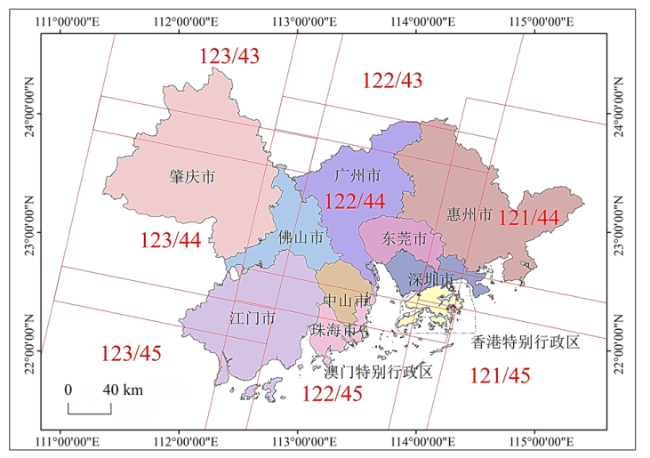
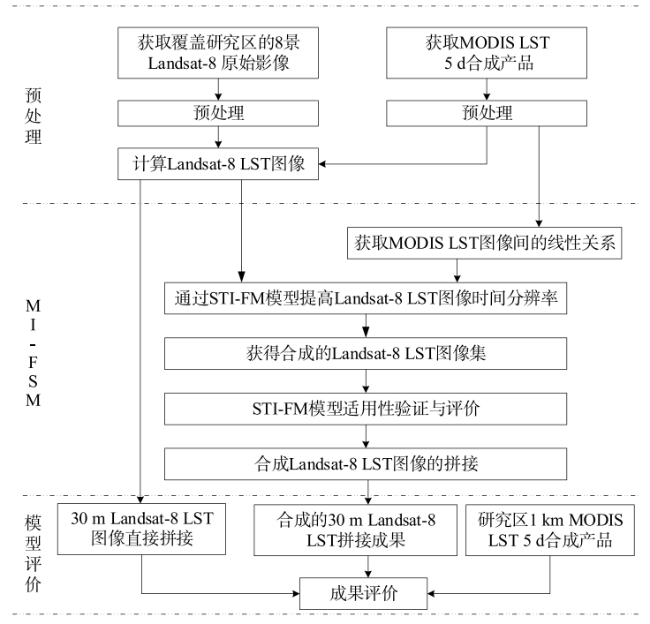
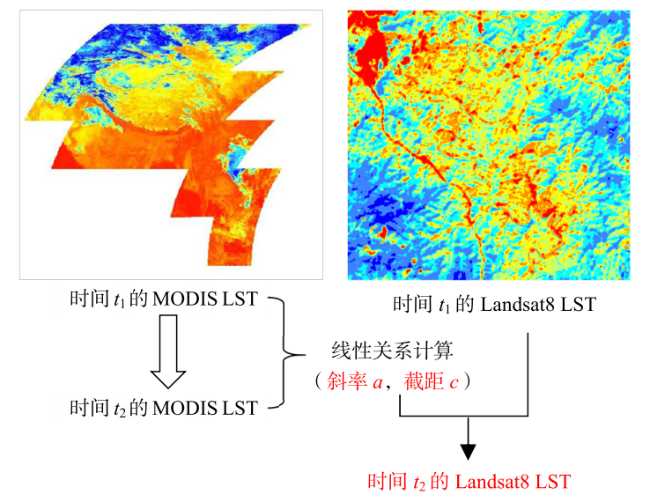
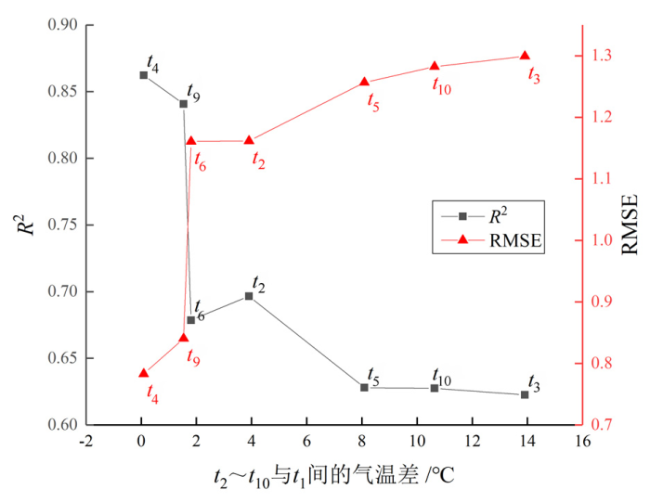
以粤港澳大湾区为例,基于时空影像融合模型(STI-FM),提出大区域多源LST(Land Surface Temperature, LST)影像融合拼接模型(Multi-source Image Fusion Stitching Model, MI-FSM),消除时间不同、天气差异的影响,生成覆盖大湾区的中高分辨率地表温度数据。首先,应用STI-FM融合MODIS LST与Landsat LST,将不同时相的多幅Landsat LST合成为具有统一特定时相的LST影像。然后,对合成的LST影像进行镶嵌处理,实现粤港澳大湾区多幅Landsat8 LST图像的拼接。为了验证STI-FM在研究区的适用性,选取研究区中心“夏-夏、冬-夏”2组Landsat 8 LST图像,将合成的Landsat LST与验证数据进行对比与评价,结果表明:STI-FM在研究区具有较强的适用性。对精度进行评价,验证模型的可靠性,结果表明:不同时相MODIS LST图像间拟合程度较高,其回归分析的确定系数(R 2)均在0.6~0.9之间,RMSE均<1.5;最后对整体以及局部细节的目视分析表明:融合拼接的成果较为理想。
闫李月 , 李洪忠 , 韩宇 , 陈劲松 , 左小清 , 王占峰 . MODIS与Landsat 8地表温度融合拼接——以粤港澳大湾区为例[J]. 热带地理, 2019 , 39(5) : 689 -700 . DOI: 10.13284/j.cnki.rddl.003186
Consider the Guangdong-Hong Kong-Macao Greater Bay Area as an example, this paper proposes a Multi-source Image Fusion Stitching Model (MI-FSM) for multi-source Land Surface Temperature (LST) images on a large-area study area; this model is based on the existing Spatio-Temporal Image Fusion Model (STI-FM). MI-FSM can eliminate the influences of different time and weather differences in the Landsat 8 data, realize seamless splicing between images, and generate medium- and high-resolution surface temperature data covering the Greater Bay Area. The data sources selected in the study were the Landsat 8 LST obtained from original Landsat 8 images via a surface temperature inversion algorithm and the MODIS LST 5d synthetic product. First, using the STI-FM fusion MODIS LST and Landsat LST, multiple Landsat LSTs of different phases were synthesized into LST images with uniform specific phases. Then, the synthesized LST images were mosaic-processed to splice multiple Landsat 8 LST images in the Guangdong-Hong Kong-Macao Greater Bay Area. To verify the applicability of STI-FM in the study area, this paper selected two groups of Landsat 8 LST images, “summer-summer” and “winter-summer,” in the center of the study area and compared and evaluated the synthesized Landsat LST concerning the verification data. In the “summer-summer” verification group, the minimum, maximum, mean, and standard deviation between the synthesized LST product and the actual LST were 0.01, 1.02, 0.10, and 0.03, respectively, and the coefficient of determination (R 2), Root Mean Square Error (RMSE), and Absolute Average Difference (AAD) were 0.849 5, 0.655 9, and 0.690 6, respectively. In the “winter-summer” verification group, the minimum, maximum, mean, and standard deviation between the synthesized LST product and the actual LST were 0.07, 0.08, 0.42, and 0.99, respectively, and R 2, RMSE, and AAD were 0.681 7, 1.375 3, and 1.012 9, respectively. The results show that STI-FM has a strong applicability in the study area. Finally, the accuracy of the model was further verified via an accuracy evaluation: the degree of fitting between different time-phase MODIS LST images was high, the R 2 value was between 0.6 and 0.9, and the RMSE was <1.5. Additionally, we selected three typical land cover types, cities, woodlands, and paddy fields and discussed the spatial distributions of their errors. The analysis results show that a linear relation is the most significant in cities, followed by paddy fields, and that the paddy fields are sensitive to seasonal differences. Woodlands have the poorest adaptability to the model, and there is no obvious relation with the errors for the woodlands. An evaluation was performed to prove that the results were reasonable: a visual analysis of the overall and local details indicated that the results of the fusion stitching were ideal.

表1 选取的Landsat8与MODIS数据信息Tab.1 Information on selected Landsat and MODIS data |
| 编号 | Landsat8 Path/Row | 日期 | 气温/℃ | MODIS 5 d合成LST日期 |
|---|---|---|---|---|
| 1 | 122/44 | 2015-10-18 | 30.36 | 2015-10-16—2015-10-20 |
| 2 | 121/44 | 2014-11-25 | 28.45 | 2014-11-21—2014-11-25 |
| 3 | 122/45 | 2016-02-07 | 16.45 | 2016-02-06—2016-02-10 |
| 4 | 123/44 | 2014-10-06 | 30.27 | 2014-10-06—2014-10-10 |
| 5 | 121/45 | 2015-02-13 | 22.27 | 2015-02-11—2015-02-15 |
| 6 | 123/45 | 2015-04-16 | 28.55 | 2015-04-16—2015-04-20 |
| 7 | 122/43 | 2015-10-18 | 30.36 | 2015-10-16—2015-10-20 |
| 8 | 123/43 | 2015-04-16 | 28.55 | 2015-04-16—2015-04-20 |
| 9 | 122/44 | 2014-10-15 | 28.82 | 2014-10-11—2014-10-15 |
| 10 | 122/44 | 2015-01-19 | 19.73 | 2015-01-16—2015-01-20 |
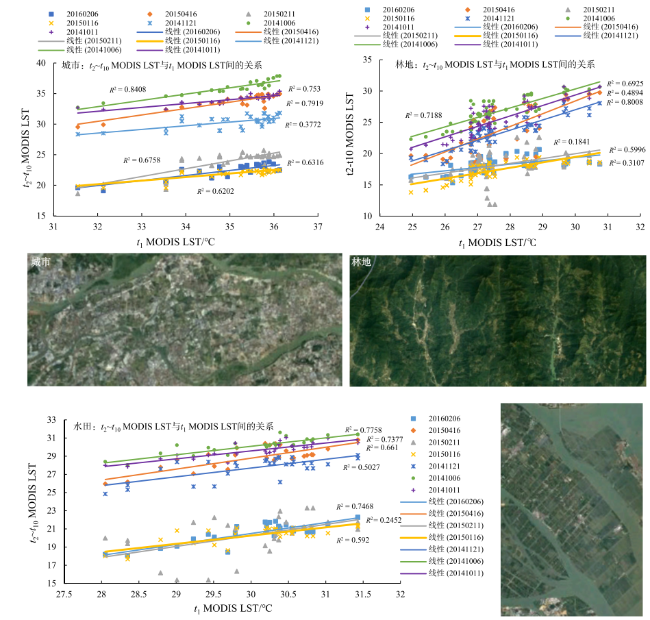
表2 M(t2)~ M(t10)与M(t1)间的关系Tab.2 Correlation coefficient between M(t2)~ M(t10)and M(t1) |
| 日期编号 | 日期 | 线性关系 | 确定系数R2 | RMSE |
|---|---|---|---|---|
| t2 | 2014-11-21—2014-11-25 | y=0.866 2x+6.202 | 0.70 | 1.16 |
| t3 | 2016-02-06—2016-02-10 | y=0.842 6x+12.96 | 0.62 | 1.30 |
| t4 | 2014-10-06—2014-10-10 | y=0.843 2x+4.285 | 0.86 | 0.78 |
| t5 | 2015-02-11—2015-02-15 | y=0.682 5x+15.00 | 0.63 | 1.26 |
| t6 | 2015-04-16—2015-04-20 | y=0.666 5x+9.974 | 0.68 | 1.16 |
| t7 | 2015-10-16—2015-10-20 | — | — | — |
| t8 | 2015-04-16—2015-04-20 | — | — | — |
| t9 | 2014-10-11—2014-10-15 | y=0.922 2x+2.487 | 0.84 | 0.84 |
| t10 | 2015-01-16—2015-01-20 | y=0.979 0x+10.40 | 0.63 | 1.28 |
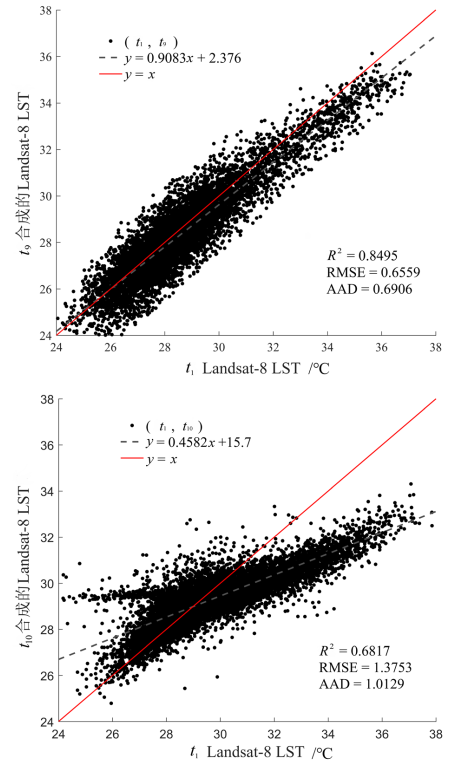
图6 S(t9)(t1)和S(t10)(t1)与L(t1)的LST关系图注:t9合成的Landsat LST、t10合成的Landsat LST 和t1 Landsat LST分别对应S(t9)、S(t10)和L(t1)。 Fig.6 LST relationship diagram of S(t9)(t1), S(t10)(t1)and L(t1) |
表3 L(t1)、S(t9)(t1)和S(t10)(t1)基本参数对比Tab.3 Comparison of basic parameters of L(t1), S(t9)(t1) and S(t10)(t1) ℃ |
| LST数据 | 最小值 | 最大值 | 均值 | 标准差 |
|---|---|---|---|---|
| L(t1) | 14.74 | 46.60 | 29.79 | 2.15 |
| S(t9)(t1) | 14.73 | 45.58 | 29.69 | 2.12 |
| S(t10)(t1) | 14.67 | 46.68 | 29.37 | 1.16 |
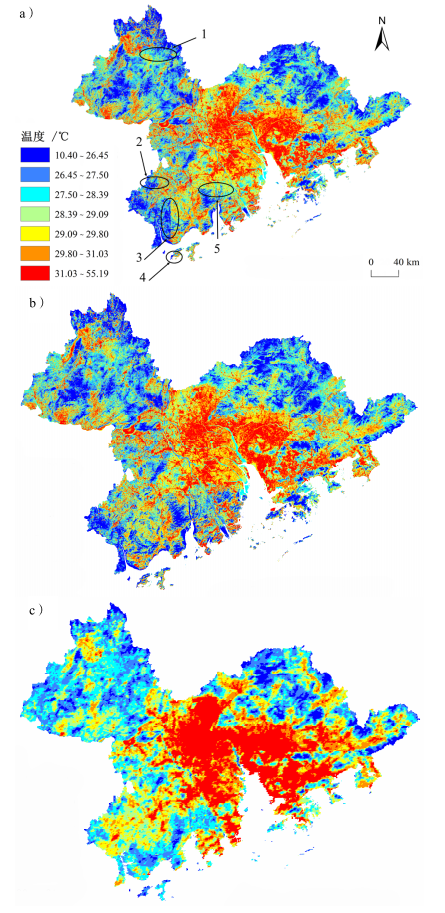
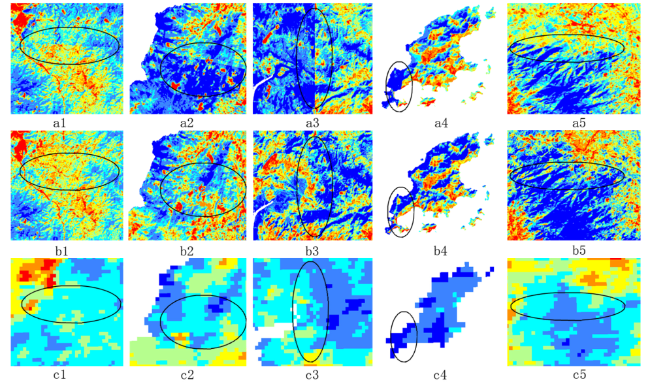
图7 成果对比(a. 原始Landsat8 LST直接拼接的成果;b. 合成的Landsat8 LST成果;c. MODIS LST产品)Fig.7 Comparison of results (a. Results of direct splicing of the original Landsat8 LST; b. Results of the synthesized Landsat8 LST; c. MODIS LST products) |
| 1 |
|
| 2 |
窦浩洋, 张晶晶, 赵昕奕 . 2010. 珠江三角洲城市热岛空间分布及热岛强度研究. 地域研究与开发, 29(4):72-77.
[
|
| 3 |
杜国明, 刘文琦, 于佳兴, 张爽 . 2019. 三江平原水旱田分布对遥感反演局地地表温度的影响. 农业工程学报, 35(5):259-267,320.
[
|
| 4 |
|
| 5 |
顾明明, 黑文艳, 李长春, 陆国政 . 2018. 大区域Landsat影像数据的一体化镶嵌处理方法与研究. 测绘地理信息, 43(4):55-58.
[
|
| 6 |
|
| 7 |
贺丽琴, 杨鹏, 景欣, 晏磊, 苏琳琳 . 2017. 基于MODIS影像及不透水面积的珠江三角洲热岛效应时空分析. 国土资源遥感, 29(4):140-146.
[
|
| 8 |
胡德勇, 乔琨, 王兴玲, 赵利民, 季国华 . 2015. 单窗算法结合Landsat8热红外数据反演地表温度. 遥感学报, 19(6):964-976.
[
|
| 9 |
|
| 10 |
|
| 11 |
|
| 12 |
李召良, 段四波, 唐伯惠, 吴骅任, 华忠, 阎广建, 唐荣林, 冷佩 . 2016. 热红外地表温度遥感反演方法研究进展. 遥感学报, 20(5):899-920.
[
|
| 13 |
覃志豪, 李文娟, 徐斌, 陈仲新, 刘佳 . 2004. 陆地卫星TM6波段范围内地表比辐射率的估计. 国土资源遥感,(3): 28--32, 36-41,74.
[
|
| 14 |
覃志豪 . 2003. 利用Landsat TM6反演地表温度所需地表辐射率参数的估计方法//遥感专业委员会. 第十四届全国遥感技术学术交流会论文选集. 北京: 中国海洋学会, 9.
[
|
| 15 |
饶胜, 张惠远, 金陶陶, 窦浩洋 . 2010. 基于MODIS的珠江三角洲地区区域热岛的分布特征. 地理研究, 29(1):127-136.
[
|
| 16 |
|
| 17 |
|
| 18 |
魏然 . 2016. 多源遥感地表温度数据时空融合研究及应用. 武汉:武汉大学.
[
|
| 19 |
魏然, 单杰 . 2018. 城市地表温度影像时空融合方法研究. 武汉大学学报(信息科学版), 43(3):428-435.
[
|
| 20 |
徐涵秋, 陈本清 . 2003. 不同时相的遥感热红外图像在研究城市热岛变化中的处理方法. 遥感技术与应用, 18(3):129-133,185.
[
|
| 21 |
|
| 22 |
张良培, 沈焕锋 . 2016. 遥感数据融合的进展与前瞻. 遥感学报, 20(5):1050-1061.
[
|
| 23 |
郑明亮, 黄方, 张鸽 . 2018. 基于TsHARP模型和STITFM算法的地表温度影像融合研究. 遥感技术与应用, 33(2):275-283.
[
|
| 24 |
朱娟, 李锟, 谢丹妮, 班远冲, 韩振超, 欧阳旸 . 2018. 珠三角城市群热岛效应时空分布特征. 环境科学导刊, 37(3):11-16.
[
|
/
| 〈 |
|
〉 |