
中国与“一带一路”沿线国家贸易及其影响因素
|
许阳贵(1993—),男,福建泉州人,硕士研究生,主要研究方向为地缘政治、社会地图与社会分区,(E-mail)houdalijia@163.com; |
收稿日期: 2019-09-23
要求修回日期: 2019-11-21
网络出版日期: 2019-12-26
基金资助
珠江三角洲的日资集聚与日本人移民社会的空间形成(41571130)
面向社会管理的政治地理学理论与实证研究(41271165)
版权
Foreign Trade and Its Influencing Factors between China and Countries along “the Belt and Road” Route
Received date: 2019-09-23
Request revised date: 2019-11-21
Online published: 2019-12-26
Copyright
利用拓展贸易引力模型,借助Eviews等工具分析了影响中国与“一带一路”沿线国家贸易规模的因素,以及中国对外直接投资的滞后性对双边贸易的影响。结果表明:1)中国与“一带一路”沿线国家贸易规模受到经济发展水平、市场规模、政治制度、贸易畅通性、便利性、中国对外直接投资、民间文化交流紧密度的影响;2)中国对外直接投资对于带动中国与“一带一路”沿线国家间的贸易规模具有正向作用,但其效应具有一定滞后性;3)中国对外直接投资对于带动中国与不同“一带一路”沿线国家贸易规模的引力大小不同,可分为投资带动力巨大型、投资带动型、投资一般型、投资带动力不足型4种类型,中国与东南亚、西亚和撒哈拉以南的非洲国家贸易规模受中国对外直接投资带动作用较强。
许阳贵 , 刘云刚 . 中国与“一带一路”沿线国家贸易及其影响因素[J]. 热带地理, 2019 , 39(6) : 855 -868 . DOI: 10.13284/j.cnki.rddl.003201
This study explores the trade pattern and influencing factors between China and countries along “ the Belt and Road” route using the gravity model of trade. With the implementation of China’s “the Belt and Road” initiative, the growing trade between China and countries along “the Belt and Road” route gradually became the principal measured standard of the achievements of the “the Belt and Road” initiative and an essential sign of implementing the concept of “the Belt and Road” initiative. Based on the five types of connectivity of “the Belt and Road” initiative, including connectivity of policy, infrastructure, trade, finance, and people, we unravel the factors influencing the trade between China and countries along “the Belt and Road” route and conduct a quantitative analysis of the factors. This study found that the total trade volume in the total import and export between China and countries along “the Belt and Road” route is influenced by the level of economic development, the size of each country’s market, the political system, accessibility and convenience of trade, and China’s foreign direct investment and non-governmental exchange and cooperation. Among these, China’s foreign direct investment shows hysteresis in promoting trade development between China and countries along “the Belt and Road” route. Because of each country’s different economic policies, trade policies, and international relations, the delay period between China’s foreign direct investment and trade development could differ. China’s foreign direct investment in countries along “the Belt and Road” route, however, has the most positive effect two years after the investment flowing into the host country. This study also found that China’s foreign direct investment has various effects on the total trade volume in the total import and export between China and countries along “the Belt and Road” route. They can be divided into four types: strong driving, driving, general, and insufficient driving. The countries in the strong driving type and driving type are in Southeast Asia, western Asia, and sub-Saharan Africa. This study enriches the domestic empirical research on the influencing factors of foreign trade between China and countries along “the Belt and Road” route, helps to improve the efficiency of Chinese enterprises’ overseas investment, and contributes to promoting the communication on economics and trade between China and countries along “the Belt and Road” route. This study also puts forward the view that China’s foreign direct investment shows hysteresis in promoting trade development. Future research could focus on the differences of the delay period in different industries between China’s foreign direct investment and the economic and trade development in the host country, exploring ways to shorten the delay period from the policy perspective and better promote the implementation of “the Belt and Road” initiative.

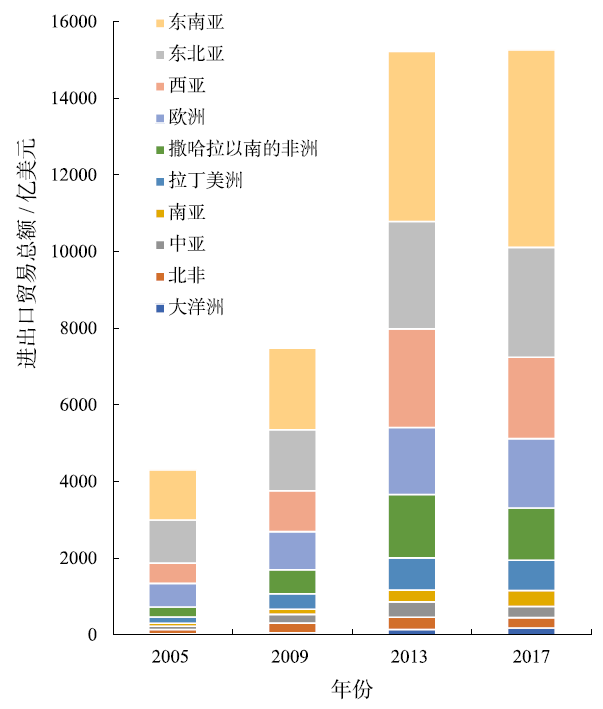
表1 研究区域的国家和空间范围Tab.1 Courtries and spatial scope of the study region |
| 区域 | 国家 |
|---|---|
| 东北亚 | 韩国、蒙古 |
| 东南亚 | 新加坡、马来西亚、缅甸、柬埔寨、越南、老挝、文莱、泰国、印度尼西亚、菲律宾 |
| 南亚 | 巴基斯坦、斯里兰卡、孟加拉国、尼泊尔、阿富汗 |
| 中亚 | 哈萨克斯坦、吉尔吉斯斯坦、塔吉克斯坦、乌兹别克斯坦 |
| 西亚 | 阿联酋、科威特、土耳其、卡塔尔、阿曼、沙特阿拉伯、伊朗、伊拉克、阿塞拜疆、格鲁吉亚、也门 |
| 北非 | 苏丹、阿尔及利亚、摩洛哥、利比亚、埃及 |
| 撒哈拉以南 的非洲 | 南非、塞内加尔、科特迪瓦、喀麦隆、塞舌尔、几内亚、加纳、赞比亚、莫桑比克、加蓬、纳米比亚、毛里塔尼亚、安哥拉、埃塞俄比亚、肯尼亚、尼日利亚、乍得、刚果布、津巴布韦、坦桑尼亚、乌干达、多哥、卢旺达、马达加斯加、赤道几内亚、马里 |
| 欧洲 | 俄罗斯、波兰、捷克、匈牙利、罗马尼亚、乌克兰、意大利、卢森堡 |
| 大洋洲 | 新西兰、巴布亚新几内亚、斐济 |
| 拉丁美洲 | 智利、玻利维亚、委内瑞拉、厄瓜多尔、秘鲁、巴拿马、古巴 |
表2 变量选取及数据来源说明Tab.2 Variables selection and data source description |
| 变量名称 | 变量选取 | 数据来源 | 预期系数符号 |
|---|---|---|---|
| 进出口贸易额 (TRADE) | 2007—2017年中国与“一带一路”国家进出口 贸易总量 | 国际贸易中心数据库(International Trade Centre) 单位:美元 | / |
| GDP乘积(GDP) | 2007—2017年中国与“一带一路”国家GDP 乘积 | 世界银行(http://data.worldbank.org.cn /indicator) 单位:美元 | + |
| 人均GDP乘积 (PGDP) | 2007—2017年中国与“一带一路”国家人均GDP乘积 | 世界银行(http://data.worldbank.org.cn/indicator) 单位:美元 | + |
| FDIt、FDIt-1、 FDIt-2、FDIt-3 | 2007—2017年中国对外直接投资流量 | 2006—2017年《中国对外直接投资统计公报》 单位:美元 | + |
| 经济自由度(ECOFREE) | 2017年“一带一路”国家经济自由度指标 | 美国传统基金会The Heritage Foundation统计世界 各国经济自由度数据 | + |
| 移民数量(IMMIGRATE) | 2005—2017年中国与“一带一路”国家间移民 人口之和 | 世界移民组织世界移民组织(https://migrationdata portal.org/data?i=stock_abs_&t=2017);单位:人 | + |
| 对外劳工派遣(EXPATRIATE) | 2007—2017年中国承包“一带一路”国家工程 项目派出人数 | 国家统计局(http://data.stats.gov.cn/easyquery. htm?cn=C01) 单位:人 | + |
| 华人华侨数量(OVERSEAS) | 2015年“一带一路”国家华人华侨数量 | 2015年世界华人华侨人口分布统计表 单位:人 | + |
| 华人华侨关系紧密度(TIGHT) | 2015年居住在“一带一路”国家的华人华侨占 对应国家人口比例与当年中国海外华人华侨人 口占中国总人口比例乘积 | 2015年世界华人华侨人口分布统计表; 及世界银行(http://data.worldbank.org.cn/indicator) | + |
| 国家距离(DIST) | 中国与“一带一路”国家首都间的距离 | 法国CEPII数据库(http://www.cepii.fr/)单位:km | – |
| 政治制度(SYSTEM) | CEPII数据库对全球国家制度功能结构的研究文件,与中国制度功能同一类别取1,否则取0 | 法国CEPII数据库(http://www.cepii.fr/) | + |
| 收入水平(INCOME) | “一带一路”国家中与中国收入水平同组取1,否则取0 | 世界银行(http://data.worldbank.org.cn/indicator) | + |
| 共同经贸组织(GROUP) | “一带一路”国家中加入APEC和上海合作组织取1,否则取0 | APEC和上海合作组织官网 | + |
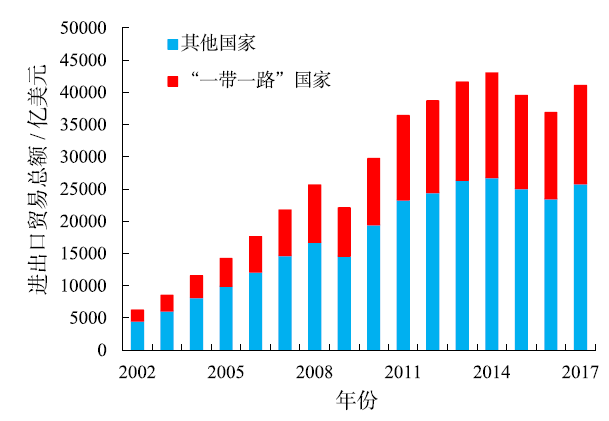
表3 中国与“一带一路”沿线国家进出口贸易总额和增长率Tab.3 Total trade volume and growth rate in total import and export between China withcountries along “the Belt and Road” |
| 年份 | 进出口贸易总额/亿美元 | 进出口贸易增长率/% |
|---|---|---|
| 2002 | 1 685.57 | — |
| 2003 | 2 407.87 | 42.85 |
| 2004 | 3 354.72 | 39.32 |
| 2005 | 4 300.77 | 28.20 |
| 2006 | 5 482.81 | 27.48 |
| 2007 | 7 078.56 | 29.10 |
| 2008 | 8 887.62 | 25.56 |
| 2009 | 7 479.39 | -15.84 |
| 2010 | 10 276.03 | 37.39 |
| 2011 | 13 094.37 | 27.43 |
| 2012 | 14 208.68 | 8.51 |
| 2013 | 15 221.89 | 7.13 |
| 2014 | 16 234.41 | 6.65 |
| 2015 | 14 441.77 | -11.04 |
| 2016 | 13 364.50 | -7.46 |
| 2017 | 15 264.04 | 14.21 |
表4 中国与“一带一路”国家进出口贸易总额回归方程多重共线性检验结果Tab.4 Multiple collinearity test results of regression equation of total import and export volume between China and countries along “the Belt and Road” |
| 变量 | R2 | VIF |
|---|---|---|
| ln(GDP) | 0.533 781 | 2.144 915 |
| ln(PGDP) | 0.767 813 | 4.306 873 |
| ln(FDIt) | 0.670 349 | 3.033 511 |
| ln(FDIt-1) | 0.658 99 | 2.932 465 |
| ln(FDIt-2) | 0.675 108 | 3.077 946 |
| ln(FDIt-3) | 0.677 621 | 3.101 939 |
| ln(ECOFREE) | 0.618 392 | 2.620 490 |
| ln(IMMIGRATE) | 0.596 116 | 2.475 958 |
| ln(EXPATRIATE) | 0.524 506 | 2.103 076 |
| ln(OVERSEAS) | 0.787 678 | 4.709 828 |
| ln(TIGHT) | 0.761 03 | 4.184 626 |
| ln(DIST) | 0.626 129 | 2.674 719 |
| SYSTEM | 0.755 152 | 4.084 167 |
| INCOME | 0.226 448 | 1.292 738 |
| GROUP | 0.491 158 | 1.965 247 |
表5 中国与“一带一路”国家进出口贸易总额回归分析结果Tab.5 Regression analysis of total import and export volume between China and countries along “the Belt and Road” |
| 解释变量 | ln(TRADE) | ||||
|---|---|---|---|---|---|
| 模型(1) | 模型(2) | 模型(3) | 模型(4) | 模型(5) | |
| β0 | 20.442(0.000 0) | -1.395(0.216 7) | 0.964(0.000 8) | 0.968(0.000 8) | 1.186(0.000 0) |
| ln(GDP) | 0.743***(0.000 0) | 0.638***(0.000 0) | 0.642***(0.000 0) | 0.645***(0.000 0) | 0.642***(0.000 0) |
| ln(PGDP) | -0.282***(0.000 0) | — | — | — | — |
| ln(FDIt) | -0.019(0.576 9) | -0.030(0.464 5) | — | — | — |
| ln(FDIt-1) | 0.018(0.583 9) | 0.023(0.557 2) | 0.035(0.399 9) | 0.043(0.265 3) | — |
| ln(FDIt-2) | 0.034(0.292 5) | 0.050(0.206 5) | 0.037(0.349 2) | 0.047(0.196 5) | 0.082***(0.004 2) |
| ln(FDIt-3) | -0.003(0.9209) | 0.032(0.3847) | 0.022(0.5625) | — | — |
| ln(ECOFREE) | -2.236***(0.0000) | — | — | — | |
| ln(IMMIGRATE) | 0.054***(0.0000) | 0.047***(0.0000) | 0.033***(0.0009) | 0.033***(0.0009) | 0.029***(0.0014) |
| ln(EXPATRIATE) | -0.052*(0.005 0) | 0.022(0.252 5) | 0.017(0.378 2) | 0.019(0.343 0) | — |
| ln(OVERSEAS) | -0.387***(0.000 0) | — | — | — | — |
| ln(TIGHT) | 0.515***(0.000 0) | — | — | — | — |
| ln(DIST) | 0.441***(0.000 0) | 0.284**(0.013 8) | — | — | — |
| SYSTEM | 0.091(0.6221) | 0.492***(0.0011) | 0.325**(0.0227) | 0.331**(0.0196) | 0.398***(0.0034) |
| INCOME | -0.103(0.320 7) | -0.574***(0.000 0) | — | — | — |
| GROUP | 1.334***(0.000 0) | 0.894***(0.000 0) | 0.793***(0.000 0) | 0.796***(0.000 0) | 0.847***(0.000 0) |
| R2 | 0.896 7 | 0.845 7 | 0.825 0 | 0.824 8 | 0.822 9 |
| Adjusted R2 | 0.890 1 | 0.838 5 | 0.819 2 | 0.819 7 | 0.819 3 |
注:括号中为P值;***表示P值<0.01,**表示P值<0.05,*表示P值<0.1,分别对应变量系数通过1%、5%和10%的显著性检验。 |
表6 中国投资对“一带一路”国家双边贸易带动影响力分类Tab.6 The effect types of China's investment upon countries’ trade along “the Belt and Road” Route |
| 类型 | 国家 |
|---|---|
| 投资带动力巨大型(8个) | 刚果布、阿曼、安哥拉、多哥、伊拉克、毛里塔尼亚、阿联酋、几内亚 |
| 投资带动型(30个) | 沙特阿拉伯、伊朗、蒙古、科威特、南非、越南、吉尔吉斯斯坦、科特迪瓦、莫桑比克、韩国、加蓬、塞内加尔、赞比亚、赤道几内亚、利比亚、马来西亚、巴拿马、缅甸、乌克兰、柬埔寨、智利、加纳、匈牙利、孟加拉国、新加坡、波兰、肯尼亚、卡塔尔、尼日利亚、也门 |
| 投资一般型(32个) | 泰国、阿尔及利亚、坦桑尼亚、意大利、菲律宾、喀麦隆、秘鲁、摩洛哥、哈萨克斯坦、俄罗斯、埃及、斯里兰卡、马达加斯加、老挝、土耳其、津巴布韦、埃塞俄比亚、委内瑞拉、巴基斯坦、印度尼西亚、厄瓜多尔、罗马尼亚、新西兰、巴布亚新几内亚、格鲁吉亚、苏丹、乌兹别克斯坦、阿塞拜疆、塔吉克斯坦、古巴、斐济、尼泊尔 |
| 投资带动力不足型(11个) | 玻利维亚、纳米比亚、阿富汗、文莱、乍得、乌干达、捷克、卢森堡、马里、卢旺达、塞舌尔 |
| [1] |
|
| [2] |
|
| [3] |
|
| [4] |
|
| [5] |
|
| [6] |
陈立敏, 杨振, 侯再平 . 2010. 出口带动还是出口代替?——中国企业对外直接投资的边际产业战略检验. 财贸经济,( 2):78-85.
[
|
| [7] |
陈伟光, 郭晴 . 2016. 中国对“一带一路”沿线国家投资的潜力估计与区位选择. 宏观经济研究,( 9):148-161.
[
|
| [8] |
|
| [9] |
陈信伟, 姚佐文 . 2011. 滞后效应视角下FDI对经济增长影响的实证研究. 技术经济, 30(4):96-101.
[
|
| [10] |
|
| [11] |
公丕萍, 宋周莺, 刘卫东 . 2015. 中国与“一带一路”沿线国家贸易的商品格局. 地理科学进展, 34(5):571-580.
[
|
| [12] |
顾雪松, 韩立岩, 周伊敏 . 2016. 产业结构差异与对外直接投资的出口效应——“中国-东道国”视角的理论与实证. 经济研究, 51(4):102-115.
[
|
| [13] |
|
| [14] |
胡志丁, 葛岳静, 骆华松, 周尚意, 刘建忠, 宋涛, 吴良, 秦奇, 彭飞, 王淑芳, 马腾 . 2019. 地缘环境解析:理论与方法笔谈. 世界地理研究, 28(2):2-12.
[
|
| [15] |
孔庆峰, 董虹蔚 . 2015. “一带一路”国家的贸易便利化水平测算与贸易潜力研究. 国际贸易问题,( 12):158-168.
[
|
| [16] |
梁茂林, 骆华松, 彭邦文, 渠立权 . 2017. 中国与中南半岛国家双边关系演进及形成机理研究. 世界地理研究, 26(3):1-11.
[
|
| [17] |
梁育填, 周政可, 刘逸 . 2018. 东南亚华人华侨网络与中国企业海外投资的区位选择关系研究. 地理学报, 73(8):1449-1461.
[
|
| [18] |
|
| [19] |
|
| [20] |
潘海峰, 魏宏杰 . 2018. 金融发展、FDI与经济增长关联性的空间效应特征识别. 统计与决策, 34(22):154-157.
[
|
| [21] |
渠立权, 骆华松 . 2019. 中国沿边地区地缘经济格局的建构:一个理论分析框架. 世界地理研究, 28(2):96-104.
[
|
| [22] |
孙朋军, 于鹏 . 2016. 文化距离对中国企业落实“一带一路”投资战略的影响. 中国流通经济, 30(2):83-90.
[
|
| [23] |
|
| [24] |
王丰龙, 司月芳, 曾刚 . 2019. 地缘战略视角下“一带一路”倡议对中国对外直接投资的影响研究. 人文地理, 34(1):72-79.
[
|
| [25] |
项本武 . 2009. 中国对外直接投资的贸易效应研究——基于面板数据的协整分析. 财贸经济 (4): 77-82, 137.
[
|
| [26] |
熊琛然, 王礼茂, 屈秋实, 方叶兵, 向宁 , 2019. 地缘政治环境中的情景分析:中国的视角. 世界地理研究, 28(3):1-10.
[
|
| [27] |
杨文龙, 杜德斌 . 2018a. “一带一路”沿线国家投资网络结构及其影响因素:基于ERGM模型的研究. 世界经济研究 (5): 80-94, 136-137.
[
|
| [28] |
杨文龙, 杜德斌, 马亚华, 焦美琪 . 2018 b.“一带一路”沿线国家贸易网络空间结构与邻近性. 地理研究, 37(11):2218-2235.
[
|
| [29] |
张春萍 . 2012. 中国对外直接投资的贸易效应研究. 数量经济技术经济研究, 29(6):74-85.
[
|
| [30] |
张纪凤, 黄萍 . 2013. 替代出口还是促进出口——我国对外直接投资对出口的影响研究. 国际贸易问题,( 3):95-103.
[
|
| [31] |
邹嘉龄, 刘春腊, 尹国庆, 唐志鹏 . 2015. 中国与“一带一路”沿线国家贸易格局及其经济贡献. 地理科学进展, 34(5):598-605.
[
|
| [32] |
邹嘉龄, 刘卫东 . 2016. 2001—2013年中国与“一带一路”沿线国家贸易网络分析. 地理科学, 36(11):1629-1636.
[
|
/
| 〈 |
|
〉 |
