
京广空中廊道系统延误弹性测算与航空流运行结构分析
|
张一诺(1995–),女,河北衡水人,硕士研究生,主要从事信息经济地理研究,(E-mail) zh_yinuo@126.com。 |
收稿日期: 2019-07-28
要求修回日期: 2020-01-06
网络出版日期: 2020-05-15
基金资助
国家自然科学基金项目(41671121)
版权
Calculation of the System Delay Elasticity of the Beijing-Guangzhou Air Corridor with Analysis of the Air Flow Operation Structure
Received date: 2019-07-28
Request revised date: 2020-01-06
Online published: 2020-05-15
Copyright
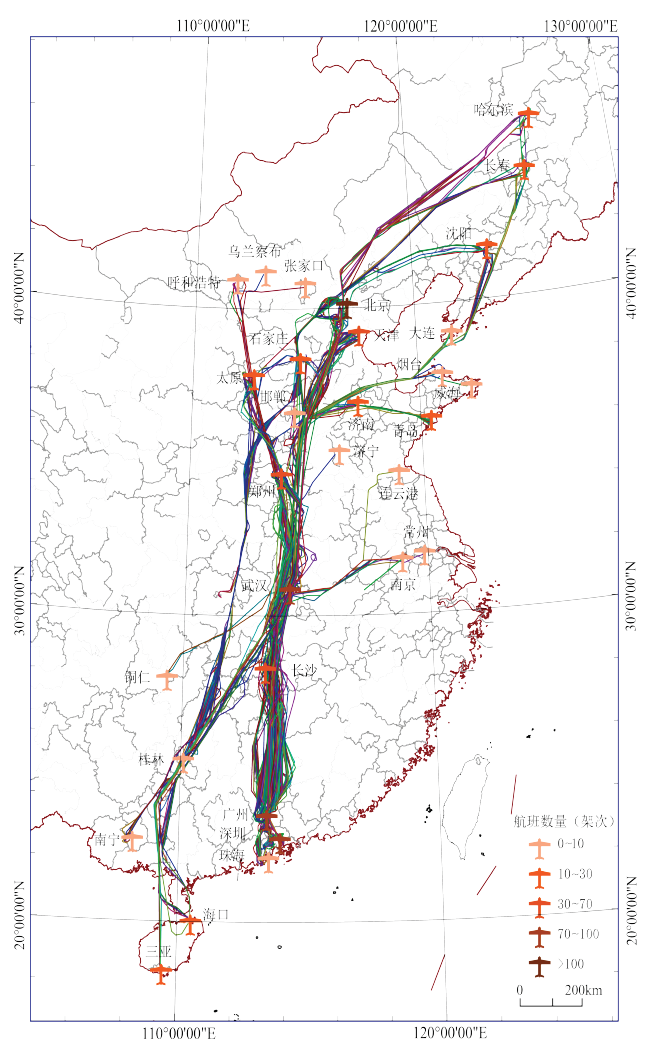
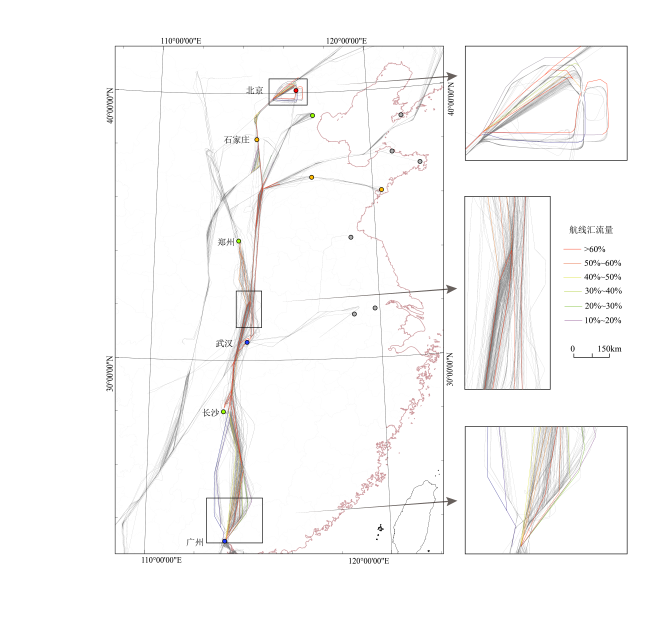
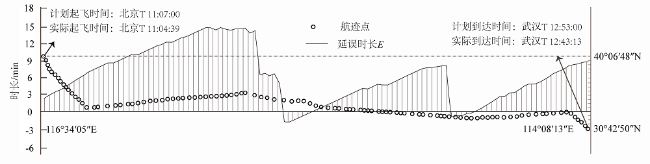
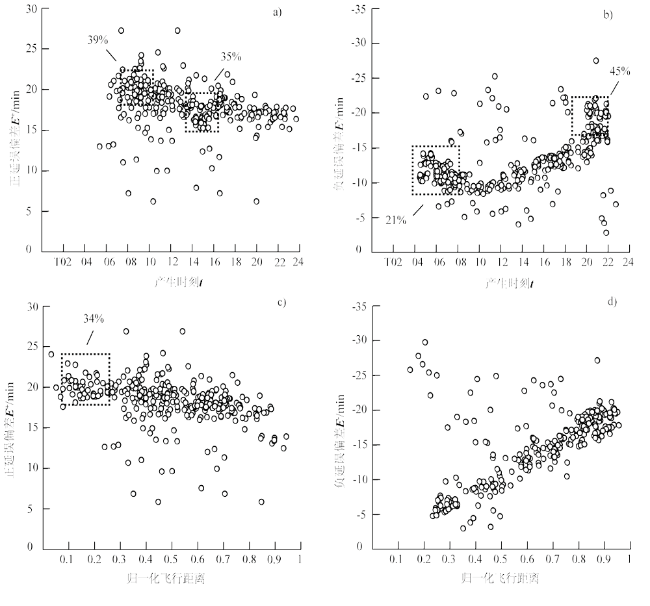
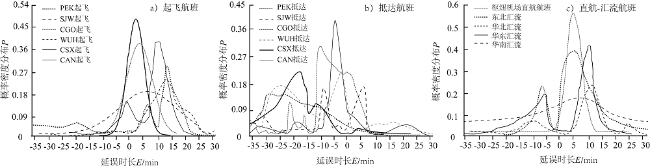
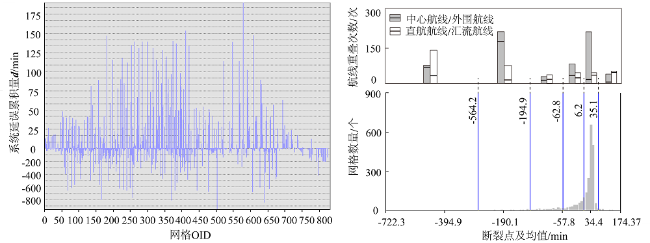
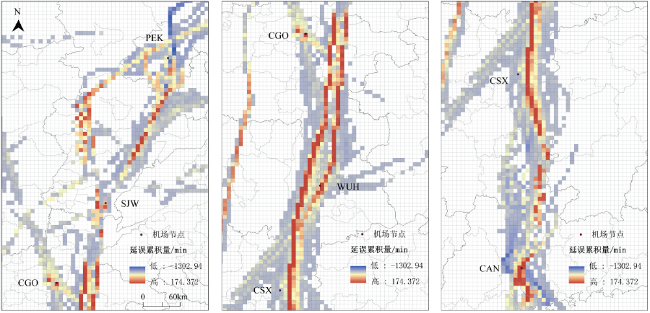
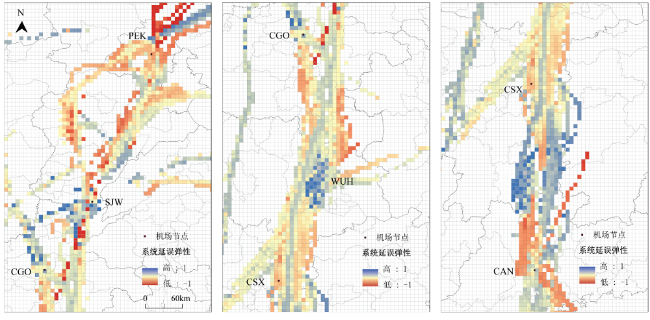
文章构建了一个多层次系统延误弹性测算框架,应用京广空中廊道24 h全部848架次航班实际航迹点数据,测算了单个航班延误偏差、系统延误累积量和系统延误弹性系数,分析了其与航空流运行结构的关系。结果表明:1)该空中廊道航班飞行过程中以延误产生为主且在低流量时段表现出延误吸收能力;沿线枢纽机场起飞航班延误均值普遍高于抵达航班,随枢纽机场等级提高和承载流量增加出现更高的航班延误均值和峰值振幅;以延误偏差>15 min标准统计,各汇流航线的延误概率和均值都高于沿线枢纽机场间直航航线,在该空中廊道贡献了正延误。2)整体呈现出中心航迹延误累积–外围航迹延误恢复的动态过程,大密度流量汇聚成为延误叠加累积的主要原因;3)系统延误弹性具有空间异质性,随机场节点间流量分散程度增加而显著提高,多样性可选路径引发积极的延误吸收而使其具有较强的延误恢复能力。4)航空流运行结构对空中廊道系统延误弹性的影响是通过中心航迹–外围航迹和航迹簇流量汇聚2个关键要素实现的,延误恢复是1个多路径选择的过程,航线重构策略优于固定航线策略。

张一诺 , 路紫 , 丁疆辉 . 京广空中廊道系统延误弹性测算与航空流运行结构分析[J]. 热带地理, 2020 , 40(2) : 194 -205 . DOI: 10.13284/j.cnki.rddl.003219
During the last 10 years, aviation demand in China grew faster than transport capacity, leading to the intensification of the conflict between airspace capacity and flight flow and causing significant route congestion and flight delays. The Beijing-Guangzhou air corridor is considered the core component of the “inverted N-shaped north-south frame” of China’s air corridor pattern. In this study, a multi-level measurement framework that includes delay, duration-delay and accumulation-delay elasticity coefficient was constructed. By applying the actual track point data of 848 flights during a 24 h period in the Beijing-Guangzhou air corridor, the duration of the delay of a single flight, the system delay accumulation, and the system delay elasticity coefficient were calculated. The delay elasticity of the Beijing-Guangzhou air corridor system was evaluated, and its relationship with the air flow structure was analyzed. The improvement of the node-link settings and grid division reflected the characteristics of fine-grained research and the reasons for the heterogeneity of the delay elasticity were analyzed based on the airline network structure. The research suggests that: 1) overall, the flights in this air corridor primarily generate delay and show delay absorption capacity in low traffic periods. The average delay time for flights is 1.4 min. The mean delay of departure flights is generally higher than that of arrival flights. With the increase of flow intensity between hub airports, the mean and peak amplitudes of flight delay increase. According to the standard statistics of delay duration >15 min, the probability density and mean delay of each confluent flight are higher than those of a direct flight between the hub airports; 2) the delay of the Beijing-Guangzhou air corridor system presents a dynamic process that accumulates in the central route while peripheral routes recover. The accumulated delay of central airlines is 689 min, while the recovery of peripheral airlines is 936 min. The preference of the operators for central routes makes high-density traffic convergence the principal cause of delay accumulation; 3) the delay elasticity of the Beijing-Guangzhou air corridor system varies greatly among different air route segments and improves significantly with an increase in the number of paths and the dispersion of traffic flow between nodes. Multi-link air route segments trigger active delay absorption and thus have a strong delay recovery ability. The relationship between the delay elasticity and the air flow operation structure of the air corridor system is established by three key elements: the central route, the peripheral route, and the track clusters. This article provides a new perspective for the measurement and understanding of system delay elasticity and a basis for the selection of diverse routes and flight schedules in air corridors. Contrary to the previous elastic strategy of adjusting the allocation of flight slot resources and retaining the remaining capacity, this study reflects that flexible airspace utilization and dynamic airspace management, namely, adaptive route reconstruction and optimization of connections, would improve the efficiency of the system elasticity guarantee system.

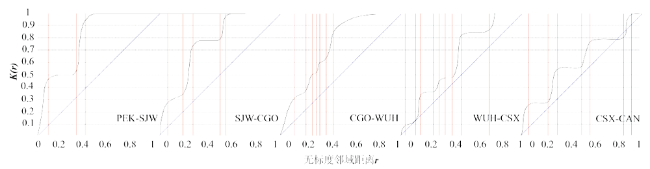
图2 京广空中廊道各航路段航迹点空间聚类k -function曲线及拐点位置Fig.2 Multi-distance spatial clustering k-function curve and inflection point position of each flight path section of the Beijing-Guangzhou air corridor |
表1 京广空中廊道各航路段间系统弹性系数均值及4个指标贡献率Table 1 The average elastic coefficient and contribution rate of 4 indexes of each air route segment in the Beijing-Guangzhou air corridor |
| 航路段 | 航线 | 中心航迹 汇聚流量/% | 外围航迹汇 聚流量/% | E+贡献值 | E-贡献值 | d+贡献值 | d-贡献值 | D均值 |
|---|---|---|---|---|---|---|---|---|
| PEK-SJW | 直航航班 | 97.5 | 2.5 | 0.23 | 0.77 | 0.78 | 0.22 | -0.12 |
| SJW-CGO | 直航航班 | 79.2 | 20.8 | 0.64 | 0.05 | 0.17 | 0.24 | 0.39 |
| 东北汇流 | 0.15 | 0.16 | 0.41 | 0.18 | ||||
| CGO-WUH | 直航航班 | 80.4 | 19.6 | 0.28 | 0.26 | 0.36 | 0.16 | 0.48 |
| 华北汇流 | 0.29 | 0.17 | 0.39 | 0.09 | ||||
| WUH-CSX | 直航航班 | 67.5 | 32.5 | 0.21 | 0.26 | 0.15 | 0.22 | 0.88 |
| 华东汇流 | 0.14 | 0.02 | 0.06 | 0.03 | ||||
| 华南汇流 | 0.13 | 0.24 | 0.46 | 0.08 | ||||
| CSX-CAN | 直航航班 | 49.6 | 50.4 | 0.61 | 0.39 | 0.72 | 0.28 | 0.79 |
| [1] |
|
| [2] |
|
| [3] |
|
| [4] |
曹小曙, 梁斐雯, 陈慧灵 . 2019. 特大城市空间形态差异对交通网络效率的影响. 地理科学, 39(1):41-51.
[
|
| [5] |
|
| [6] |
|
| [7] |
董雅晴, 路紫, 刘媛, 张秋娈 . 2018. 中国空中廊道划设与时空拥堵识别及其航线流量影响. 地理学报, 73(10):2001-2013.
[
|
| [8] |
杜德林, 莫辉辉, 王姣娥 . 2019. 三大国有航空公司网络空间结构比较与演化. 热带地理, 39(2):196-205.
[
|
| [9] |
|
| [10] |
Eurocontrol. 2010. Network Congestion 2030 Project, Final Report Volume II, Isdefe and Innaxis for Eurocontrol. Netherlands: Eurocontrol.
|
| [11] |
|
| [12] |
|
| [13] |
|
| [14] |
|
| [15] |
|
| [16] |
|
| [17] |
|
| [18] |
|
| [19] |
|
| [20] |
莫辉辉, 王姣娥, 黄洁 . 2018. 中国枢纽机场网络体系演变格局. 热带地理, 38(5):599-605.
[
|
| [21] |
|
| [22] |
|
| [23] |
|
| [24] |
|
| [25] |
|
| [26] |
|
/
| 〈 |
|
〉 |