
代表性人口空间分布数据集的精度评价——以2010年广东省为例
|
林丹淳(1995—),女,广东揭阳人,硕士研究生,研究方向为公共健康与GIS 应用,(E-mail) lindch3@mail2.sysu.edu.cn。 |
收稿日期: 2019-06-17
要求修回日期: 2020-01-06
网络出版日期: 2020-05-15
基金资助
国家自然科学基金重点项目(41531178)
广东省自然科学基金研究团队项目(2014A030312010)
版权
Accuracy Comparison of Four Gridded Population Datasets in Guangdong Province, China
Received date: 2019-06-17
Request revised date: 2020-01-06
Online published: 2020-05-15
Copyright
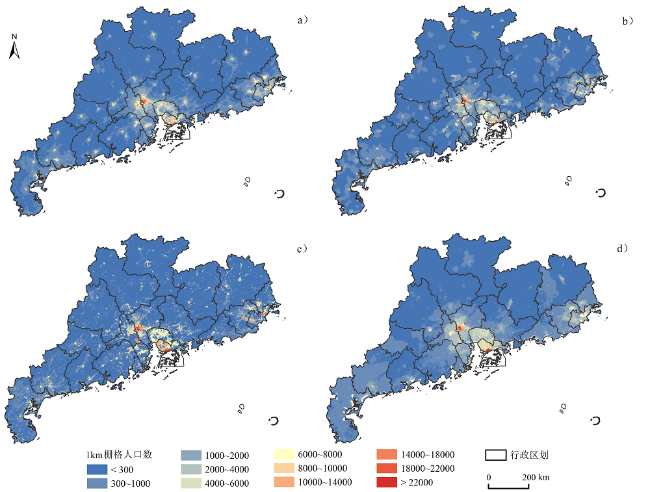
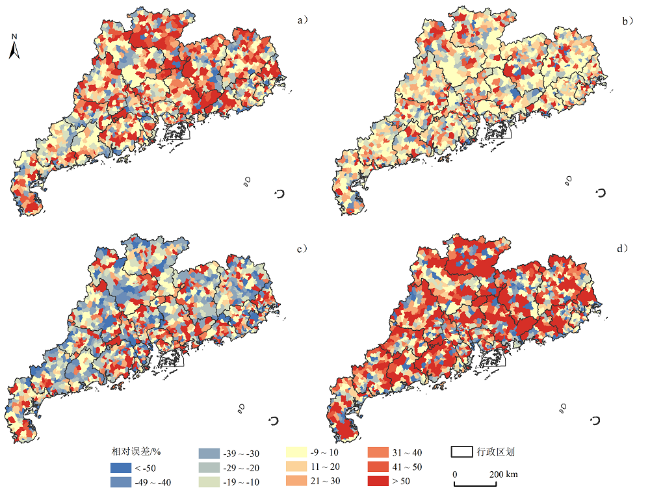
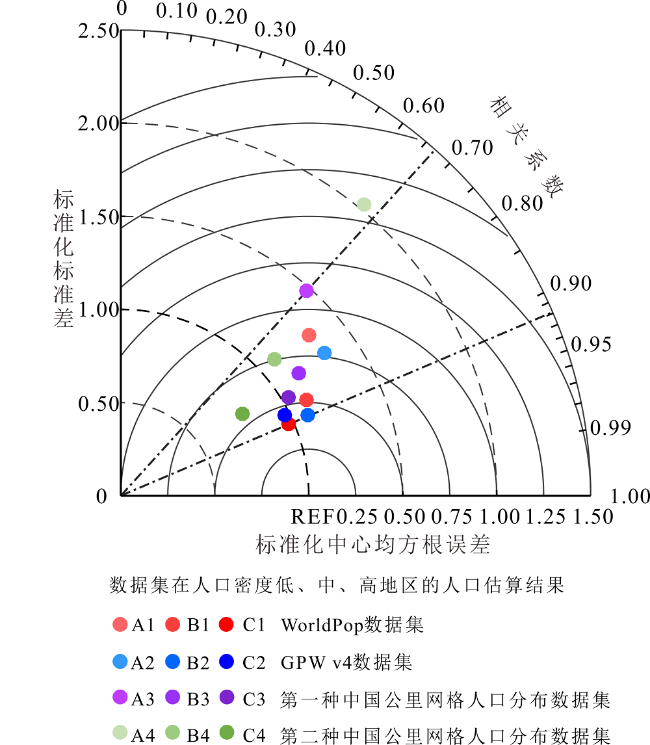
以人口密度差异显著的广东省为研究区,比较Worldpop、GPW v4和2种中国公里网格人口分布数据集的空间分布一致性,并以第六次全国人口普查数据为真值,按人口密度分为高、中、低3组,从误差的数值分布和空间分布两方面定量评价4种数据集的精度,最后讨论估算误差的可能来源及数据适用性。结果表明,4种网格人口数据集中Worldpop整体精度最高,且在人口密集区的精度也是最高;GPW v4在低人口密度和中人口密度区域精度略高于Worldpop,但对镇街内人口分布细节刻画不够详细;2种中国公里网格人口分布数据集精度较前两者低,主要受空间化方法和模型变量的选择所限制。Worldpop适合用于人口密度中等及人口密度高区域的精细化研究,GPW v4适合用于长时序、最小研究单元大于镇街的研究,第一种中国公里网格人口分布数据集适合用于需要考虑镇街内人口分布和空间异质性的研究,第二种中国公里网格人口分布数据集适用于需要考虑人口分布细节和空间格局变化的长时序研究。
关键词: Worldpop; GPW v4; 中国公里网格人口分布数据集; 精度对比; 广东省
林丹淳 , 谭敏 , 刘凯 , 柳林 , 朱远辉 . 代表性人口空间分布数据集的精度评价——以2010年广东省为例[J]. 热带地理, 2020 , 40(2) : 346 -356 . DOI: 10.13284/j.cnki.rddl.003220
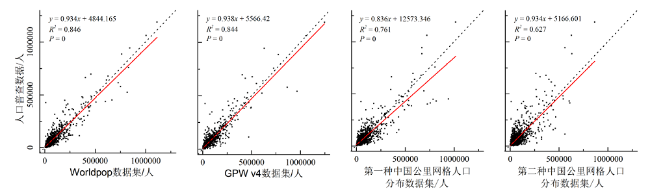
The spatial distribution of population is foundational information for policy making, disaster prevention, economic development, environmental protection, and natural sciences or socioeconomic research. Analyzing different gridded population products is essential for learning their characteristics and proper application. Considering timeliness of data and convenience of access, this study compared the spatial consistency of WorldPop, GPW v4 (Gridded Population of World, version 4) and two types of Gridded Population of China datasets in Guangdong Province, China, a province with significant population density differences. The sixth census data in 2010 were divided into high, middle, and low density groups and used as reference data to validate these four datasets on numerical and spatial distribution of error. Moreover, the study used average absolute error, average relative error, root mean square error, correlation coefficient, four indicators, ratio error statistics, and the Taylor diagram for quantitative evaluation. Then, the spatial distribution of the ratio error and the accuracy of the four datasets in different population density regions were analyzed. Finally, an evaluation of error sources and applications from two aspects, including methods for spatializing census data and variables selection of spatial model, was performed. The findings of the study are as follows: 1) These four population datasets have similar spatial distribution trends, and the population is concentrated in the Pearl River Delta regions such as Guangzhou, Shenzhen, Dongguan, Foshan, Zhongshan and Chaoshan regions such as Shantou and Jieyang. The WorldPop dataset had the highest relative accuracy in the whole Guangdong Province, as well as in the high population density area, whereas the GPW v4 dataset performed better than WorldPop in the middle and low population density areas; however, GPW v4 had a shortcoming in depicting population distribution beneath the township level because of the areal-weighting method used. The two types of Gridded Population of China datasets had relatively lower accuracy than the other two datasets. 2) The accuracy of the four population datasets in Guangdong Province was limited mainly by the spatial method based on the regression algorithm, the weighting method, the selection of model variables, and also related to the geographical and social environment of Guangdong Province. 3) The WorldPop dataset is suitable for detailed research in areas with medium and high population density, GPW v4 is suitable for long-time, minimal research units larger than townships, and the first type of Gridded Population of China dataset is suitable for study that requires consideration of the distribution and spatial heterogeneity of population beneath the township level. The second type of Gridded Population of China dataset is suitable for long-time study that requires consideration of the details of the population distribution and changes of spatial pattern. This study provides important basic information for research and applications using gridded population datasets.

表1 4种数据集的基本信息Table 1 Introduction of four datasets used in this study |
| 数据集 | 人口数据来源 | 空间化辅助数据 | 空间化方法 | 空间分辨率 | 时间分辨率 |
|---|---|---|---|---|---|
| Worldpop | 2010年第六次全国人口普查数据,区县人口数 | 灯光亮度、高程、坡度、到水体的距离、到河流的距离、到1990年建成区的距离、到2000年建成区的距离、到2010年建成区的距离、行政区划 | 随机森林模型 | 100 m | 2000—2020 |
| GPW v4 | 2010年第六次全国人口普查数据,镇街人口数 | 水域、联合国历史人口估计数、行政区划 | 面积权重法,水域作掩膜处理 | 30弧秒,相当于赤道处1 km | 2000、2005、2010、2015、2020 |
| 第一种中国公里网格 人口分布数据集 | 2010年第六次全国人口普查数据,区县人口数 | 耕地、林地、草地、农村居民点、城镇居民点、工交建设用地、行政区划 | 基于土地利用的多元统计分区建模 | 1 km | 2005、2010 |
| 第二种中国公里网格 人口分布数据集 | 2010年第六次全国人口普查数据,区县人口数 | 土地利用类型、夜间灯光亮度、居民点密度、行政区划 | 多因子权重分配法 | 1 km | 1990、1995、2000、2005、2010、2015 |
表2 4种网格人口分布数据集在广东省按地理面积分布的基尼系数Table 2 The Gini coefficient according to geographical distribution of four datasets in Guangdong Province |
| 基尼系数 | Worldpop | GPW v4 | 中国公里网格人口分布数据集 | |
|---|---|---|---|---|
| 第一种 | 第二种 | |||
| 市级 | 0.378 | 0.370 | 0.379 | 0.377 |
| 镇街级 | 0.547 | 0.564 | 0.560 | 0.542 |
表3 4种网格人口分布数据集在广东省的误差Table 3 The accuracy assessment of four datasets in Guangdong Province |
| 数据集 | 估算总人口数/人 | 绝对误差 | 相对误差/% |
|---|---|---|---|
| Worldpop | 104 464 941 | 419 805 | 0.40 |
| GPW v4 | 10 3071 531 | 1 813 215 | 1.73 |
| 第一种中国公里网格人口分布数据集 | 10 3559 084 | 1 325 662 | 1.26 |
| 第二种中国公里网格人口分布数据集 | 103 464 238 | 1 420 508 | 1.35 |
表4 4种网格人口分布数据集在广东省比率误差数值分布Table 4 The ratio error of four datasets in Guangdong Province |
| 比率误差/% | Worldpop | GPW v4 | 第一种中国公里网格 人口分布数据集 | 第二种中国公里网格 人口分布数据集 | |||||||
|---|---|---|---|---|---|---|---|---|---|---|---|
| 个数/个 | 比例/% | 个数/个 | 比例/% | 个数/个 | 比例/% | 个数/个 | 比例/% | ||||
| <-30 | 258 | 18.00 | 222 | 15.49 | 438 | 30.57 | 322 | 22.47 | |||
| -30~-20 | 128 | 8.93 | 144 | 10.05 | 155 | 10.82 | 77 | 5.37 | |||
| -20~-10 | 133 | 9.28 | 180 | 12.56 | 148 | 10.33 | 91 | 6.35 | |||
| -10~10 | 280 | 19.54 | 412 | 28.75 | 220 | 15.35 | 204 | 14.24 | |||
| 10~20 | 117 | 8.16 | 154 | 10.75 | 89 | 6.21 | 96 | 6.70 | |||
| 20~30 | 91 | 6.35 | 87 | 6.07 | 62 | 4.33 | 73 | 5.09 | |||
| >30 | 426 | 29.73 | 234 | 16.33 | 321 | 22.40 | 570 | 39.78 | |||
表5 4种网格人口分布数据集在不同人口密度区域的误差Table 5 Accuracy assessment of four datasets in high, middle and low population density area |
| 人口密度区域 | 数据集 | 平均绝对误差 | 平均相对误差/% | 均方根误差 | 相关系数 | |
|---|---|---|---|---|---|---|
| 低 | Worldpop | 9 345.11 | 59.26 | 13 829.01 | 0.758 | |
| GPW v4 | 5 652.92 | 34.61 | 10 900.86 | 0.817 | ||
| 中国公里网格人口分布数据集 | 第一种 | 9 138.65 | 46.97 | 15 132.75 | 0.669 | |
| 第二种 | 18 387.90 | 118.53 | 28 039.27 | 0.639 | ||
| 中 | Worldpop | 22 670.02 | 34.52 | 36 841.76 | 0.888 | |
| GPW v4 | 17 618.00 | 28.79 | 31 336.51 | 0.917 | ||
| 中国公里网格人口分布数据集 | 第一种 | 29 184.58 | 45.35 | 47 601.60 | 0.821 | |
| 第二种 | 31 936.10 | 47.27 | 54 695.97 | 0.744 | ||
| 高 | Worldpop | 45 502.59 | 33.93 | 70 325.61 | 0.919 | |
| GPW v4 | 49 465.10 | 39.59 | 79 885.08 | 0.896 | ||
| 中国公里网格人口分布数据集 | 第一种 | 60 789.64 | 46.54 | 93 916.65 | 0.861 | |
| 第二种 | 76 571.97 | 50.52 | 111 506.48 | 0.826 | ||
| [1] |
柏中强, 王卷乐, 杨飞 . 2013. 人口数据空间化研究综述. 地理科学进展, 32(11):1692-1702.
[
|
| [2] |
|
| [3] |
董南, 杨小唤, 蔡红艳 . 2016. 人口数据空间化研究进展. 地球信息科学学报, 18(10):1295-1304.
[
|
| [4] |
|
| [5] |
付晶莹, 江东, 黄耀欢 . 2014. 中国公里网格人口分布数据集. 地理学报(增刊), 69:41-44.
[
|
| [6] |
高义, 王辉, 王培涛, 孙晓宇, 吕婷婷 . 2013. 基于人口普查与多源夜间灯光数据的海岸带人口空间化分析. 资源科学, 35(12):2517-2523.
[
|
| [7] |
|
| [8] |
广东省民政厅, 广东省地图出版社. 2010. 广东省政区图册. 广州: 广东省地图出版社.
[ Department of Civil Affairs Province and Cartographic Publishing House of Guangdong Province. 2010. Guangdong Province Administrative Region Atlas. Guangzhou: Cartographic Publishing House of Province. ]
|
| [9] |
广东省统计局. 2010. 广东统计年鉴. 北京: 中国统计出版社.
[ Statistics Bureau of Guangdong Province. 2010. Guangdong Statistical Yearbook. Beijing: China Statistics Press. ]
|
| [10] |
郭洪旭, 黄莹, 赵黛青 . 2013. 城市居住人口空间分布的模拟研究——以广州市天河区为例. 热带地理, 33(1):81-87.
[
|
| [11] |
|
| [12] |
贾俊平, 何晓群, 金勇 . 2009. 统计学(第四版). 北京: 中国人民大学出版社.
[
|
| [13] |
江东, 杨小唤, 王乃斌, 刘红辉 . 2002. 基于RS、GIS的人口空间分布研究. 地球科学进展, 17(5):734-738.
[
|
| [14] |
廖顺宝, 张赛 . 2009. 属性数据空间化误差评价指标体系研究. 地球信息科学学报, 11(2):176-182.
[
|
| [15] |
|
| [16] |
廖一兰, 王劲峰, 孟斌, 李新虎 . 2007. 人口统计数据空间化的一种方法. 地理学报, 62(10):1110-1119.
[
|
| [17] |
|
| [18] |
茆诗松 . 2004. 概率论与数理统计教程. 北京: 高等教育出版社.
[
|
| [19] |
史培军 . 2011. 中国自然灾害风险地图集. 北京: 科学出版社.
[
|
| [20] |
谭敏, 刘凯, 柳林, 朱远辉, 王大山 . 2017. 基于随机森林模型的珠江三角洲30 m格网人口空间化. 地理科学进展, 36(10):1304-1312.
[
|
| [21] |
|
| [22] |
|
| [23] |
|
| [24] |
田永中, 陈述彭, 岳天祥, 朱莉芬, 王英安, 范泽孟, 马胜男 . 2004. 基于土地利用的中国人口密度模拟. 地理学报, 59(2):283-292.
[
|
| [25] |
王雪梅, 李新, 马明国 . 2004. 基于遥感和GIS的人口数据空间化研究进展及案例分析. 遥感技术与应用. 19(5):320-327.
[
|
| [26] |
[
|
| [27] |
|
| [28] |
郑建, 罗光杰, 李阳兵, 周志明, 王世杰 . 2013. 基于聚落演变的岩溶山区小尺度人口数推算方法——以普定后寨河地区为例. 热带地理, 33(2):141-146,177.
[
|
| [29] |
|
| [30] |
卓莉, 陈晋, 史培军, 辜智慧, 范一大, 一之瀬俊明 . 2005. 基于夜间灯光数据的中国人口密度模拟. 地理学报, 60(2):266-276.
[
|
| [31] |
卓莉, 黄信锐, 陶海燕, 王芳, 谢育航 . 2014. 基于多智能体模型与建筑物信息的高空间分辨率人口分布模拟. 地理研究, 33(3):520-531.
[
|
/
| 〈 |
|
〉 |