
高铁开通对民族地区旅游业发展的影响
|
张自强(1986—),男,贵州遵义人,博士,副教授,主要研究方向为旅游经济,(E-mail)532959728@qq.com。 |
收稿日期: 2020-10-13
修回日期: 2020-11-30
网络出版日期: 2021-09-13
基金资助
贵州省哲学社会科学规划青年项目(21GZQN08)
Impact of High-Speed Rail on Tourism Development in Ethnic Regions
Received date: 2020-10-13
Revised date: 2020-11-30
Online published: 2021-09-13
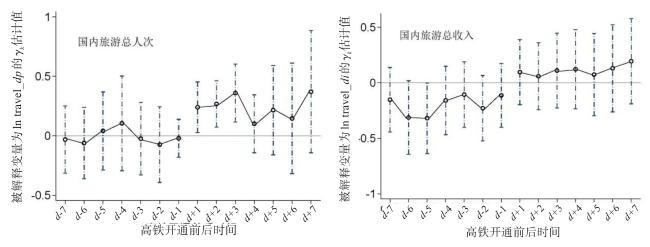
高铁快速发展极大地提升了目的地可达性,民族地区交通条件落后但旅游资源独特,高铁开通能否成为推动民族地区旅游业发展的引擎,抑或加剧发展差距,亟待检验高铁的旅游经济效应。基于2000—2017年中国20个民族地区的省级面板数据,运用多期双重差分法评估高铁开通对民族地区旅游业发展的影响。结果发现,高铁开通促进了民族地区的国内旅游总人次和国内旅游总收入分别平均增长16.52%和23.29%,对站点地区具有增长效应,但对地区间旅游业发展差距的影响不显著,不具有分配效应,表明高铁开通能成为民族地区旅游业发展的引擎;影响机制检验发现,高铁开通具有扩散效应和结构效应,但未观察到虹吸效应和过道效应;动态性检验发现,高铁开通对旅游业发展的增长效应在开通后第一二年仍显著,而分配效应均不显著。
张自强 , 陈萍 , 杨重玉 . 高铁开通对民族地区旅游业发展的影响[J]. 热带地理, 2021 : 1 -14 . DOI: 10.13284/j.cnki.rddl.17.张自强2020-0574
High-speed rail (HSR) has significantly improved the accessibility of tourist destinations, thereby promoting the increase and gathering of tourist flow. In addition to promoting the development of tourism, the HSR may exacerbate the gap in regional tourism development. Thus, the tourism economic growth effect and distribution effect of HSR opening coexist. Existing studies are controversial regarding the growth effect. Moreover, they have not considered the distribution effect. Accordingly, it is urgent to test whether the HSR can become a promotion engine for the development of regional tourism or aggravate the development gap. Using provincial panel data of 20 ethnic regions in China from 2000 to 2017, this study evaluated the applicability of the difference-in-differences (DID) method through parallel trend testing and used DID to evaluate the impact of the HSR on tourism development in ethnic regions. In addition, three factors need to be considered to ensure robust estimation results. First, a placebo test is performed. According to the counterfactual hypothesis, the opening year of the HSR is advanced by two years, and the DID is used to perform an estimation again. Second, robustness tests are conducted using semiparametric-DID to perform an estimation and DID to perform an estimation by replacing the explanatory and control variables, respectively. Finally, the endogeneity test is conducted using Two-stage least squares method. The major research conclusions are as follows: 1) Overall, HSR has promoted the development of tourism in ethnic regions, with an average increase of 16.52% in total domestic tourist arrivals and of 23.29% in total domestic tourism revenue. Thus, HSR has a growth effect on the tourism economy in ethnic areas. Furthermore, HSR does not affect the gap in total domestic tourist arrivals among ethnic regions or in total domestic tourism income among ethnic regions. Hence, HSR does not have a distribution effect on the tourism economy in ethnic regions. 2) From the perspective of robustness, after replacing the variables and estimation methods, the HSR has a significant positive impact on the total domestic tourist arrivals and domestic tourism revenue in ethnic regions. That is, while it still has the growth effect of the tourism economy, it does not have the distribution effect, indicating that the overall estimation result is relatively robust. 3) From the perspective of the impact mechanism, HSR has a significant positive impact on GDP growth and industrial structure adjustment in ethnic regions, but it has no significant impact on population at the end of the year, passenger turnover, and cargo weekly transshipment volume. That is, the HSR has diffusion and structural effects but does not have a siphon or aisle effect in ethnic areas. Thus, the tourism economic growth effect of HSR in the minority areas is mainly due to the diffusion effect of HSR. Tourist flows from central cities or regions continue to flow to relatively remote ethnic regions and, simultaneously, promote the adjustment of the industrial structure in ethnic regions. As there is no siphon or aisle effect, HSR does not aggravate the regional tourism development gap. 4) From a dynamic standpoint, the growth effect of the HSR on the tourism economy in ethnic regions still lags. As time passes since the opening of HSR, its economic effect gradually weakens. Even if the opening time of HSR is extended, the distribution effect of HSR on the tourism economy in ethnic areas is still not observed. In general, this study examines the tourism economy of HSR. It considers its growth and distribution effects. This provides a basis for accurately evaluating the economic effects of HSR and guiding the inclusive development of regional tourism.
表1 变量定义与描述性统计Table 1 Variable definition and descriptive statistics |
| 变量名称 | 测量与简称 | 全样本 | 高铁开通样本 | 高铁未开通样本 | |||||
|---|---|---|---|---|---|---|---|---|---|
| 均值 | 标准差 | 均值 | 标准差 | 均值 | 标准差 | ||||
| 国内旅游总人次 | 取对数(万人次),ln travel_dp | 6.64 | 1.71 | 7.27 | 1.50 | 6.37 | 1.73 | ||
| 国内旅游总收入 | 取对数(亿元),ln travel_di | 3.33 | 2.21 | 4.15 | 1.70 | 2.98 | 2.31 | ||
| 高铁开通 | 虚拟变量,HRS | 0.31 | 0.46 | 1.00 | 0.00 | 0.00 | 0.00 | ||
| 旅游资源禀赋 | 资源丰裕度,travel_r | 64.75 | 91.62 | 52.74 | 78.09 | 70.04 | 96.66 | ||
| 经济发展水平 | 人均GDP取对数(万元/人),lnper_GDP | -0.12 | 0.68 | 0.31 | 0.41 | -0.32 | 0.69 | ||
| 人均第三产业产值取对数(万元/人),ln per_opt | -1.15 | 0.74 | -0.68 | 0.45 | -1.35 | 0.75 | |||
| 城镇化水平 | 年末城镇人口占比,urban | 0.35 | 0.18 | 0.38 | 0.19 | 0.34 | 0.18 | ||
| 产业结构 | 综合指数×100,indstr | 213.75 | 14.89 | 217.22 | 13.14 | 212.22 | 15.37 | ||
| 财政支出水平 | 财政收支比,ratio | 0.40 | 0.30 | 0.34 | 0.34 | 0.43 | 0.28 | ||
| 财政支出占GDP比,ratio_GDP | 0.33 | 0.22 | 0.33 | 0.18 | 0.32 | 0.24 | |||
| 人口规模 | 人口密度(人/km2),density | 88.55 | 176.95 | 60.64 | 178.10 | 100.83 | 175.40 | ||
| 道路里程 | 总里程(万km),road | 4.39 | 5.14 | 3.16 | 4.39 | 4.93 | 5.35 | ||
表2 高铁开通对地区旅游业发展的影响Table 2 The impact of the opening of high-speed rail on the development of regional tourism |
| 变量 | ln travel_dp | ln travel_di | |||
|---|---|---|---|---|---|
| (1) 增长效应 | (2) 分配效应 | (3) 增长效应 | (4) 分配效应 | ||
| HSR | 0.165 2** (0.081 1) | 0.078 7 (0.182 1) | 0.232 9** (0.101 3) | 0.121 4 (0.130 8) | |
| ln travel_dpt -1 | — | 0.635*** (0.037 8) | — | — | |
| ln travel_dit -1 | — | — | — | 0.500 2*** (0.038 8) | |
| HSR* ln travel_dpt -1 | — | 0.008 2 (0.024 4) | — | — | |
| HSR* ln travel_dit -1 | — | — | — | 0.007 4 (0.027 3) | |
| travel_r | -0.001 9** (0.000 9) | -4.58e-06 (0.000 6) | -0.002 6** (0.001 1) | -0.000 4 (0.000 8) | |
| ln per_GDP | 0.039 3 (0.333 2) | 0.096 1 (0.204 2) | 0.053 7 (0.415 9) | 0.347 5 (0.273 7) | |
| ln per_opt | -0.026 2 (0.396 2) | 0.242 (0.237 9) | 0.535 7 (0.494 6) | 0.348 (0.320 2) | |
| urban | 0.029 9*** (0.008 6) | -0.042 8 (0.131 3) | -0.040 9 (0.306 5) | -0.023 4 (0.175 8) | |
| indstr | 0.249 1** (0.116 5) | 0.006 7 (0.005 9) | 0.029 5*** (0.010 7) | 0.015 8** (0.008) | |
| ratio | 0.929 5*** (0.317 8) | -0.027 7 (0.070 1) | -0.116 8 (0.145 4) | -0.226 2** (0.095 2) | |
| ratio_GDP | -0.000 5*** (0.000 2) | 0.646 4*** (0.198 8) | 0.534 6 (0.396 7) | 0.515 9** (0.260 5) | |
| density | 0.033 6* (0.019 9) | -0.000 2** (0.000 1) | -0.000 1 (0.000 2) | 0.000 1 (0.000 1) | |
| road | -1.389 1 (2.204 8) | 0.012 (0.014 4) | 0.005 0 (0.024 8) | 0.002 9 (0.019 3) | |
| 常数项 | -1.389 1 (2.204 8) | 1.140 4 (1.461 6) | -3.888 6 (2.752 4) | -1.234 (1.975 5) | |
| Hausman检验 | — | 70.28*** | — | 88.45*** | |
| 时间固定效应 | 是 | 是 | 是 | 是 | |
| 个体固定效应 | 是 | 是 | 是 | 是 | |
| 观测值 | 360 | 360 | 360 | 360 | |
| R 2 | 0.340 1 | 0.906 3 | 0.365 0 | 0.855 7 | |
|
表3 安慰剂检验、替换估计方法与高铁开通变量的估计结果Table 3 The estimation result about replacing estimation method and high-speed rail opening variable |
| 变量 | 安慰剂检验 | ln travel_dp | ln travel_di | |||||||
|---|---|---|---|---|---|---|---|---|---|---|
| (1) lntravel_dp | (2) lntravel_di | (3) Semi-DID | (4) 替换HRS | (5) 替换HRS | (6) Semi-DID | (7) 替换HRS | (8) 替换HRS | |||
| HSR | -0.060 2 (0.078 2) | 0.131 (0.097 5) | 1.753*** (0.378 7) | 0.072* (0.079 8) | 0.187 7 (0.185 8) | 1.329 6*** (0.247 9) | 0.209 7** (0.099 3) | 0.161 3 (0.126 7) | ||
| ln travel_dpt- 1 | — | — | — | — | 0.647 8*** (0.038 3) | — | — | — | ||
| ln travel_dit -1 | — | — | — | — | — | — | — | 0.501 2*** (0.038 8) | ||
| HSR*ln travel_dpt -1 | — | — | — | — | -0.007 1 (0.025 6) | — | — | — | ||
| HSR*ln travel_dit -1 | — | — | — | — | — | — | — | 0.001 2 (0.027 9) | ||
| 控制变量 | 是 | 是 | 是 | 是 | 是 | 是 | 是 | 是 | ||
| 常数项 | -1.779 1 (1.363 9) | -6.447 3 (1.701 1) | — | -1.952 9 (2.302 7) | 1.126 2 (1.511 2) | -3.919 8 (2.866 4) | -1.255 1 (2.036 8) | |||
| 时间固定效应 | 是 | 是 | 是 | 是 | 是 | 是 | 是 | 是 | ||
| 个体固定效应 | 是 | 是 | 是 | 是 | 是 | 是 | 是 | 是 | ||
| Hausman检验 | — | — | — | — | 69.37*** | — | — | 89.84*** | ||
| R 2 | 0.318 7 | 0.332 2 | — | 0.33 | 0.912 8 | — | 0.352 6 | 0.855 5 | ||
表4 替换控制变量的估计结果Table 4 The estimation result about replacing control variables |
| 变量 | ln travel_dp | ln travel_di | ||||||
|---|---|---|---|---|---|---|---|---|
| (1) 替换travel_r | (2) 替换indstr | (3) 替换travel_r | (4) 替换indstr | (5) 替换travel_r | (6) 替换indstr | (7) 替换travel_r | (8) 替换indstr | |
| HSR | 0.162 1* (0.082 9) | 0.161 9* (0.083 8) | 0.103 7 (0.196 8) | 0.142 3 (0.194 5) | 0.237 2** (0.103 6) | 0.232 7** (0.103 9) | 0.133 7 (0.135 9) | 0.163 6 (0.135 6) |
| ln travel_dpt -1 | — | — | 0.636 3*** (0.038) | 0.645 4*** (0.037 4) | — | — | — | — |
| ln travel_di t-1 | — | — | — | — | — | — | 0.503 4*** (0.039 1) | 0.515 5*** (0.038 5) |
| HSR*ln travel_dpt -1 | — | — | 0.004 2 (0.027 1) | -0.001 6 (0.026 8) | — | — | — | — |
| HSR*ln travel_dit -1 | — | — | — | — | — | — | 0.003 7 (0.030 1) | -0.006 2 (0.029 9) |
| 控制变量 | 是 | 是 | 是 | 是 | 是 | 是 | 是 | 是 |
| 常数项 | -2.72 (2.274 1) | 6.036 8*** (1.769) | 1.027 5 (1.5085) | 2.629 7** (1.209 1) | -5.383 6* (2.841 4) | 4.027 1* (2.194 8) | -1.571 2 (2.032 8) | 1.953 7 (1.604 9) |
| 时间固定效应 | 是 | 是 | — | — | 是 | 是 | — | — |
| 个体固定效应 | 是 | 是 | — | — | 是 | 是 | — | — |
| Hausman检验 | — | — | 69.89*** | 67.48*** | — | — | 86.55*** | 86.46*** |
| R 2 | 0.335 | 0.302 8 | 0.906 9 | 0.912 7 | 0.385 5 | 0.327 6 | 0.857 2 | 0.861 1 |
表5 高铁开通对旅游业发展的两阶段最小二乘法回归的估计结果Table 5 The Two-stage least squares regression estimation result of the opening of high-speed rail on tourism development |
| 变量 | 增长效应 | 分配效应 | ||||||
|---|---|---|---|---|---|---|---|---|
| IV第一阶段 | IV第二阶段 | IV第一阶段 | IV第二阶段 | IV第一阶段 | IV第二阶段 | |||
| HSR | ln travel_dp | ln travel_di | HSR | ln travel_dp | HSR | lntravel_di | ||
| HSR | 0.332 4* (0.356 9) | 0.623 5* (0.353) | — | 0.295 6 (0.343 4) | — | 0.185 3 (0.025 86) | ||
| ln travel_dpt -1 | — | — | — | — | 0.637 5*** (0.072 6) | — | — | |
| ln travel_dit -1 | — | — | — | — | — | — | 0.507 4*** (0.064 7) | |
| HSR* ln travel_dpt -1 | — | — | — | — | -0.018 4 (0.045 2) | — | — | |
| HSR* ln travel_dit -1 | — | — | — | — | — | — | -0.0059 (0.049 5) | |
| ln freight*2000年虚拟变量 | -0.071 7 (0.048 9) | — | — | 0.089** (0.016 4) | — | 0.155* (0.032 1) | — | |
| ln freight*2001年虚拟变量 | -0.065 (0.048 2) | — | — | 0.088 (0.016 8) | — | 0.151 4 (0.033 9) | — | |
| ln freight*2002年虚拟变量 | 0.071 1 (0.049 6) | — | — | 0.080 8 (0.017 2) | — | 0.139 4* (0.034 8) | — | |
| ln freight*2003年虚拟变量 | 0.088 3 (0.050 1) | — | — | 0.075** (0.016 6) | — | 0.118 8 (0.034 6) | — | |
| ln freight*2004年虚拟变量 | -0.092 9 (0.050 5) | — | — | 0.085 2 (0.016 8) | — | 0.139 1 (0.034 6) | — | |
| ln freight*2005年虚拟变量 | 0.086 8 (0.048 4) | — | — | 0.082 7** (0.016 7) | — | 0.144 9* (0.035 1) | — | |
| lnfreight*2006年虚拟变量 | 0.041 9* (0.047 7) | — | — | 0.083 8 (0.015 7) | — | 0.145 2 (0.032 1) | — | |
| lnfreight*2007年虚拟变量 | -0.041 8 (0.048 1) | — | — | 0.085 7 (0.015 8) | — | 0.146 5 (0.031 8) | — | |
| lnfreight*2008年虚拟变量 | 0.036 5 (0.049 3) | — | — | 0.082 9* (0.016 2) | — | 0.138 8* (0.032 8) | — | |
| lnfreight*2009年虚拟变量 | -0.044 4 (0.049 7) | — | — | 0.047 9 (0.015 6) | — | 0.081 8 (0.031 9) | — | |
| lnfreight*2010年虚拟变量 | 0.115 (0.055 9) | — | — | 0.054 5*** (0.020 6) | — | 0.096 4*** (0.04) | — | |
| lnfreight*2011年虚拟变量 | 0.081 5 (0.057 8) | — | — | 0.055 2 (0.02) | — | 0.097 6 (0.038 8) | — | |
| lnfreight*2012年虚拟变量 | 0.074 9** (0.056 2) | — | — | 0.048 3** (0.018 7) | — | 0.074 9** (0.037 6) | — | |
| lnfreight*2013年虚拟变量 | 0.107 3* (0.049 2) | — | — | 0.034 2 (0.017 4) | — | 0.060 7 (0.032 9) | — | |
| lnfreight*2014年虚拟变量 | 0.055 6** (0.060 6) | — | — | 0.019 2* (0.019 7) | — | 0.031 9* (0.033 7) | — | |
| lnfreight*2015年虚拟变量 | 0.018 4** (0.061 4) | — | — | 0.008 5 (0.017 2) | — | 0.011 7 (0.032 1) | — | |
| lnfreight*2016年虚拟变量 | 0.034 2** (0.061 5) | — | — | 0.089 9* (0.019 3) | — | 0.155 5* (0.036 8) | — | |
| 控制变量 | 是 | 是 | 是 | 是 | 是 | 是 | 是 | |
| 第一阶段F值 | 18.91 | — | — | 315.04 | — | 98.33 | — | |
| 时间固定效应 | 是 | 是 | 是 | 是 | 是 | 是 | 是 | |
| 个体固定效应 | 是 | 是 | 是 | 是 | 是 | 是 | 是 | |
| R 2 | 0.708 9 | 0.954 4 | 0.955 9 | 0.980 7 | 0.978 9 | 0.921 6 | 0.975 9 | |
表6 高铁开通对民族地区旅游业影响机制的估计结果Table 6 Estimation result of the mechanism of the opening of high-speed rail on tourism in ethnic regions |
| 变量 | 扩散效应 | 结构效应 | 虹吸效应 | 过道效应 | ||
|---|---|---|---|---|---|---|
| ln GDP | ln sture2 | ln sture3 | ln person | ln turnover1 | ln turnover2 | |
| HSR | 0.011 4* (0.008 3) | 0.009 9** (0.017) | 0.003 (0.002 9) | -0.007 6 (0.166 5) | 0.120 7 (0.130 8) | 0.071 (0.123 4) |
| 控制变量 | 是 | 是 | 是 | 是 | 是 | 是 |
| 常数项 | 5.655*** (0.002) | 2.9418*** (0.379 9) | 4.573 4*** (0.077 9) | 9.451 3*** (0.325 7) | 5.198 6 (3.560 4) | 4.015 5 (3.358 4) |
| 时间固定效应 | 是 | 是 | 是 | 是 | 是 | 是 |
| 个体固定效应 | 是 | 是 | 是 | 是 | 是 | 是 |
| R 2 | 0.617 9 | 0.724 5 | 0.990 2 | 0.983 5 | 0.475 5 | 0.338 6 |
表7 高铁开通对旅游业增长效应的动态影响Table 7 The dynamic impact of the opening of high-speed rail on the growth effect of tourism |
| 变量 | lntravel_dp | lntravel_di | |||||||
|---|---|---|---|---|---|---|---|---|---|
| (1) | (2) | (3) | (4) | (5) | (6) | (7) | (8) | ||
| HSR it -1 | 0.248*** (0.084 6) | — | — | — | 0.216 6** (0.106 6) | — | — | — | |
| HSR it -2 | — | 0.186 2** (0.089 3) | — | — | — | 0.169 9 (0.112) | — | — | |
| HSR it -3 | — | — | 0.120 5 (0.095 7) | — | — | — | 0.145 6 (0.119 8) | — | |
| HSR-line | — | — | — | 0.005 3** (0.002 3) | — | — | — | 0.007 4** (0.003) | |
| 控制变量 | 是 | 是 | 是 | 是 | 是 | 是 | 是 | 是 | |
| 常数项 | -1.798 4 (2.190 2) | -1.832 2 (2.207 5) | -1.7259 (2.217 7) | -0.600 1 (2.016 3) | -4.325 3 (2.758 2) | -4.366 4 (2.769 6) | -4.325 4 (2.773 9) | -4.799* (2.534) | |
| 时间固定效应 | 是 | 是 | 是 | 是 | 是 | 是 | 是 | 是 | |
| 个体固定效应 | 是 | 是 | 是 | 是 | 是 | 是 | 是 | 是 | |
| R 2 | 0.358 | 0.354 7 | 0.346 | 0.871 4 | 0.373 2 | 0.371 5 | 0.369 5 | 0.881 5 | |
表8 高铁开通对旅游业分配效应的动态影响Table 8 The dynamic impact of the opening of high-speed rail on the distribution effect of tourism |
| 变量 | lntravel_dp | lntravel_di | |||||
|---|---|---|---|---|---|---|---|
| (1) | (2) | (3) | (4) | (5) | (6) | ||
| HSR it -1 | 0.135 (0.183 5) | — | — | 0.136 6 (0.141 1) | — | — | |
| HSR it -2 | — | -0.117 3 (0.221 1) | — | — | 0.048 5 (0.157 4) | — | |
| HSR it -3 | — | — | -0.186 (0.260 9) | — | — | -0.094 7 (0.185) | |
| lntravel_dpt -1 | 0.929 8*** (0.017 8) | 0.638*** (0.038) | 0.644 3*** (0.038) | — | — | — | |
| lntravel_dit -1 | — | — | — | 0.500 8*** (0.039) | 0.504 7*** (0.039 3) | 0.5028*** (0.039 6) | |
| HSR it -1*lntravel_dpt -1 | -0.002 (0.025 3) | — | — | — | — | — | |
| HSR it -2*lntravel_dpt -1 | — | 0.023 (0.029 3) | — | — | — | — | |
| HSR it -3*lntravel_dpt -1 | — | — | 0.026 (0.035 1) | — | — | — | |
| HSR it -1*lntravel_dit -1 | — | — | — | 0.005 2 (0.000 8) | — | — | |
| HSR it -2*lntravel_dit -1 | — | — | — | — | 0.013 9 (0.033 1) | — | |
| HSR it -3*lntravel_dit -1 | — | — | — | — | — | -0.000 5 (0.000 8) | |
| 控制变量 | 是 | 是 | 是 | 是 | 是 | 是 | |
| 常数项 | 0.465 6 (0.701 8) | 1.124 8 (1.488 6) | 1.351 7 (1.495 3) | -1.544 (1.979 5) | -1.485 (2.000 2) | -1.323 8 (2.008) | |
| Hausman检验 | 71.83*** | 69.89*** | 69.61*** | 88.78*** | 88.34*** | 88.31*** | |
| R 2 | 0.968 9 | 0.900 8 | 0.900 4 | 0.858 2 | 0.857 0 | 0.852 9 | |

1 中国目前共有5个自治区、30个自治州和120个自治县(旗),分布在河北省、内蒙古、辽宁省、吉林省、黑龙江省、浙江省、湖北省、湖南省、广东省、广西、海南省、重庆市、四川省、贵州省、云南省、西藏、甘肃省、青海省、宁夏、新疆共20个省市地区,其中云南省的民族自治县最多,共有29个,黑龙江省和浙江省最少,仅有1个自治县。
2 1995年重庆市仍棣属于四川省,对此,以历年重庆市客运总量占四川省客运总量的平均值来推算。
|
Abadie A. 2005. Semiparametric Difference-in-Differences Estimators. The Review of Economic Studies, 72(1): 1-19.
|
|
Albalate D and Fageda X. 2016. High Speed Rail and Tourism: Empirical Evidence from Spain. Transportation Research Part A: Policy and Practice, 85(3): 174-185.
|
|
Chen Z and Haynes K E. 2015. Impact of High-Speed Rail on International Tourism Demand in China. Applied Economics Letters, 22(1): 57-60.
|
|
Delaplace M. 2012. TGV, Développement Local et Taille Des Villes: Une Analyse en Termes D'innovation de Services. Revue D'économie Régionale Et Urbaine, (2): 265-290.
|
|
冯烽,崔琳昊. 2020. 高铁开通与站点城市旅游业发展:“引擎”还是“过道”?. 经济管理,42(2):175-191. [Feng Feng and Cui Linhao. 2020. High-Speed Rail Operation and Tourism in the HSR Site City: “Engine” or “Corridor”?. Business Management Journal, 42(2): 175-191. ]
|
|
Fröidh O. 2005. Market Effects of Regional High-Speed Trains on the Svealand Line. Journal of Transport Geography, 13(4): 352-361.
|
|
国家民族事务委员会经济发展司,国家统计局国民经济综合统计司. 2001—2018. 中国民族统计年鉴. 北京:中国统计出版社. [Economic Development Department of China National Ethnic Affairs Commission and National Economic Comprehensive Statistics Department, National Bureau of Statistics. 2001-2018. China National Statistical Yearbook. Beijing: China Statistics Press. ]
|
|
国家统计局城市社会经济调查司. 2018. 中国价格统计年鉴. 北京:中国统计出版社. [Urban Socio-Economic Investigation Department, National Bureau of Statistics. 2018. China Price Statistics Yearbook. Beijing: China Statistics Press. ]
|
|
Hou Q and Li S M. 2011.Transport Infrastructure Development and Changing Spatial Accessibility in the Greater Pearl River Delta, China, 1990–2020. Journal of Transport Geography, 19(6): 1350-1360.
|
|
Houngbedji K. 2016.Abadie's Semiparametric Difference-in-Differences Estimator. The Stata Journal, 16(2): 482-490.
|
|
穆成林,陆林,黄剑锋,汪莹. 邓洪波. 2015. 高铁网络下的长三角旅游交通格局及联系研究. 经济地理,35(12):193-202. [Mu Chenglin, Lu Lin, Huang Jianfeng, Wang Ying and Deng Hongbo. 2015.Research on Yangtze River Delta Tourist Traffic Pattern and Linkage under the High-Speed Rail Network. Economic Geography, 35(12): 193-202. ]
|
|
梅琳,黄柏石,敖荣军,高喆. 2018. 长江中游城市群高速铁路可达性格局及演变. 经济地理,38(6):62-68. [Mei Lin, Huang Boshi, Ao Rongjun and Gao Zhe. 2018. The Spatial Pattern and Evolution of High-Speed Railways Accessibility of the Urban Agglomeration in the Middle Reaches of the Yangtze River. Economic Geography, 38(6): 62-68. ]
|
|
蒋海兵,张文忠,祁毅,蒋金亮. 2015. 高速铁路与出行成本影响下的全国陆路可达性分析. 地理研究,34(6):1015-1028. [Jiang Haibing, Zhang Wenzhong, Qi Yi and Jiang Jinliang. 2015. The Land Accessibility Influenced by China's High-Speed Rail Network and Travel Cost. Acta Geographica Sinica, 34(6): 1015-1028. ]
|
|
Lumsdon L and Page S J. 2004. Tourism and Transport: Issues and Agenda for the New Millennium. Tourism Management, 27(2): 357-359.
|
|
李光勤,胡志高,曹建华. 2018. 制度变迁与旅游经济增长——基于双重差分方法的“局改委”政策评估. 旅游学刊,(1):13-24. [Li Guangqin, Hu Zhigao and Cao Jianhua. 2018. Institutional Change and Tourism Economic Growth: Policy Evaluation of Replacing the TB with the TDC based on the Double Difference Method. Tourism Tribune, (1): 13-24. ]
|
|
来逢波,程钰,耿聪. 2020. 交通运输与旅游业融合发展:问题机理与路径. 山东社会科学,(4):144-149. [Lai Pengbo, Cheng Yu and Geng Chong. 2020. The Integrated Development of Transportation and Tourism: Problem Mechanism and Path. Shandong Social Sciences, (4): 144-149. ]
|
|
刘宇青,徐虹,刘海玲. 2014. 高铁开通对消费者旅游线路节点选择的影响研究. 消费经济,(6):60-64. [Liu YuQing, Xu Hong and Liu Hailing. 2014. Research on the Impact of the Opening of High-speed Rail on Consumers' Choice of Tourist Route Nodes. Consumer Economics, (6): 60-64. ]
|
|
刘勇政,李岩. 2017. 中国的高速铁路建设与城市经济增长. 金融研究,(11):18-33. [Liu Yongzheng and Li Yan. 2017. High-Speed Rails and City Economic Growth in China. Journal of Financial Research, (11): 18-33. ]
|
|
孙娜,张梅青,陶克涛. 2019. 交通基础设施对民族地区经济增长的影响——兼论民族地区高铁建设. 中央民族大学学报(哲学社会科学版),46(1):98-107. [Sun Na, Zhang Meiqing and Tao Ketao. 2019. Research on the Influence of Transportation Infrastructure on Economic Growth and the Construction of High-Speed Railway in Ethnic Regions. Journal of Minzu University of China (Philosophy and Social Sciences Edition), 46(1): 98-107. ]
|
|
Thrane C. 2015. Research Note: the Determinants of Tourists' Length of Stay: Some Further Modelling Issues. Tourism Economics, 21(5): 1087-1093.
|
|
汪德根. 2016. 高铁网络化时代旅游地理学研究新命题审视. 地理研究,35(3):5-20. [Wang Degen. 2016. Thinking on the New Topics of Tourism Geography Research in High-Speed Rail Network Era. Geographical Research, 35(3): 5-20. ]
|
|
汪德根,牛玉,陈田,陆林,唐承财. 2015. 高铁驱动下大尺度区域都市圈旅游空间结构优化——以京沪高铁为例. 资源科学,37(3):581-592. [Wang Degen, Niu Yu, Chen Tian, Lu Lin and Tang Chengcai. 2015. Optimizing Tourist Spatial Structure for Large Scale Regional Metropolitan Circles under the Beijing-Shanghai High-Speed Rail. Resources Science, 37(3): 581-592. ]
|
|
鄢慧丽,王强,熊浩,余瑞林. 2020. 中国“四纵四横”高铁对沿线站点城市可达性及其经济联系的影响. 经济地理,40(1):59-69. [Yan Huili, Wang Qiang, Xiong Hao and Yu Ruilin. 2020.The Effect of Chinese "Four Vertical and Four Horizontal" High-Speed Railways on the Accessibility and Economic Relations of the Cities along the Line. Economic Geography, 40(1): 59-69. ]
|
|
吴康,方创琳,赵渺希,陈晨. 2013. 京津城际高速铁路影响下的跨城流动空间特征. 地理学报,68(2):159-174. [Wu Kang, Fang Chuanglin, Zhao Miaoxi and Chen Cheng. 2013. The Intercity Space of Flow Influenced by High-Speed Rail: A Case Study for the Rail Transit Passenger Behavior Between Beijing and Tianjin. Acta Geographica Sinica, 68(2): 159-174. ]
|
|
王绍博,罗小龙,郭建科,张培刚,顾宗倪. 2019. 高铁网络化下东北地区旅游空间结构动态演变分析. 地理科学,39(4):568-577. [Wang Shaobo, Luo Xiaolong, Guo Jiangke, Zhang Peigang and Gu Zhongni. 2019. Dynamic Evolution of Tourism Spatial Structure Under the Improvement of the High Speed Rail Network in Northeast China. Scientia Geographica Sinica, 39(4): 568-577. ]
|
|
汪伟,刘玉飞,彭冬冬. 2015. 人口老龄化的产业结构升级效应研究. 中国工业经济,(11):47-61. [Wang Wei, Liu Yufei and Peng Dongdong. 2015. Research on Effect of Population Aging onIndustrial Upgrading. China Industrial Economics, (11): 47-61. ]
|
|
殷平. 2012. 高速铁路与区域旅游新格局构建——以郑西高铁为例. 旅游学刊,(12):48-54. [Yin Ping. 2012. High-Speed Railway (HSR) and Establishment of New Pattern of Regional Tourism: A Case Study of the High-Speed Railway between Zhengzhou and Xi’an. Tourism Tribune, (12): 48-54. ]
|
|
Yu Q. 2017. No County Left Behind? The Distributional Impact of High-Speed Rail Upgrades in China. Journal of Economic Geography, 17(3): 489-520.
|
|
余泳泽,伏雨,庄海涛. 2020. 高铁开通对区域旅游业发展的影响. 财经问题研究,(1):31-38. [Yu Yongzhe, Fu Yu and Zhuang Haitao. 2020. The Impact of the Opening of High-Speed Rail on the Development of Regional Tourism. Research on Financial and Economic Issues, (1): 31-38. ]
|
|
张克中,陶东杰. 2016. 交通基础设施的经济分布效应——来自高铁开通的证据. 经济学动态,(6):62-75. [Zhang Kezhong and Tao Dongjie. 2016. The Economic Distribution Effect of Transportation Infrastructure—Evidence from the Opening of High-Speed Rail. Economic Perspectives, (6): 62-75. ]
|
|
张勋,万广华. 2016. 中国的农村基础设施促进了包容性增长吗?. 经济研究,51(10):82-96. [Zhang Xun and Wang Guanghua. 2016. Rural Infrastructure and Inclusive Growth in China. Economic Research Journal, 51(10): 82-96. ]
|
/
| 〈 |
|
〉 |