
广州地铁站点交通流特征与居民地铁出行的人群分异
|
叶昌东(1983—),男,广东南雄人,教授,博士,研究方向为城市空间结构、城市公共空间、城市更新、乡村振兴等,(E-mail)yechangdong@scau.edu.cn; |
收稿日期: 2020-09-19
修回日期: 2020-11-28
网络出版日期: 2021-09-23
基金资助
国家自然科学基金(41871156)
广东省自然科学基金项目(2017A030310668)
大学生创新训练项目“空间正义观导向下的农民工市民化路径研究——以广州为例”(S202010564093)
Traffic Flow of Metro Stations and Population Travel Differentiation in Guangzhou
Received date: 2020-09-19
Revised date: 2020-11-28
Online published: 2021-09-23
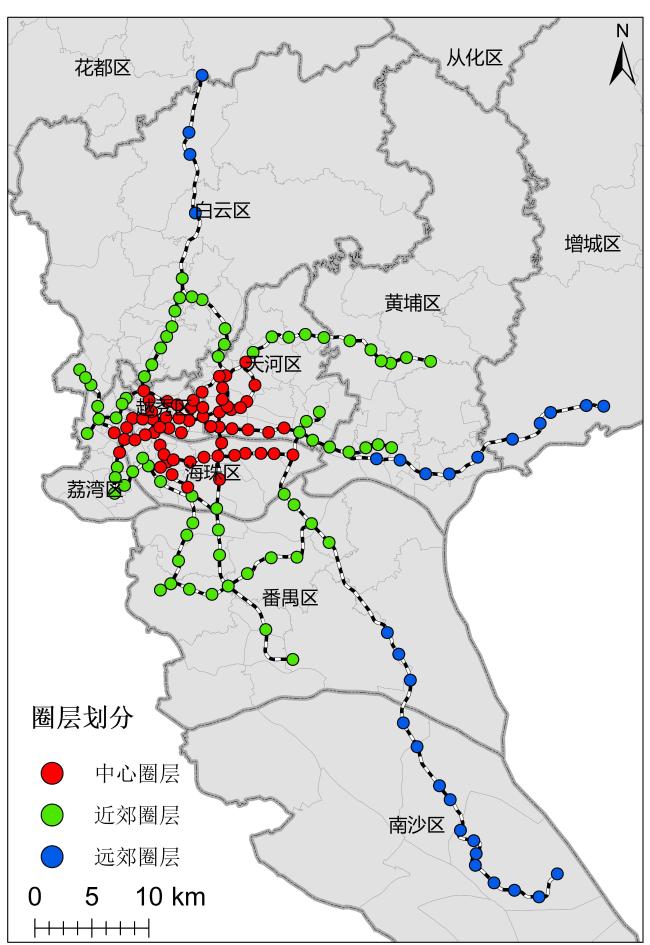
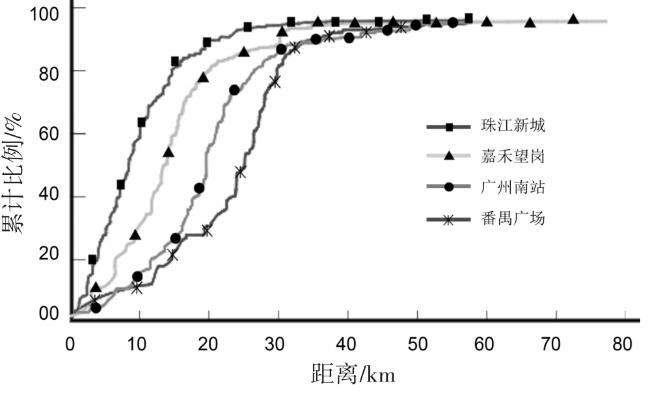
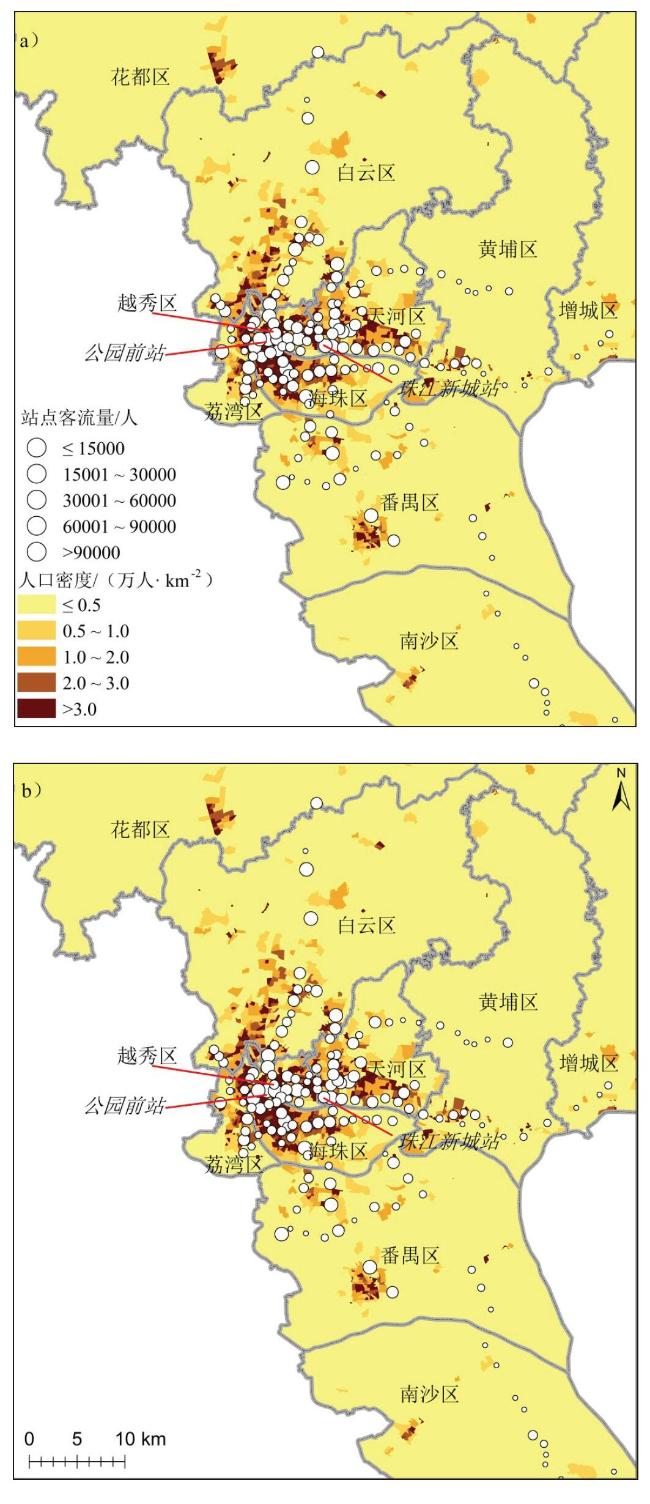
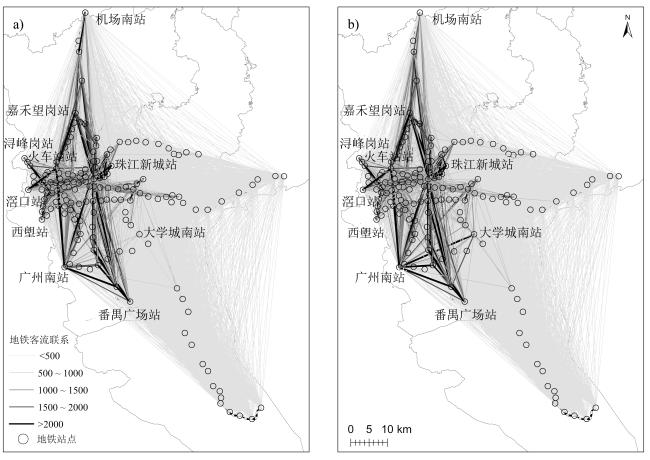
基于广州地铁交通流的始发地(Origin)—目的地(Destination)(OD分析),运用出行成本(距离/时间)、集中出行距离区间等指标对地铁站点交通流特征及居民地铁出行的人群分异进行刻画。结果表明:1)地铁站点随出行距离增加的乘客累积比例呈“S”型曲线变化,广州地铁站点的平均出行成本约为14.04 km(20.48 min),并由中心向外逐层增加约4 km(5 min)和13 km(10 min),周末平均出行成本略高于工作日。2)广州地铁出行的集中距离区间为8.55~26.61 km,在该出行距离范围内的乘客量占总数的71.88%;周末出行集中距离区间宽度变窄,但乘客量的集中比例却有所下降。3)社会弱势群体如女性、老年人、固定上下班的大学以上学历人群、办事人员、商服人员等是地铁潜在客流的主要构成群体;不同人群的地铁平均出行距离出现分化,其中出行需求小、出行能力偏弱的群体平均出行距离较短,出行需求大的群体平均出行距离普遍较长;除个别人群外站点集中出行距离区间相对差异不大。
叶昌东 , 冯碧盈 , 姚华松 , 代丹丹 . 广州地铁站点交通流特征与居民地铁出行的人群分异[J]. 热带地理, 2021 , 41(5) : 918 -927 . DOI: 10.13284/j.cnki.rddl.003386
Metro railway is emerging as the optimal choice for residents' daily travel in many metropolitan areas in China, which profoundly affects the spatial-temporal characteristics of the travel mode of residents. Studying the spatio-temporal characteristics of metro traffic flow is of great practical significance for optimizing metro traffic layout and relieving urban traffic pressure. Reported studies have afforded significant achievements in the spatial-temporal characteristics of metro traffic flow; however, there are very few studies on the overall perspective of the station network, and most of them fail to further analyze population differences in using metro systems. In view of these gaps in the existing research, this study has two main objectives: 1) to describe the characteristics of metro traffic from the overall perspective of metro station network, with parameters of traffic flows within the station network, average travel distance (time), and their aggregation features; and 2) to analyze the differentiation of population groups near metro stations for understanding population differences in metro traffic flow. The Origin-Destination (OD) analysis method was used to calculate traffic flow characteristics between different metro stations, including the average travel cost (distance/time) and travel aggregation distance interval. Our results lead to the following inferences. 1) The cumulative proportion of passengers in metro stations along with travel distance show an "S" curve function feature, the average travel cost of metro stations in Guangzhou is approximately 14.04 km (20.48 min), and increase by ~4 km (~5 min) and ~13 km (~10 min) from the central area to the inner and outer suburbs. The average weekend travel costs are slightly higher than that of weekdays: the average travel cost on weekend ranged from 0.03 km (0.06 min) less in the central area to 0.32 km (0.49 min) and 0.64 km (0.77 min) more in the inner and outer suburbs, respectively. Three types of metro stations—those serving external transportation, business offices, and public units—have higher average travel costs. 2) The distance interval of passenger flow concentration in metro stations tends smoothly from the center to the periphery. The travel aggregation distance interval in the entire city is 8.55-26.61 km, with 71.88% passengers aggregated within this travel distance range. The travel aggregation distance interval in the central area and the inner and outer suburbs are 2.74-19.23, 7.49-25.23, and 24.3-46.73 km, respectively, with 78.87%, 71.81%, and 56.55% passengers, respectively. The spatial distributions on weekend and weekdays are almost the same, only with a narrow range of travel aggregation distance interval and smaller proportion of passengers on weekends than weekdays. The station types of external transportation, leisure tourism, and residential areas have higher travel aggregation distance interval and passenger proportion. 3) Population groups like women, elderly, people with college-level education or above, office staff, business people, and service personnel are the main components of metro passengers. The average metro travel distance of different population groups is differentiated, as groups with small travel demand and weak travel ability have short average travel distance, while groups with large travel demand generally have a long average travel distance. Our research contributes to the existing literature mainly in two aspects. 1) Average travel cost, knee point analysis, and travel aggregation distance interval were used to depict the spatial-temporal characteristics of metro traffic flow from the overall perspective of metro station network; this is a supplement and expansion of existing literature mainly based on stations or lines. 2) The differentiation of different population groups helped further optimize the planning, design, and line arrangement of metro systems.
表1 广州市地铁交通客流基本特征Table 1 Statistic features of metro passenger flow in Guangzhou |
| 数据 | 总量/万人 | 平均/人 | 最大值/人 | 最小值/人 | |
|---|---|---|---|---|---|
| 工作日 | 进站客流 | 394.16 | 24 635 | 72 141 | 670 |
| 出站客流 | 393.84 | 24 615 | 74 834 | 637 | |
| 站间客流 | 441.55 | 172 | 6 026 | 0 | |
| 周末 | 进站客流 | 375.66 | 23 479 | 73 890 | 620 |
| 出站客流 | 374.49 | 23 405 | 69 481 | 444 | |
| 站间客流 | 423.39 | 165 | 6 141 | 0 | |
表2 广州市不同类型地铁站点数量与用地占比分布Table 2 Number and land use proportion of metro stations of different types in different location in Guangzhou |
| 类型 | 中心圈层 | 近郊圈层 | 远郊圈层 | 合计 | |||||
|---|---|---|---|---|---|---|---|---|---|
| 站点 数量/个 | 站点周边相应 用地占比/% | 站点 数量/个 | 站点周边相应 用地占比/% | 站点 数量/个 | 站点周边相应 用地占比/% | ||||
| 居住 | 16 | 52.4 | 50 | 57.6 | 16 | 58.2 | 82 | ||
| 商务办公 | 11 | 70.4 | 3 | 52.4 | 0 | 0.0 | 14 | ||
| 商业购物 | 13 | 52.6 | 2 | 63.2 | 2 | 65.4 | 17 | ||
| 休闲旅游 | 13 | 53.4 | 7 | 55.4 | 2 | 62.6 | 22 | ||
| 公共单位 | 4 | 60.5 | 6 | 64.3 | 1 | 68.4 | 11 | ||
| 对外交通 | 3 | 51.4 | 2 | 60.5 | 3 | 64.3 | 8 | ||
| 产业 | 0 | 0.0 | 3 | 78.4 | 3 | 82.4 | 6 | ||
表3 广州市地铁工作日和周末平均出行成本Table 3 Average metro travel cost in weekday and weekend in Guangzhou |
| 圈层/类型 | 工作日 | 周末 | ||||
|---|---|---|---|---|---|---|
| 距离/km | 时间/min | 距离/km | 时间/min | |||
| 全市 | 14.04 | 20.48 | 14.28 | 20.81 | ||
| 中 心 圈 层 | 对外交通 | 10.50 | 18.00 | 10.59 | 18.15 | |
| 商务办公 | 10.22 | 17.52 | 10.20 | 17.49 | ||
| 公共单位 | 9.48 | 16.24 | 9.56 | 16.38 | ||
| 居住 | 8.99 | 15.40 | 8.89 | 15.25 | ||
| 休闲旅游 | 8.91 | 15.27 | 8.96 | 15.35 | ||
| 商业购物 | 8.85 | 15.16 | 8.71 | 14.93 | ||
| 平均 | 9.28 | 15.91 | 9.25 | 15.85 | ||
| 近 郊 圈 层 | 商务办公 | 17.10 | 25.66 | 17.55 | 26.33 | |
| 公共单位 | 16.22 | 24.34 | 16.81 | 25.21 | ||
| 产业 | 15.01 | 22.51 | 15.14 | 22.71 | ||
| 对外交通 | 14.73 | 22.10 | 14.82 | 22.23 | ||
| 居住 | 13.04 | 19.55 | 13.35 | 20.02 | ||
| 休闲旅游 | 12.22 | 18.34 | 12.52 | 18.78 | ||
| 商业购物 | 12.04 | 18.05 | 12.36 | 18.55 | ||
| 平均 | 13.49 | 20.23 | 13.81 | 20.72 | ||
| 远 郊 圈 层 | 公共单位 | 34.91 | 41.89 | 35.79 | 42.95 | |
| 商业购物 | 30.24 | 36.28 | 30.98 | 37.18 | ||
| 对外交通 | 29.02 | 34.82 | 29.76 | 35.71 | ||
| 居住 | 25.34 | 30.41 | 25.92 | 31.11 | ||
| 产业 | 25.00 | 30.00 | 25.62 | 30.74 | ||
| 休闲旅游 | 21.02 | 25.23 | 21.75 | 26.10 | ||
| 平均 | 26.11 | 31.33 | 26.75 | 32.10 | ||
表4 广州市地铁工作日和周末出行集中区间Table 4 Metro travel aggregate distance interval in weekday and weekend in Guangzhou |
| 圈层/类型 | 工作日 | 周末 | ||||||
|---|---|---|---|---|---|---|---|---|
| 低拐点/km | 高拐点/km | 客流占比/% | 低拐点/km | 高拐点/km | 客流占比/% | |||
| 全市 | 8.55 | 26.61 | 71.88 | 9.07 | 26.39 | 70.07 | ||
| 中 心 圈 层 | 对外交通 | 2.60 | 22.98 | 81.06 | 2.15 | 21.15 | 80.97 | |
| 休闲旅游 | 2.79 | 17.81 | 78.50 | 1.92 | 17.28 | 80.67 | ||
| 居住 | 2.60 | 18.37 | 78.95 | 1.99 | 17.57 | 79.47 | ||
| 公共单位 | 3.46 | 21.26 | 77.20 | 1.72 | 19.68 | 79.40 | ||
| 商业购物 | 2.44 | 19.17 | 79.43 | 1.76 | 17.17 | 79.04 | ||
| 商务办公 | 2.92 | 20.22 | 78.71 | 3.15 | 19.30 | 74.88 | ||
| 平均 | 2.74 | 19.23 | 78.87 | 2.12 | 18.09 | 78.86 | ||
| 近 郊 圈 层 | 对外交通 | 8.15 | 24.72 | 75.4 | 8.44 | 23.22 | 72.19 | |
| 休闲旅游 | 5.46 | 23.93 | 73.22 | 5.99 | 23.57 | 70.59 | ||
| 公共单位 | 10.17 | 27.24 | 69.51 | 11.15 | 28.37 | 69.51 | ||
| 商务办公 | 9.14 | 31.47 | 71.05 | 9.94 | 30.27 | 69.46 | ||
| 居住 | 7.02 | 24.55 | 72.79 | 7.24 | 24.03 | 69.40 | ||
| 产业 | 11.52 | 28.63 | 58.64 | 11.15 | 28.33 | 60.44 | ||
| 商业购物 | 9.30 | 26.79 | 66.64 | 9.41 | 27.76 | 56.93 | ||
| 平均 | 7.49 | 25.23 | 71.81 | 7.80 | 24.85 | 68.89 | ||
| 远 郊 圈 层 | 商业购物 | 26.74 | 51.62 | 62.72 | 27.30 | 50.45 | 61.12 | |
| 居住 | 23.52 | 46.74 | 58.76 | 26.03 | 47.69 | 56.16 | ||
| 休闲旅游 | 23.04 | 46.92 | 57.37 | 25.80 | 50.33 | 54.06 | ||
| 公共单位 | 37.76 | 60.48 | 55.44 | 40.44 | 60.48 | 54.00 | ||
| 产业 | 18.41 | 39.06 | 47.20 | 33.55 | 55.90 | 45.11 | ||
| 对外交通 | 29.11 | 46.38 | 49.85 | 30.31 | 43.32 | 44.10 | ||
| 平均 | 24.30 | 46.73 | 56.55 | 27.95 | 48.99 | 53.73 | ||
表5 广州市不同人群平均地铁出行距离和时间Table 5 Average metro travel distance and time in different population group in Guangzhou |
| 人群 | 市域人口比例/% | 潜在客流占比/% | 工作日 | 周末 | ||||
|---|---|---|---|---|---|---|---|---|
| 距离/km | 间距/km | 距离/km | 间距/km | |||||
| 性别 | 男 | 52.29 | 52.03 | 11.86 | 17.55 | 12.13 | 17.03 | |
| 女 | 47.71 | 47.97 | 11.70 | 17.46 | 11.96 | 17.00 | ||
| 年龄/岁 | ≤18 | 15.15 | 13.72 | 11.98 | 17.61 | 12.25 | 17.11 | |
| 19~64 | 78.10 | 78.54 | 11.85 | 17.53 | 12.11 | 17.01 | ||
| ≥65 | 6.75 | 7.74 | 10.80 | 17.10 | 11.01 | 16.90 | ||
| 户籍 | 本地户 | 51.64 | 60.53 | 11.41 | 17.15 | 11.63 | 16.94 | |
| 省内迁移户 | 24.99 | 18.57 | 11.95 | 17.80 | 12.26 | 17.05 | ||
| 省外迁移户 | 23.37 | 20.90 | 13.05 | 18.23 | 13.37 | 17.21 | ||
| 受教育水平 | 小学以下 | 5.91 | 5.21 | 12.01 | 17.56 | 12.29 | 17.26 | |
| 中学 | 53.72 | 49.19 | 12.30 | 17.31 | 12.58 | 17.13 | ||
| 大学 | 36.54 | 41.04 | 11.73 | 17.67 | 11.99 | 17.04 | ||
| 研究生以上 | 3.83 | 4.56 | 10.50 | 17.48 | 10.73 | 16.88 | ||
| 住房 | 租住公房 | 4.34 | 3.86 | 13.34 | 18.39 | 13.64 | 17.11 | |
| 租住私房 | 42.31 | 46.09 | 12.56 | 18.36 | 12.89 | 17.40 | ||
| 自建房 | 21.06 | 8.25 | 14.87 | 18.48 | 15.21 | 17.84 | ||
| 购买商品房 | 17.66 | 21.53 | 11.11 | 17.18 | 11.36 | 17.11 | ||
| 购买二手房 | 3.72 | 4.79 | 10.90 | 17.12 | 11.13 | 16.95 | ||
| 购买经济房 | 1.25 | 1.29 | 11.22 | 17.61 | 11.46 | 16.93 | ||
| 购买公房 | 9.65 | 14.18 | 10.20 | 16.98 | 10.39 | 16.91 | ||
| 职业 | 单位负责人 | 4.45 | 5.42 | 12.40 | 18.21 | 12.72 | 17.20 | |
| 专业技术人员 | 11.51 | 13.99 | 11.55 | 17.61 | 11.81 | 17.26 | ||
| 办事人员 | 10.75 | 13.40 | 11.75 | 17.71 | 12.02 | 17.29 | ||
| 商服人员 | 30.75 | 38.73 | 11.61 | 17.76 | 11.87 | 17.15 | ||
| 农业生产人员 | 8.44 | 0.83 | 18.30 | 18.89 | 18.62 | 18.17 | ||
| 工业生产人员 | 34.09 | 27.63 | 14.56 | 18.73 | 14.90 | 17.74 | ||
| 收入来源 | 劳动收入 | 64.83 | 61.38 | 12.53 | 18.03 | 12.82 | 17.35 | |
| 离退休金养老金 | 9.96 | 15.13 | 10.32 | 16.97 | 10.53 | 16.89 | ||
| 失业保险金 | 0.12 | 0.20 | 10.01 | 16.79 | 10.20 | 16.87 | ||
| 最低生活保障金 | 0.40 | 0.34 | 11.54 | 17.28 | 11.75 | 16.98 | ||
| 财产性收入 | 1.71 | 2.03 | 12.01 | 17.83 | 12.33 | 17.37 | ||
| 家庭其他成员供养 | 22.98 | 20.93 | 12.01 | 17.59 | 12.30 | 17.13 | ||
| 婚龄/a | <3 | 19.69 | 18.62 | 12.49 | 18.12 | 12.80 | 17.44 | |
| ≥3 | 80.31 | 81.38 | 11.77 | 17.60 | 12.03 | 17.20 | ||

|
Baker Dwayne Marshall and Lee Bumsoo. 2019. How Does Light Rail Transit (LRT) Impact Gentrification? Evidence from Fourteen US Urbanized Areas. Journal of Planning Education and Research, 39(1): 35-49.
|
|
Calvo Francisco, Oña Juan and Arán Fernando. 2013. Impact of the Madrid Subway on Population Settlement and Land Use. Land Use Policy, 31: 627-639.
|
|
Hess Daniel Baldwin and Almeida Tangerine Maria. 2007. Impact of Proximity to Light Rail Rapid Transit on Station-Area Property Values in Buffalo, New York. Urban Studies, 44 (5/6): 1041-1068.
|
|
陈忠暖,郭敏玲,许敏琳,方远平. 2010. 建国以来广州居民市内出行可达空间的演变——基于常规公交视角的研究. 经济地理,30(11):1797-1803. [Chen Zhongnuan, Guo Minling, Xu Minlin and Fang Yuanping. 2010. Study on the Evolution of Residents Reachable Spatial Based on Regular Bus Transit in Guangzhou City. Economic Geography, 30(11): 1797-1803. ]
|
|
代丹丹,周春山. 2017. 广州市中产阶层日常活动的时空间特征. 人文地理,32(4):45-53. [Dai Dandan and Zhou Chunshan. 2017. The Spatial-Temporal Characteristics of Middle Class Daily Activities in Guangzhou, China. Human Geography, 32(4): 45-53. ]
|
|
古杰,周素红,闫小培. 2014. 生命历程视角下广州市居民日常出行的时空路径分析. 人文地理,29(3):56-62. [Gu Jie, Zhou Suhong and Yan Xiaopei. 2014. The Space-Time Paths of Residents' Daily Travel in Guangzhou from a Perspective of Life Course. Human Geography, 29(3): 56-62. ]
|
|
广州市统计局. 2013. 广州市第六次人口普查. (2019-09-17)[2021-09-01]. http://tjj.gz.gov.cn/pchb/dlcrkpc/. [Guangzhou Statistics Bureau. 2017. The Sixth Population Census of Guangzhou. (2019-09-17) [2021-09-01]. http://tjj.gz.gov.cn/pchb/dlcrkpc/. ]
|
|
广州市统计局. 2017. 广州市2015年1%人口抽样调查.(2018-11-21)[2021-09-01]. http://tjj.gz.gov.cn/pchb/2015n1rkcydc/. [Guangzhou Statistics Bureau. 2017. 1% Population Sampling Survey in 2015. (2018-11-21) [2021-09-01]. http://tjj.gz.gov.cn/pchb/2015n1rkcydc/. ]
|
|
黄晓燕,张爽,曹小曙. 2014. 广州市地铁可达性时空演化及其对公交可达性的影响. 地理科学进展,33(8):1078-1089. [Huang Xiaoyan, Zhang Shuang and Cao Xiaoshu. 2014. Spatial-Temporal Evolution of Guangzhou Subway Accessibility and Its Effects on the Accessibility of Public Transportation Services. Progress in Geography, 33(8): 1078-1089. ]
|
|
季珏,高晓路. 2012. 基于居民日常出行的生活空间单元的划分. 地理科学进展,31(2):248-254. [Ji Jue and Gao Xiaolu. 2012. Identifying the Scope of Daily Life in Urban Areas Based on Residents' Travel Behaviors. Progress in Geography, 31(2): 248-254. ]
|
|
李文翎,谢轶. 2004. 广州地铁沿线的居民出行与城市空间结构分析. 现代城市研究,(4):61-64. [Li Wenling and Xie Yi. 2004. The Characteristics of the Trips of Inhabitants and the Urban Space Structure alone the Subway in Guangzhou City. Modern Urban Research, (4): 61-64. ]
|
|
栾鑫,邓卫,程琳,陈新元. 2018. 特大城市居民出行方式选择行为的混合Logit模型. 吉林大学学报(工学版),48(4):1029-1036. [Luan Xin, Deng Wei, Cheng Lin and Chen Xinyuan. 2018. Mixed Logit Model for Understanding Travel Mode Choice Behavior of Megalopolitan Residents. Journal of Jilin University (Engineering and Technology Edition), 48(4): 1029-1036. ]
|
|
马亮,马雪城. 2017. 轨道沿线居民出行方式选择行为研究——以深圳市为例. 重庆交通大学学报(社会科学版),17(6):25-29. [Ma Liang and Ma Xuecheng. 2017. On the Travel Mode Choice Behavior of the Residents along the Rail Transit Taking Shenzhen. Journal of Chongqing Jiaotong University (Social Sciences Edition), 17(6): 25-29. ]
|
|
孟斌,黄松,尹芹. 2019. 北京市居民地铁出行出发时间弹性时空分布特征研究. 地球信息科学学报,21(1):107-117. [Meng Bin, Huang Song and Yin Qin. 2019. Spatial and Temporal Distribution Characteristics of Residents' Depart Times Elasticity in Beijing. Journal of Geo-Information Science, 21(1): 107-117. ]
|
|
《隧道建设(中英文)》编辑部. 2020. 中国城市轨道交通2019年度数据统计. 隧道建设(中英文),40(5):762. [Editorial Office of Tunnel Construction. 2020. Statistics on Annual Data of Urban Rail Transit in China in 2019. Tunnel Construction, 40 (5): 762. ]
|
|
佟新,王雅静. 2018. 城市居民出行方式的性别比较研究. 山西师大学报(社会科学版),45(3):64-69. [Tong Xin and Wang Yajing. 2018. A Comparative Study of Urban Residents' Travel Modes in the Perspective of Gender. Journal of Shanxi Normal University (Social Science Edition), 45(3): 64-69. ]
|
|
汪瑞琪,陈建均. 2019. 手机大数据在城市居民出行特征分析的应用. 智能城市,(15):151-153. [Wang Ruiqi and Chen Jianjun. 2019. Application of Mobile Big Data in the Travel Characteristics Analysis of Urban Residents. Intelligent City, (15): 151-153. ]
|
|
王雯静,干宏程. 2010. 小汽车与轨道交通出行方式选择行为分析. 城市交通,8(3):36-40. [Wang Wenjing and Gan Hongcheng. 2010. Car or Public Transit? Analysis on Travel Mode Choice Behavior. Urban Transport of China, 8(3): 36-40. ]
|
|
魏海涛,肖天聪,胡宝生,王薇,王晨曦. 2020. 基于出租车GPS数据的居民出行行为和城市空间结构分析——以北京市为例. 上海城市规划,(1):69-76. [Wei Haitao, Xiao Tiancong, Hu Baosheng, Wang Wei and Wang Chenxi. 2020. Analysis of Residents Travel Behavior and Urban Spatial Structure Based on Beijing Taxi GPS Data. Shanghai Urban Planning Review, (1): 69-76. ]
|
|
张天然. 2016. 基于手机信令数据的上海市域职住空间分析. 城市交通,14(1):15-23. [Zhang Tianran. 2016. Job-Housing Spatial Distribution Analysis in Shanghai Metropolitan Area Based on Cellular Signaling Data. Urban Transport of China, 14(1): 15-23. ]
|
|
张文尝,王成金,马清裕. 2007. 中国城市居民出行的时空特征及影响因素研究. 地理科学,27(6):737-742. [Zhang Wenchang, Wang Chengjin and Ma Qingyu. 2007. Spatial-Temporal Characteristics of Urban Resident Trips and Influence Factors in China. Scientia Geographica Sinica, 27(6): 737-742. ]
|
|
赵鹏军,李南慧,李圣晓. 2016. TOD建成环境特征对居民活动与出行影响——以北京为例. 城市发展研究,23(6):45-51. [Zhao Pengjun, Li Nanhui and Li Shengxiao. 2016. The Impacts of the Built Environment on Residents' Acitivities and Travel Behavior in TOD Areas: A Case Study of Beijing. Urban Development Studies, 23(6): 45-51. ]
|
|
赵莹,柴彦威,关美宝. 2014. 中美城市居民出行行为的比较——以北京市与芝加哥市为例. 地理研究,33(12):2275-2285. [Zhao Ying, Chai Yanwei and Kwan Meipo. 2014. Comparison of Urban Residents' Travel Behavior in China and the U.S.: A Case Study between Beijing and Chicago. Geographical Research, 33(12): 2275-2285. ]
|
|
中华人民共和国住房和城乡建设部. 2012. 城市用地分类与规划建设用地标准GB50137-2011. 北京:中国建筑工业出版社. [Ministry of Housing and Urban-Rural Construction of the People's Republic of China. 2012. Code for Classification of Urban Land Use and Planning Standards of Development Land GB 50137-2011. Beijing: China Architecture & Building Press. ]
|
|
周素红,宋江宇,宋广文. 2017. 广州市居民工作日小汽车出行个体与社区双层影响机制. 地理学报,72(8):1444-1457. [Zhou Suhong, Song Jiangyu and Song Guangwen. 2017. Examining the Dual-Levels Impact of Neighbourhood and Individual Variables on Car Use on Weekdays in Guangzhou. Acta Geographica Sinica, 72(8): 1444-1457. ]
|
|
宗会明,何舟,杨庆媛,戴技才. 2014. 基于SP方法的重庆居民轨道交通出行时间价值及影响因素分析. 现代城市研究,(2):115-120. [Zong Huiming, He Zhou, Yang Qingyuan and Dai Jicai. 2014. The Value of Travel Time of the Rail Transportation Based on SP Method: A Case Study of Chongqing City. Modern Urban Research, (2): 115-120. ]
|
/
| 〈 |
|
〉 |