
广东省市际边界城镇发展的空间类型划分
|
廖开怀(1984—),男,江西寻乌人,副教授,博士,硕士生导师,主要研究方向为边界、城市地理与规划,(E-mail)kaihuai121@126.com; |
收稿日期: 2021-04-06
修回日期: 2021-06-08
网络出版日期: 2022-03-21
基金资助
国家自然科学基金面上项目(41971196)
广东省自然科学基金面上项目(2021A1515012247)
广东省社科规划(GD20SQ16)
Identification of Spatial Development Types of Inter-City Border Towns in Guangdong Province, China
Received date: 2021-04-06
Revised date: 2021-06-08
Online published: 2022-03-21
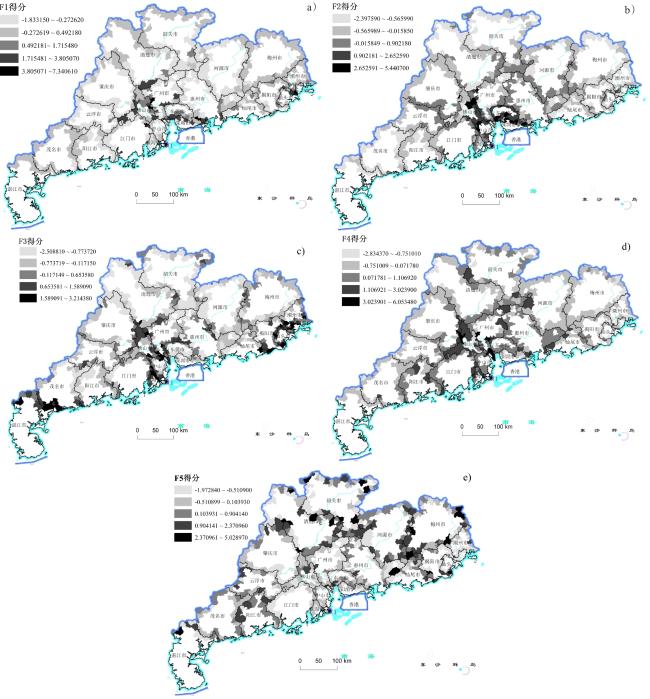
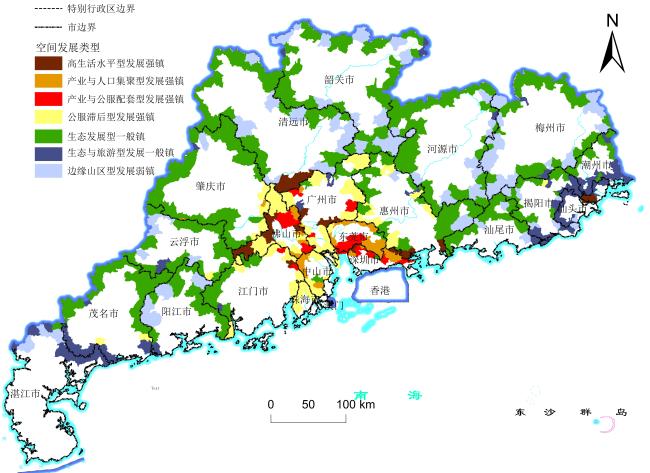
利用中国县域统计年鉴(乡镇卷)和中国GDP空间分布公里网格数据集等各类数据,采用因子分析、莫兰指数和GIS分组分析法,对广东省市际边界城镇发展的空间类型进行定量的实证研究。结果表明,广东省市际边界城镇空间结构由公共服务设施与旅游资源类、企业与人口集聚类、生态本底资源类、人民生活水平类以及边缘艰苦类5个主成分因子构成,不同主因子的空间关联性存在差异,其中生态本底资源类和企业与人口集聚类主因子的空间关联性最强,而边缘艰苦类主因子的空间关联性最弱。市际边界城镇的空间发展类型可以划分为高生活水平型发展强镇、产业与人口集聚型发展强镇、产业与公服配套型发展强镇、公服滞后型发展强镇、生态发展型一般镇、生态与旅游型发展一般镇、边缘山区型发展弱镇7类。自然资源禀赋与区位、社会经济发展水平和产业结构、历史基础、政府政策和文化差异为影响市际边界城镇发展空间类型的5大因素。
廖开怀 , 陈姝卉 . 广东省市际边界城镇发展的空间类型划分[J]. 热带地理, 2022 , 42(3) : 431 -443 . DOI: 10.13284/j.cnki.rddl.003429
The identification of spatial development types of border areas is one of the research hotspots in human-economic geography. Current studies mostly focus on border areas affected by provincial boundaries, and limited studies have explored the spatial structure and development types of border towns affected by inter-city boundaries. Based on multiple types of data, such as China County Statistical Yearbook (villages and towns volume) and 1-kilometer grid GDP dataset of China, this study used quantitative methods of factor analysis, Moran's I, and GIS grouping analysis to explore the spatial development types of inter-city border towns in Guangdong Province. A total of 564 inter-city border towns were chosen for the study. The results show that: (1) the spatial structure of the inter-city border towns in Guangdong Province comprises five principal component factors: public service facilities and tourism resources, enterprises and population agglomeration, ecological background resources, people's living standards, and margin and poverty. Different principal component factors have different spatial correlation coefficients. The factors of ecological background resources and enterprises and population agglomeration have the strongest spatial autocorrelations, while the margin and poverty factor has the weakest spatial autocorrelation. (2) The spatial distribution pattern of the ecological background resources factor is consistent with the topographic distribution, indicating a trend of agglomeration in the plains of the Pearl River Delta, Chaozhou-Jieyang-Shantou area, and Zhanjiang-Maoming junction area. The spatial distribution pattern of the enterprises and population agglomeration factor shows a gradually decreasing distribution from the Pearl River Delta to eastern, western, and northern Guangdong. The spatial distribution pattern of the margin and poverty factor shows the characteristics of "small aggregation and large dispersion" outside the Pearl River Delta of Guangdong Province. (3) According to the strengths and weaknesses of the town and level of development, there are seven types of spatial development of inter-city border towns: strong development towns with a high standard of living, with industry and population agglomeration, with industry and public service support, with a lagging development in public service, and general towns with ecological development, ecological and tourism development, and remote and mountainous weak development towns. There is significant spatial heterogeneity between the different types of border towns. The inter-city border towns in Guangdong Province have outstanding characteristics of "core-periphery" from the perspective of the development level, and the barrier effect of the inter-city border is significant between the inside and outside of the Pearl River Delta. (4) The spatial heterogeneity of Guangdong's inter-city border towns can be attributed to five major factors: natural resource endowment and location, socio-economic development level and industrial structure, historical evolution, government policies and cultural differences. The research results can provide scientific support for countering the barrier effect of inter-city borders and formulating classification guidelines and policy measures for the development of border towns.
表1 市际边界镇空间发展类型评价指标体系Table 1 Evaluation indicators system of spatial development types of inter-city border towns |
| 准则维度 | 解释指标 | 指标含义 | 参考文献 | 指标属性 |
|---|---|---|---|---|
| 交通发展 | 距广深港澳平均 出行时间/min | 镇街几何中心与广州、深圳、香港、澳门4个城市政府间的平均交通时间 | (徐旭 等,2007) | 负向 |
| 路网密度/(km·km-2) | 镇街行政单元内所有的道路的总长度与镇街总面积之比 | (刘彦随,2020) | 正向 | |
| 镇街特色 | 风景旅游名胜 景点数量/个 | 镇街行政范围内所拥有的风景与旅游景点的数量,反映镇街的旅游资源和特色 | (刘彦随,2020) | 正向 |
| 经济发展 | 人均GDP/(万元·人-1) | 镇街人均国内生产总值 | (王婧 等,2016) | 正向 |
| 企业数量/个 | 镇街行政范围内拥有的企业数量 | (刘彦随,2020) | 正向 | |
| 社会发展 | 科教文化设施数量/个 | 各镇街所包含的科教文化设施的兴趣点数量,设施主要包含各类型学校、科研院所、博物馆、展览馆、会展中心、美术馆、图书馆、培训机构、文化宫等 | (池娇 等,2016) | 正向 |
| 医疗卫生设施数量/个 | 各镇街所包含的医疗卫生设施的兴趣点数量,主要包含综合医院、专科医院、诊所、卫生院 | 正向 | ||
| 含省定贫困村数量/个 | 镇街行政单元所含2017年广东省认定的贫困村的数量 | (杜国明 等,2020) | 负向 | |
| 生态资源 | 地形起伏度/m | 指镇街行政单元内最高点海拔与最低点海拔高度的差值 | (封志明 等,2007) | 负向 |
| 植被覆盖指数NDVI/% | 镇街行政单元内林地、草地、农田、建设用地和未利用地5种类型的面积占被评价区域面积的比重 | (田庆久 等,1998) | 正向 | |
| 耕地面积占比/% | 镇街行政单元内水田、旱地总面积与镇域面积的比值 | (刘彦随,2020) | 正向 | |
| 人口发展 | 人口密度/(人·km-2) | 单位土地面积上的常住人口数量 | (刘彦随,2020) | 正向 |
表2 边界镇发展评价主成分因子(载荷系数>0.4)Table 2 Principal component factors of development evaluation of inter-city border towns (loading coefficient >0.4) |
| 编号 | 特征根 | 旋转前方差解释率 | 旋转后方差解释率 | ||||||||
|---|---|---|---|---|---|---|---|---|---|---|---|
| 特征根 | 方差解释率/% | 累积/% | 特征根 | 方差解释率/% | 累积/% | 特征根 | 方差解释率/% | 累积/% | |||
| 1 | 5.527 | 46.055 | 46.055 | 5.527 | 46.055 | 46.055 | 2.846 | 23.713 | 23.713 | ||
| 2 | 1.508 | 12.563 | 58.618 | 1.508 | 12.563 | 58.618 | 2.677 | 22.312 | 46.025 | ||
| 3 | 1.170 | 9.753 | 68.371 | 1.170 | 9.753 | 68.371 | 1.812 | 15.102 | 61.128 | ||
| 4 | 0.836 | 6.968 | 75.339 | 0.836 | 6.968 | 75.339 | 1.312 | 10.931 | 72.059 | ||
| 5 | 0.720 | 6.002 | 81.341 | 0.720 | 6.002 | 81.341 | 1.114 | 9.283 | 81.341 | ||
| 6 | 0.546 | 4.551 | 85.892 | - | - | - | - | - | - | ||
| … | … | … | … | - | - | - | - | - | - | ||
| 12 | 0.109 | 0.911 | 100 | - | - | - | - | - | - | ||
表3 因子分析主因子载荷系数(旋转后)Table 3 Loading coefficient of factor analysis (rotated component matrix) |
| 名称 | 因子载荷系数 | 共同度(公因子方差) | ||||
|---|---|---|---|---|---|---|
| 因子F1 | 因子F2 | 因子F3 | 因子F4 | 因子F5 | ||
| 科教文化设施数量 | 0.906 | 0.146 | 0.035 | 0.230 | -0.020 | 0.710 |
| 医疗卫生设施数量 | 0.851 | 0.355 | -0.028 | 0.160 | -0.002 | 0.836 |
| 风景名胜旅游景点 | 0.697 | 0.355 | 0.205 | -0.145 | -0.230 | 0.888 |
| 路网密度 | 0.533 | 0.566 | 0.316 | 0.068 | -0.207 | 0.773 |
| 工业企业数量 | 0.320 | 0.763 | -0.054 | 0.149 | -0.027 | 0.850 |
| 距广深港澳平均出行时间 | -0.099 | -0.654 | -0.017 | -0.515 | 0.100 | 0.751 |
| 人口密度 | 0.353 | 0.739 | 0.180 | -0.195 | -0.173 | 0.727 |
| 植被覆盖指数 | -0.474 | -0.587 | -0.486 | -0.220 | 0.183 | 0.775 |
| 耕地面积占比 | -0.038 | -0.107 | 0.914 | -0.024 | 0.036 | 0.876 |
| 地形起伏度 | -0.207 | -0.381 | -0.746 | -0.06 | 0.165 | 0.896 |
| 人均GDP | 0.152 | 0.056 | 0.032 | 0.887 | -0.150 | 0.710 |
| 含省定贫困村数 | -0.099 | -0.153 | -0.065 | -0.182 | 0.946 | 0.967 |
| 特征根 | 2.846 | 2.677 | 1.812 | 1.312 | 1.114 | — |
| 方差解释率 | 23.713 | 22.312 | 15.102 | 10.931 | 9.283 | — |
| Z值 | 15.623 | 32.368 | 34.103 | 24.231 | 8.090 | — |
| Moran's I | 0.359 | 0.754 | 0.799 | 0.564 | 0.188 | — |
表4 市际边界城镇发展特征判别Table 4 The distinguishing of development characteristics of inter-city border towns |
| 类型 | 项目数量/个 | 均值/平方和均值 | F1:公共服务设施与 旅游资源类 | F2:企业与人口 集聚类 | F3:生态本底 资源类 | F4:人民生活 水平类 | F5: 边缘艰苦类 |
|---|---|---|---|---|---|---|---|
| 类型一 | 16 | 均值 | 4.318 | -0.829 | -0.223 | 1.191 | -0.101 |
| 平方和均值 | 21.727 | 1.650 | 0.451 | 5.508 | 0.393 | ||
| 类型二 | 32 | 均值 | -0.135 | 2.743 | 0.036 | -0.037 | -0.395 |
| 平方和均值 | 0.388 | 8.831 | 0.376 | 0.949 | 0.298 | ||
| 类型三 | 17 | 均值 | 2.127 | 2.048 | -0.605 | -0.071 | -0.149 |
| 平方和均值 | 4.953 | 5.852 | 0.844 | 0.855 | 0.391 | ||
| 类型四 | 72 | 均值 | -0.342 | 0.277 | 0.844 | 1.481 | -0.375 |
| 平方和均值 | 0.385 | 0.508 | 1.349 | 3.462 | 0.207 | ||
| 类型五 | 257 | 均值 | -0.303 | -0.339 | -0.666 | -0.133 | -0.288 |
| 平方和均值 | 0.192 | 0.286 | 0.654 | 0.337 | 0.402 | ||
| 类型六 | 92 | 均值 | 0.113 | -0.409 | 1.353 | -0.753 | -0.355 |
| 平方和均值 | 0.339 | 0.398 | 2.361 | 0.832 | 0.578 | ||
| 类型七 | 78 | 均值 | -0.112 | -0.059 | -0.019 | -0.254 | 1.929 |
| 平方和均值 | 0.134 | 0.099 | 0.603 | 0.226 | 4.732 |
表5 产业与人口集聚型发展强镇Table 5 Strong development towns with industry and population agglomeration |
| 所属市 所属区 镇(街道) | ||
|---|---|---|
| 东莞市 | 东莞市 | 凤岗镇、高埗镇、黄江镇、企石镇、 桥头镇、清溪镇、沙田镇、石碣镇、 石龙镇、石排镇、塘厦镇、中堂镇 |
| 佛山市 | 南海区 | 里水镇 |
| 顺德区 | 陈村镇、均安镇、伦教街道 | |
| 广州市 | 主城区 | 东漖街道、桥中街道 |
| 花都区 | 芙蓉镇 | |
| 深圳市 | 坪山区 | 坑梓街道 |
| 龙岗区 | 平湖街道、坪地街道 | |
| 光明区 | 新湖街道 | |
| 肇庆市 | 德庆县 | 德城街道 |
| 四会市 | 大旺经济开发区 | |
| 中山市 | 中山市 | 大涌镇、东凤镇、古镇镇、横栏镇、南头镇、三乡镇、小榄镇 |
表6 产业与公服配套型发展强镇Table 6 Strong development towns with industry and public service supporting |
| 所属市 | 所属区 | 镇(街道) |
|---|---|---|
| 东莞市 | 东莞市 | 大朗镇、大岭山镇、虎门镇、长安镇 |
| 佛山市 | 南海区 | 大沥镇、狮山镇 |
| 顺德区 | 大良街道、容桂街道 | |
| 广州市 | 番禺区 | 东环街道 |
| 花都区 | 狮岭镇 | |
| 增城区 | 荔城街道 | |
| 江门市 | 新会区 | 沙坪街道、外海街道 |
| 深圳市 | 宝安区 | 沙井街道、松岗街道 |
| 龙华区 | 观澜街道 | |
| 龙岗区 | 横岗街道 |

1 www.gscloud.cn
2 http://www.resdc.cn/
廖开怀:主要完成文章概念的形成,指标体系的构建,结果分析等内容;
陈姝卉:主要完成数据的收集、处理与演算,图件的制作等内容。
|
曹小曙,徐建斌.2018.中国省际边界区县域经济格局及影响因素的空间异质性.地理学报,73(6):1065-1075.[Cao Xiaoshu and Xu Jianbin. 2018. Spatial Heterogeneity Analysis of Regional Economic Development and Driving Factors in China's Provincial Border Counties. Acta Geographica Sinica, 73(6): 1065-1075. ]
|
|
陈钊.1996.行政边界区域刍论.人文地理,11(4):45-48.[Chen Zhao. 1996. Research of Administrative Border-Regions. Human Geography, 11(4): 45-48. ]
|
|
池娇,焦利民,董婷,谷岩岩,马雅兰.2016.基于POI数据的城市功能区定量识别及其可视化.测绘地理信息,41(2):68-73.[Chi Jiao, Jiao Limin, Dong Ting, Gu Yanyan and Ma Yalan. 2016. Quantitative Identification and Visualization of Urban Functional Area Based on POI Data. Geographic Mapping Information, 41(2): 68-73. ]
|
|
De Noronha T and Vaz E. 2015. Framing Urban Habitats: The Small and Medium Towns in the Peripheries. Habitat International, 45(1): 147-155.
|
|
杜国明,冯悦,于佳兴.2020.典型深度贫困县贫困格局及影响因素分析——以海伦市为例.地理科学进展,39(1):69-77.[Du Guoming, Feng Yue and Yu Jiaxing. 2020. Poverty Pattern and Influencing Factors in Typical Deep Poverty-Stricken Counties: A Case Study of Hailun City in Heilongjiang Province. Progress in Geography, 39(1): 69-77. ]
|
|
Esri. 2014.ArcGIS 帮助10.1分组分析的工作原理.[2019-01-18]. http://resources.arcgis.com/zh-cn/help/main/10.1/index.html#/na/005p0000004w000000/. [ESRI. 2014. ArcGIS Help10.1. Working Principle of Grouping Analysis. [2019-01-18]. http://resources.arcgis.com/zh-cn/help/main/10.1/index.html#/na/005p0000004w000000/. ]
|
|
封志明,唐焰,杨艳昭,张丹.2007.中国地形起伏度及其与人口分布的相关性.地理学报,62(10):1073-1082.[Feng Zhiming, Tang Yan, Yang Yanzhao and Zhang Dan. 2007. The Relief Degree of Land Surface in China and Its Correlation with Population Distribution. Acta Geographica Sinica, 62(10): 1073-1082. ]
|
|
Gasparini A. 2014. Belonging and Identity in the European Border Towns: Self-Centered Borders, Hetero-Centered Borders. Journal of Borderlands Studies, 29(2): 165-201.
|
|
广东省人民政府. 2017.关于2277个省定贫困村创建社会主义新农村示范村的实施方案.(2017-08-04)[2019-03-12]. https://hm.meijiang.gov.cn/files/201903/0aebe5be3e825c03141893df0bb0ef93.pdf. [The People's Government of Guangdong Province. 2017. Implementation Plan on 2277 Provincial-Designated Poverty-Stricken Villages to Construct Demonstrated Socialism New Countryside. (2017-08-04) [2019-03-12]. https://hm.meijiang.gov.cn/files/201903/0aebe5be3e825c03141893df0bb0ef93.pdf. ]
|
|
国家统计局农村社会经济调查司.2018.中国县域统计年鉴(乡镇卷).北京:中国统计出版社.[National Bureau of Statistics. Rural Social and Economic Investigation Division. China. 2018. County Statistical Yearbook (Villages and Towns Volume). Beijing: China Statistics Press. ]
|
|
韩非,蔡建明,刘军萍.2010.大都市郊区小城镇的经济地域类型及其空间分异探析——以北京市为例.城市发展研究,17(4):123-128.[Han Fei, Cai Jianming and Liu Junping. 2010. Regional Economic Types and Spatial Differentiation of Small Towns in Peri-Urban Beijing. Urban Development Studies, 17(4): 123-128. ]
|
|
韩玉刚,李俊峰.2013.基于县域尺度的省际边缘区空间经济整合模式——以安徽省宁国市为例.经济地理,33(11):28-34.[Han Yugang and Li Junfeng. 2013. The Patterns of Spatial Economic Integration of Provincial Border-Regions Based on the County Scale—A Case Study of Ningguo City in Anhui Province. Economic Geography, 33(11): 28-34. ]
|
|
廖开怀,何金廖,蔡云楠,Werner Breitung.2020.国外政治地理学边界理论研究进展与评述.世界地理研究,29(2):264-274.[Liao Kaihuai, He Jinliao, Cai Yunnan and Werner Breitung. 2020. A Review of International Political Geography Studies on Border Theories. World Regional Studies, 29(2): 264-274. ]
|
|
刘彦随.2020.中国乡村振兴规划的基础理论与方法论.地理学报,75(6):1120-1133.[Liu Yansui. 2020. Research on the Urban- Rural Integration and Rural Revitalization in the New Era in China. Acta Geographica Sinica, 73(6): 1120-1133. ]
|
|
李红,张珺,欧晓静.2017. 边境省区县域城镇化与人口迁移的时空演变及机制分析——以广西为例.热带地理,37(2):163-173.[Li Hong, Zhang Jun and Ou Xiaojing. 2017. Spatiotemporal Evolution of County Urbanization and Migration of Population in Border Province: A Case Study of Guangxi. Tropical Geography, 37(2): 163-173. ]
|
|
Newman D. 2006. The Lines That Continue to Separate Us: Borders in Our 'Borderless' World. Progress in Human Geography, 30(2): 143-161.
|
|
O'dowd L. 2002.The Changing Significance of European Borders. Regional & Federal Studies, 12(4): 13-36.
|
|
Sánchez-Zamora P and Gallardo-Cobos R. 2019. Diversity, Disparity and Territorial Resilience in the Context of the Economic Crisis: An Analysis of Rural Areas in Southern Spain. Sustainability, 11(6): 2-21.
|
|
尚正永,刘传明,白永平,张小林.2010.省际边界区域发展的空间结构优化研究——以粤闽湘赣省际边界区域为例.经济地理,30(2):183-187.[Shang Zhengyong, Liu Chuanming, Bai Yongping and Zhang Xiaolin. 2010. Spatial Integration in the Inter-Provincial Boundary Area of Guangdong, Fujian, Hunan and Jiangxi. Economic Geography, 30(2): 183-187. ]
|
|
沈迟.2006.分类指导——有效促进我国小城镇发展的关键.小城镇建设,(12):75-78.[Shen Chi. 2006. Classified Guidance—The Key to Effectively Promoting the Development of Small Towns in Chinese Country. Development of Small Cities & Towns, (12): 75-78. ]
|
|
田庆久,闵祥军.1998.植被指数研究进展.地球科学进展,(4):10-16.[Tian Qingjiu and Min Xiangjun. 1998. Research Progress of Vegetation Index. Progress of Earth Science, (4): 10-16. ]
|
|
王劲峰,廖一兰,刘鑫.2010.空间数据分析教程.北京:科学出版社.[Wang Jinfeng, Liao Yilan and Liu Xin. 2010. The Tutorial for Spatial Data Analysis. Beijing: Science Press. ]
|
|
王婧,李裕瑞.2016.中国县域城镇化发展格局及其影响因素——基于2000和2010年全国人口普查分县数据.地理学报,71(4):621-636.[Wang Jing and Li Yurui. 2016. Spatial Pattern and Influencing Factors of Urbanization Development in China at County Level: A Quantitative Analysis Based on 2000 and 2010 Census Data. Acta Geographica Sinica, 71(4): 621-636. ]
|
|
王兴平.2008.省际边界小城镇整合发展策略研究——以苏皖边界小城镇为例.现代城市研究,(10):46-53.[Wang Xingping. 2008. Strategic Study on the Integrated Development of Small Towns in Provincial Boundary Areas: Taking a Small Town in Jiangsu-Anhui Boundary Area as an Example. Modern Urban Research, (10): 46-53. ]
|
|
王印传,马帅,曲占波,王海乾.2014.省际边界城镇发展研究——首都经济圈省际边界城镇类型探讨.城市发展研究,21(1):96-101.[Wang Yinchuan, Ma Shuai, Qu Zhanbo and Wang Haiqian. 2014. Study on the Development of Provincial Border-Town: Exploration of Provincial Border-Town Type of Capital Economic Circle. Urban Development Studies, 21(1): 96-101. ]
|
|
王振波,朱传耿,徐建刚.2008.省际边界区域边界效应的测定——以淮海经济区为例.经济地理,28(5):765-770.[Wang Zhenbo, Zhu Chuangeng and Xu Jiangang. 2008. Measurement of the Border Effect of Provincial Border Regions: A Case Study of Huai-Hai Economic Zone. Economic Geography, 28(5): 765-770. ]
|
|
夏雪,韩增林,赵林,王静.2014.省际边缘区区域经济差异的时空格局与形成机理——以鄂豫皖赣为例.经济地理,34(5):21-27.[Xia Xue, Han Zenglin, Zhao Lin and Wang Jing. 2014. Spatio-Temporal Pattern and Mechanism of Economic Development Discrepancy in Provincial Border-Regions: A Case Study of Hubei-Henan-Anhui-Jiangxi. Economic Geography, 34(5): 21-27. ]
|
|
徐新良.2017.中国GDP空间分布公里网格数据集.中国科学院资源环境科学数据中心数据注册与出版系统.[2020-06-17]. http://www.resdc.cn/DOI. DOI: 10.12078/2017121102. [Xu Xinliang. 2017. 1 km Grid GDP Dataset of China. Data Registration and Publishing System of the Resource and Environmental Science and Data Center of the Chinese Academy of Sciences. [2020-06-17]. http://www.resdc.cn/DOI. DOI: 10.12078/2017121102. ]
|
|
徐旭,曹小曙,闫小培.2007.不同指标下的穗港城市走廊潜在通达性及其空间格局.地理研究,26(1):179-186.[Xu Xu, Cao Xiaoshu and Yan Xiaopei. 2007. Potential Accessibility and Its Spatial Pattern in Guangzhou-Hong Kong Urban Corridor. Geographical Research, 26(1): 179-186. ]
|
|
湛东升,张文忠,孟斌,党云晓,刘倩倩.2017.北京城市居住和就业空间类型区分析.地理科学,37(3):356-366.[Zhan Dongsheng, Zhang Wenzhong, Meng Bin, Dang Yunxiao and Liu Qianqian. 2017. Spatial Structure of Urban Residence and Employment in Beijing. Scientia Geographica Sinica, 37(3): 356-366. ]
|
|
张学波,杨成凤,宋金平,李伟.2015.中国省际边缘县域经济差异空间格局演变.经济地理,35(7):30-38.[Zhang Xuebo, Yang Chengfeng, Song Jinping and Li Wei. 2015. Spatial Pattern Evolution of China Provincial Border Counties Economic Disparity. Economic Geography, 35(7): 30-38. ]
|
|
张宇硕,白永平,李慧.2011.兰州—西宁城镇密集区县域经济差异的空间格局演化分析.经济地理,31(2):183-188.[Zhang Yushuo, Bai Yongping and Li Hui. 2011. Spatial Structure Evolution Analysis of Counties Economic Disparity in Urban Compact Area of Lanzhou-Xining. Economic Geography, 31(2): 183-188. ]
|
|
朱传耿,王振波,仇方道.2006.省际边界区域城市化模式研究.人文地理,21(1):1-5,128.[Zhu Chuangeng, Wang Zhenbo and Qiu Fangdao. 2006. Study on Urbanization Model of Provincial Border-Regions. Human Geography, 21(1): 1-5, 128. ]
|
|
朱传耿,王振波,孟召宜.2007.我国省际边界区域的研究进展及展望.经济地理,27(2):290,302-305.[Zhu Chuangeng, Wang Zhenbo and Meng Zhaoyi. 2007. Recent Progress of Studies on the Provincial Border Regions and Its Prospects in China. Economic Geography, 27(2): 290, 302-305. ]
|
/
| 〈 |
|
〉 |