
多维距离视角下中国影响力评价研究——以东南亚国家为例
|
黄小丽(1992—),女,河南许昌人,博士研究生,主要研究方向为东南亚地缘政治、人口地理,(E-mail)huangedwina@163.com; |
收稿日期: 2023-06-24
修回日期: 2023-09-11
网络出版日期: 2024-01-20
基金资助
国家社会科学基金项目“基于东南亚社会调查的中国国家形象及影响因素研究”(20BSH092)
China's Influence Evaluation from the Perspective of Multidimensional Distances: A Case Study of Southeast Asian Countries
Received date: 2023-06-24
Revised date: 2023-09-11
Online published: 2024-01-20
基于“海外中国企业与员工调查”东南亚地区数据,运用熵值法计算中国影响力并进行实证分析,研究发现:中国在东南亚大多数国家的影响力均超过美国,其中新加坡和马来西亚的民众对中国影响力评价最高,菲律宾和缅甸的民众对中国影响力评价最低,在马来西亚中美两国影响力差距最大,在菲律宾两国影响力差距最小。回归结果表明,经济距离、制度距离和社会距离对中国影响力评价起显著抑制作用,地理距离起正向促进作用,但作用微弱,文化距离正向作用不够稳健;异质性结果显示,地理距离、经济距离和社会距离对低收入人群影响更大,文化距离和制度距离对美国评价高的人群作用更大,地理距离缩小了受访者对中国影响力评价的差距,而经济距离、社会距离扩大了受访者对中国影响力评价的差距。这启示增强与东南亚各国家的贸易往来和民间友好往来、加强影视文化输出可以有效提高中国影响力。
黄小丽 , 许庆红 , 应奎 , 丁金宏 . 多维距离视角下中国影响力评价研究——以东南亚国家为例[J]. 热带地理, 2024 , 44(1) : 175 -187 . DOI: 10.13284/j.cnki.rddl.003815
National influence pertains to the encompassing evaluation and general impression of a given nation. As the Belt and Road Initiative celebrates its 10th anniversary, it is necessary to deepen the understanding its achievements by analyzing China's national influence. Using data from the Overseas Chinese Enterprises and Employees Comprehensive Survey in Southeast Asia, this study employed the entropy method to calculate China's level of influence. Additionally, it analyzed the significant role played by multidimensional distance factors. The findings revealed that China's influence surpasses that of the United States among most Southeast Asian countries. The citizens of Singapore and Malaysia rate China's influence the highest, while those in the Philippines and Myanmar rate it the lowest. The impact disparity between China and the United States is the greatest in Malaysia, and is smallest in the Philippines. The regression analysis indicates that China's influence is impeded by economic, institutional, and social distance. Specifically, there is a negative correlation between the degree of economic gap and institutional differences with the evaluation of China's influence. Moreover, the lower the degree of acceptance of the Chinese people in Southeast Asia, the less likely they are to view China's influence positively. These findings imply similar patterns in the Southeast Asian evaluation of China's influence that is closely related to economic and institutional differences. Geographic distance and cultural proximity may enhance individuals' perception of China's influence to a limited extent. However, the effect of geographical distance within the same region is relatively negligible, and the promotion effect of cultural distance is not robust, this defies the notion that spatial and cultural proximity to China can improve the manner in which people evaluate China's influence. In contrast, enjoying Chinese film and television productions, listening to Chinese music, and accessing information about China via the internet and new media can positively alter the perception of Southeast Asians toward China's overall impact. After accounting for potential measurement errors and the endogeneity of the key explanatory variables, the impact of multidimensional distance on the assessment of China's influence evaluation remains robust. Furthermore, there is clear individual variation in the effect of multidimensional distance on the evaluation of China's influence. Research indicates that geographical, economic, and social distance have a greater impact on low-income groups, while cultural and institutional distance have a greater effect on groups with higher evaluations of the United States. Geographical distance tends to narrow the gap in respondents' evaluations of China's influence, whereas economic and social distance tends to widen it. Therefore, China's influence can be enhanced by promoting trade and establishing friendly exchanges with Southeast Asian countries, and by increasing access to film and television productions.
表1 OCEES和ABS数据中美在东南亚各国的国家影响力比较Table 1 Comparison of the national influence of China and the US in Southeast Asian countries based on OCEES and ABS data |
| 国家/地区 | OCEES数据 | ABS数据 | |||
|---|---|---|---|---|---|
| 中国影响力 得分 | 美国影响力得分 | 中国影响力得分 | 美国影响力得分 | ||
| 菲律宾 | 0.61 | 0.49 | 0.56 | 0.45 | |
| 缅甸 | 0.61 | 0.38 | 0.59 | 0.22 | |
| 越南 | 0.71 | 0.47 | 0.55 | 0.25 | |
| 老挝 | 0.72 | 0.38 | ― | ― | |
| 泰国 | 0.73 | 0.44 | 0.70 | 0.31 | |
| 柬埔寨 | 0.71 | 0.39 | ― | ― | |
| 马来西亚 | 0.76 | 0.40 | 0.70 | 0.26 | |
| 新加坡 | 0.77 | 0.43 | 0.73 | 0.17 | |
| 印度尼西亚 | 0.66 | 0.39 | 0.59 | 0.28 | |
| 东南亚地区 | 0.69 | 0.42 | 0.63 | 0.28 | |
|
表2 东南亚各国与中国地理距离、经济距离、文化距离、制度距离与社会距离加权后均值Table 2 Weighted mean of geographical distance, economic distance, cultural distance, institutional distance and social distance between Southeast Asian countries and China |
| 国家 | 地理距离/km | 经济距离 | 文化距离 | 制度距离 | 社会距离 |
|---|---|---|---|---|---|
| 菲律宾 | 2 824.17 | 0.95 | 2.45 | 0.94 | 1.76 |
| 缅甸 | 3 074.09 | 1.46 | 2.96 | 0.94 | 3.45 |
| 越南 | 3 109.84 | 1.03 | 1.75 | 0 | 0.63 |
| 老挝 | 3 261.66 | 1.18 | 3.13 | 0 | 1.98 |
| 泰国 | 3 302.77 | 0.41 | 4.13 | 0.25 | 0.67 |
| 柬埔寨 | 3 365.8 | 1.50 | 3.40 | 0.19 | 2.48 |
| 马来西亚 | 4 313.71 | 0.11 | 2.70 | 0.88 | 0.47 |
| 新加坡 | 4 460.37 | 1.46 | 1.14 | 0.31 | 0.26 |
| 印度尼西亚 | 5 182.05 | 0.88 | 1.28 | 1.00 | 2.88 |
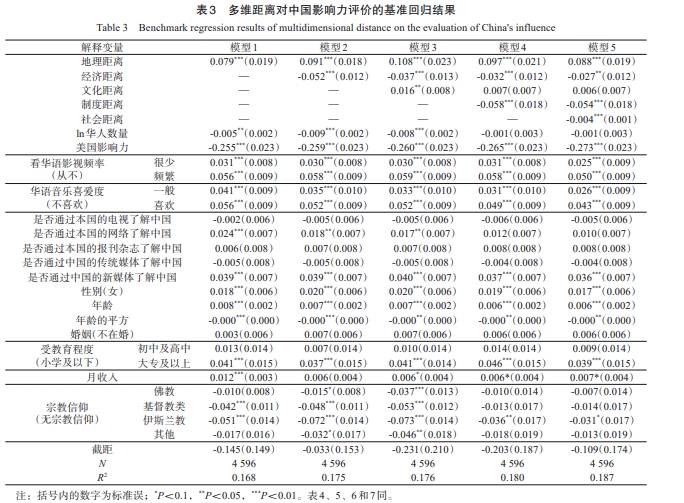
表3 多维距离对中国影响力评价的基准回归结果Table 3 Benchmark regression results of multidimensional distance on the evaluation of China's influence |
| 解释变量 | 模型1 | 模型2 | 模型3 | 模型4 | 模型5 | |
|---|---|---|---|---|---|---|
| 地理距离 | 0.079***(0.019) | 0.091***(0.018) | 0.108***(0.023) | 0.097***(0.021) | 0.088***(0.019) | |
| 经济距离 | — | -0.052***(0.012) | -0.037***(0.013) | -0.032***(0.012) | -0.027**(0.012) | |
| 文化距离 | — | — | 0.016**(0.008) | 0.007(0.007) | 0.006(0.007) | |
| 制度距离 | — | — | — | -0.058***(0.018) | -0.054***(0.018) | |
| 社会距离 | — | — | — | — | -0.004***(0.001) | |
| ln华人数量 | -0.005**(0.002) | -0.009***(0.002) | -0.008***(0.002) | -0.001(0.003) | -0.001(0.003) | |
| 美国影响力 | -0.255***(0.023) | -0.259***(0.023) | -0.260***(0.023) | -0.265***(0.023) | -0.273***(0.023) | |
| 看华语影视频率 (从不) | 很少 | 0.031***(0.008) | 0.030***(0.008) | 0.030***(0.008) | 0.031***(0.008) | 0.025***(0.009) |
| 频繁 | 0.056***(0.009) | 0.058***(0.009) | 0.059***(0.009) | 0.058***(0.009) | 0.050***(0.009) | |
| 华语音乐喜爱度 (不喜欢) | 一般 | 0.041***(0.009) | 0.035***(0.010) | 0.033***(0.010) | 0.031***(0.010) | 0.026***(0.009) |
| 喜欢 | 0.056***(0.009) | 0.052***(0.009) | 0.052***(0.009) | 0.049***(0.009) | 0.043***(0.009) | |
| 是否通过本国的电视了解中国 | -0.002(0.006) | -0.005(0.006) | -0.005(0.006) | -0.006(0.006) | -0.005(0.006) | |
| 是否通过本国的网络了解中国 | 0.024***(0.007) | 0.018**(0.007) | 0.017**(0.007) | 0.012(0.007) | 0.010(0.007) | |
| 是否通过本国的报刊杂志了解中国 | 0.006(0.008) | 0.007(0.008) | 0.007(0.008) | 0.008(0.008) | 0.008(0.008) | |
| 是否通过中国的传统媒体了解中国 | -0.005(0.008) | -0.005(0.008) | -0.005(0.008) | -0.004(0.008) | -0.004(0.008) | |
| 是否通过中国的新媒体了解中国 | 0.039***(0.007) | 0.039***(0.007) | 0.040***(0.007) | 0.037***(0.007) | 0.036***(0.007) | |
| 性别(女) | 0.018***(0.006) | 0.020***(0.006) | 0.020***(0.006) | 0.019***(0.006) | 0.017***(0.006) | |
| 年龄 | 0.008***(0.002) | 0.007***(0.002) | 0.007***(0.002) | 0.006***(0.002) | 0.006***(0.002) | |
| 年龄的平方 | -0.000***(0.000) | -0.000***(0.000) | -0.000**(0.000) | -0.000**(0.000) | -0.000**(0.000) | |
| 婚姻(不在婚) | 0.003(0.006) | 0.007(0.006) | 0.007(0.006) | 0.006(0.006) | 0.006(0.006) | |
| 受教育程度 (小学及以下) | 初中及高中 | 0.013(0.014) | 0.007(0.014) | 0.010(0.014) | 0.014(0.014) | 0.009(0.014) |
| 大专及以上 | 0.041***(0.015) | 0.037***(0.015) | 0.041***(0.014) | 0.046***(0.015) | 0.039***(0.015) | |
| 月收入 | 0.012***(0.003) | 0.006(0.004) | 0.006*(0.004) | 0.006*(0.004) | 0.007*(0.004) | |
| 宗教信仰 (无宗教信仰) | 佛教 | -0.010(0.008) | -0.015*(0.008) | -0.037***(0.013) | -0.010(0.014) | -0.007(0.014) |
| 基督教类 | -0.042***(0.011) | -0.048***(0.011) | -0.053***(0.012) | -0.013(0.017) | -0.014(0.017) | |
| 伊斯兰教 | -0.051***(0.014) | -0.072***(0.014) | -0.073***(0.014) | -0.036**(0.017) | -0.031*(0.017) | |
| 其他 | -0.017(0.016) | -0.032*(0.017) | -0.046**(0.018) | -0.018(0.019) | -0.013(0.019) | |
| 截距 | -0.145(0.149) | -0.033(0.153) | -0.231(0.210) | -0.203(0.187) | -0.109(0.174) | |
| N | 4 596 | 4 596 | 4 596 | 4 596 | 4 596 | |
| R 2 | 0.168 | 0.175 | 0.176 | 0.180 | 0.187 | |
|
表4 多维距离对中国影响力评价的收入异质性分析结果Table 4 Income heterogeneity analysis results of multidimensional distances on the evaluation of China's influence |
| 解释变量 | 模型6:收入异质性 | ||||
|---|---|---|---|---|---|
| 地理距离 | 0.425***(0.144) | — | — | — | — |
| 地理距离✕收入 | -0.041***(0.017) | — | — | — | — |
| 经济距离 | — | -0.205***(0.063) | — | — | — |
| 经济距离✕收入 | — | 0.017***(0.006) | — | — | — |
| 文化距离 | — | — | -0.015(0.043) | — | — |
| 文化距离✕收入 | — | — | 0.004(0.005) | — | — |
| 制度距离 | — | — | — | -0.112*(0.067) | — |
| 制度距离✕收入 | — | — | — | 0.004(0.008) | — |
| 社会距离 | — | — | — | — | -0.019***(0.004) |
| 社会距离✕收入 | — | — | — | — | 0.002***(0.000) |
| 国家层面控制变量 | 控制 | 控制 | 控制 | 控制 | 控制 |
| 个体层面控制变量 | 控制 | 控制 | 控制 | 控制 | 控制 |
| 截距 | -2.977***(1.193) | 0.812***(0.093) | 0.536***(0.122) | 0.423***(0.062) | 0.526***(0.051) |
| N | 4 596 | 4 596 | 4 596 | 4 596 | 4 596 |
| R 2 | 0.170 | 0.172 | 0.166 | 0.172 | 0.176 |
表5 多维距离对中国影响力评价的美国影响力异质性分析结果Table 5 USA's influence heterogeneity analysis results of multidimensional distances on the evaluation of China's influence |
| 解释变量 | 模型7:美国影响力异质性 | ||||
|---|---|---|---|---|---|
| 地理距离 | 0.085(0.060) | — | — | — | — |
| 地理距离✕美国影响力 | -0.013(0.117) | — | — | — | — |
| 经济距离 | — | -0.099***(0.023) | — | — | — |
| 经济距离✕美国影响力 | — | 0.125***(0.048) | — | — | — |
| 文化距离 | — | — | -0.010(0.014) | — | — |
| 文化距离✕美国影响力 | — | — | 0.065**(0.025) | — | — |
| 制度距离 | — | — | — | -0.016(0.033) | — |
| 制度距离✕美国影响力 | — | — | — | -0.149**(0.058) | — |
| 社会距离 | — | — | — | — | -0.010***(0.002) |
| 社会距离✕美国得分 | — | — | — | — | 0.014***(0.004) |
| 国家层面控制变量 | 控制 | 控制 | 控制 | 控制 | 控制 |
| 个体层面控制变量 | 控制 | 控制 | 控制 | 控制 | 控制 |
| 截距 | -0.189(0.485) | 0.698***(0.063) | 0.536***(0.060) | 0.381***(0.055) | 0.525***(0.050) |
| N | 4 596 | 4 596 | 4 596 | 4 596 | 4 596 |
| R 2 | 0.168 | 0.172 | 0.168 | 0.175 | 0.177 |
表6 多维距离对中国影响力评价的分位数分析结果Table 6 Quantile regression results of multidimensional distances on the evaluation of China's influence |
| 解释变量 | 模型8:分位数回归 | |||
|---|---|---|---|---|
| q25 | q50 | q75 | q90 | |
| 地理距离 | 0.117***(0.030) | 0.081***(0.023) | 0.042**(0.019) | 0.033**(0.016) |
| 经济距离 | -0.044***(0.017) | -0.024**(0.010) | -0.018**(0.008) | 0.006(0.009) |
| 文化距离 | 0.005(0.010) | 0.009(0.007) | 0.009(0.006) | 0.016***(0.005) |
| 制度距离 | -0.045**(0.022) | -0.070***(0.013) | -0.057***(0.012) | -0.057***(0.013) |
| 社会距离 | -0.007***(0.002) | -0.006***(0.001) | -0.003**(0.001) | -0.002**(0.001) |
| 国家层面控制变量 | 控制 | 控制 | 控制 | 控制 |
| 个体层面控制变量 | 控制 | 控制 | 控制 | 控制 |
| 截距 | -0.480*(0.259) | -0.064(0.194) | 0.407**(0.164) | 0.473***(0.142) |
| N | 4 596 | 4 596 | 4 596 | 4 596 |
| Pseudo R 2 | 0.145 | 0.134 | 0.083 | 0.054 |
表7 多维距离对中国影响力评价的稳健性检验结果Table 7 The robustness test results of multidimensional distances on the evaluation of China's influence |
| 解释变量 | 模型9 | 模型10 | 模型11 | 模型12 | 模型13 | 模型14 |
|---|---|---|---|---|---|---|
| 地理距离 | 0.003***(0.001) | 0.003***(0.001) | 0.004***(0.001) | 0.004***(0.001) | 0.004***(0.001) | 0.077***(0.020) |
| 经济距离 | — | -0.052***(0.012) | -0.056***(0.012) | -0.032***(0.012) | -0.024*(0.012) | -0.030***(0.010) |
| 文化距离 | — | — | -0.005**(0.002) | 0.000(0.002) | 0.001(0.002) | 0.004(0.007) |
| 制度距离 | — | — | — | -0.093***(0.030) | -0.093***(0.030) | -0.072***(0.016) |
| 社会距离(短距离) | — | — | — | — | — | -0.005***(0.001) |
| 中距离 | — | — | — | — | -0.042***(0.011) | — |
| 长距离 | — | — | — | — | -0.082***(0.019) | — |
| 国家层面控制变量 | 控制 | 控制 | 控制 | 控制 | 控制 | 控制 |
| 个体层面控制变量 | 控制 | 控制 | 控制 | 控制 | 控制 | 控制 |
| 截距 | 0.468***(0.053) | 0.666***(0.067) | 0.731***(0.074) | 0.574***(0.084) | 0.589***(0.083) | 0.093(0.193) |
| N | 4 596 | 4 596 | 4 596 | 4 596 | 4 596 | 4 596 |
| R 2 | 0.166 | 0.173 | 0.175 | 0.178 | 0.187 | 0.118 |
| 第一段F值 | — | — | — | — | — | 22.513 |
| 工具变量1:是否有美国驻军 | — | — | — | — | — | 0.069***(0.011) |
| 工具变量2:是否与美国发生过战争 | — | — | — | — | — | 0.115***(0.021) |
| 过度识别检验Chi2 | — | — | — | — | — | 0.082 |
| DWH检验Chi2 | — | — | — | — | — | 3.728* |

1 数据来源:中国人民共和国商务部. http://asean.mofcom.gov.cn/article/jmxw/202301/20230103379195.shtml。
2 “亚洲风向调查”是一项由中国台湾中央研究院政治学研究所与台湾大学人文社科高等研究院共同主持的大型跨国调查研究项目,由胡佛和朱云汉于2000年创立,分别于2005—2008、2010—2012、2014—2016和2018—2020年完成第二波至第五波调查,该数据是研究国家形象议题最具代表性和完整性的民意调查数据之一。
3 考虑到数据的可比性,中国和东南亚各国的人均GDP数据均来自世界银行国民经济核算数据,详细数据信息可访问https://data.worldbank.org.cn/indicator/NY.GDP.PCAP.KD?view=chart。
4 文化维度指数来自Hofstede公布的2015年各国数据,缺失国家的数据根据邻国数据加权平均得到,详细信息可访问https://geert-hofstede.com。
5 东南亚各国与中国的建交年份数据来源:中国外交部. https://www.mfa.gov.cn/。
6 东南亚各国与中国制度得分来自政体指数数据,详细数据信息可访问https://www.systemicpeace.org/inscrdata.html。
7 人均国民总收入数据来源:世界银行. https://data.worldbank.org.cn/indicator/NY.GNP.PCAP.KD。
8 文化距离数据来源:宾夕法尼亚大学沃顿商学院Berry教授团队. http://www.management.wharton.upenn.edu/guillen/Distance_Data_Downloads.htm。
9 制度距离数据来源:民主多样性研究所. https://www.v-dem.net/about/v-dem-project/。
黄小丽:提出研究设想,数据分析与建模,论文撰写修改;
许庆红:确定研究主题,论文撰写修改;
应 奎:数据分析与制图;
丁金宏:论文撰写修改。
|
鲍志鹏,金灿荣. 2020. 中美在东南亚六国的影响力竞争分析:基于受众视角的跨国比较. 国际论坛,22(1):84-103.
Bao Zhipeng and Jin Canrong. 2020. Competition of National Influence between China and the United States in Six Southeast Asian States: An Audience-Based Transnational Comparison. International Forum, 22(1): 84-103.
|
|
Boulding K E. 1959. National Images and International Systems. The Journal of Conflict Resolution, 3(2): 120-131.
|
|
车冰清,朱传耿. 2019. 改革开放以来中国国际影响力的提升及其空间拓展机制. 人文地理,34(5):109-116.
Che Bingqing and Zhu Chuangeng. 2019. Analysis of China's International Influence and Its Spatial Expansion since the Reform and Opening-up Policy. Human Geography, 34(5): 109-116.
|
|
Fan Y. 2008. Soft Power: Power of attraction or confusion? Place Branding and Public Diplomacy, 4(2): 147-158.
|
|
郝亚明. 2015.西方群际接触理论研究及启示. 民族研究,(3):13-24.
Hao Yaming. 2015. The Western Intergroup Contact Theory and Its Revelation. Ethno-National Studies, (3): 13-24.
|
|
Herrmann R K, Voss J F, Tonya Y E S, and Ciarrochi J. 1997. Images in International Relations: An Experimental Test of Cognitive Schemata. International Studies Quarterly, 41(3): 403-433.
|
|
Holsti O R. 1962. The Belief System and National Images: A Case Study. The Journal of Conflict Resolution, 6(3): 244-252.
|
|
吉生保,李书慧,马淑娟. 2018. 中国对“一带一路”国家OFDI的多维距离影响研究. 世界经济研究,(1):98-111.
Ji Shengbao, Li Shuhui, and Ma Shujuan. 2018. Study of Multi-Dimensional Distances' Effects on China's OFDI in "the Belt and Road" Countries. World Economy Studies, (1): 98-111.
|
|
鞠海龙,蒋琛娴. 2022. 南海周边国家民众对中国影响力的认知因素研究. 东南亚研究,(1):64-85.
Ju Hailong and Jiang Chenxian. 2022. A Study on the Factors of Public Perception of China's Influence in the Countries Surrounding the South China Sea. Southeast Asian Studies, (1): 64-85.
|
|
Kogut B and Singh H. 1988. The Effect of National Culture on the Choice of Entry Mode. Journal of International Business Studies, 19(3): 22.
|
|
孔建勋,赵姝岚. 2013. 大国在泰国的国家形象:基于亚洲民主动态调查的跨国比较. 华侨大学学报(哲学社会科学版),(2):15-23.
Kong Jianxun and Zhao Shulan. 2013. The National Image of Big Power in Contemporary Thailand: A Cross-Country Comparative Analysis. Journal of Huaqiao University (Philosophy & Social Sciences), (2): 15-23.
|
|
李文宇,刘洪铎. 2016. 多维距离视角下的“一带一路”构建——空间、经济、文化与制度. 国际经贸探索,32(6):99-112.
Li Wenyu and Liu Hongduo. 2016. The Construction of One Belt One Road from the Perspective of Multi-dimension: Space, Economy, Culture and Institution. International Economics and Trade Research, 32(6): 99-112.
|
|
刘晓凤,葛岳静,赵亚博. 2017. 国家距离与中国企业在“一带一路”投资区位选择. 经济地理,37(11):99-108.
Liu Xiaofeng, Ge Yuejing, and Zhao Yabo. 2017. National Distance and Chinese Companies' Choice of Location along the Belt and Road. Economic Geography, 37(11): 99-108.
|
|
罗伯特·基欧汉美,约瑟夫·奈. 2012. 权力与相互依赖. 北京:北京大学出版社. [Keohane Robert and Nye Joseph. 2012. Power and Interdependence. Beijing: Peking University Press. ]
|
|
吕延方,王冬. 2017. “一带一路”有效实施:经济规模、地理与文化距离. 经济学动态,(4):30-40.
Lu Yanfang and Wang Dong. 2017. Effective Implementation of the Belt and Road Initiative: Economic Scale, Geographical and Cultural Distance. Economic Perspectives, (4): 30-40.
|
|
庞琴,梁意颖,潘俊豪. 2017. 中国的经济影响与东亚国家民众对华评价——经济受惠度与发展主义的调节效应分析. 世界经济与政治,(2):130-154.
Pang Qin, Liang Yiying, and Pan Junhao. 2017. China's Overseas Economic Engagement and East Asian Public Attitudes Towards China: An Analysis Based on the Moderating Effect of "Perception of Economic Improvement" and "Developmentalism". World Economics and Politics, (2): 130-154.
|
|
彭飞,李淑琴. 2022. 基于事件数据的南海周边主要国家地缘关系演化分析. 热带地理,42(7):1061-1072.
Peng Fei and Li Shuqin. 2022. Evolution of the Geo-Relations between Major Countries around the South China Sea Based on Event Data Analysis. Tropical Geography, 42(7): 1061-1072.
|
|
綦建红,杨丽. 2012. 中国OFDI的区位决定因素——基于地理距离与文化距离的检验. 经济地理,32(12):40-46.
Qi Jianhong and Yang Li. 2012. Determinants of Chinese OFDI Location: Based on the Geographical Distance and Cultural Distance Test. Economic Geography, 32(12): 40-46.
|
|
Scott W A. 1965. Psychological and Social Correlates of International Images. International Behavior: A Socio Psychological Analysis. New York: Holt, Rinehart&Winston.
|
|
Shambaugh D L. 2014. The Illusion of Chinese Power. National Interest, 132: 39-48.
|
|
万伦来,高翔. 2014. 文化、地理与制度三重距离对中国进出口贸易的影响——来自32个国家和地区进出口贸易的经验数据. 国际经贸探索,30(5):39-48.
Wan Lunlai and Gao Xiang. 2014. The Influence of Cultural, Geographical and Institutional Distance on China's Import and Export Trade: An Empirical Test of the Trade Data with 32 Countries or Regions. International Economics and Trade Research, 30(5): 39-48.
|
|
王玲宁,李靓,陈俊卿. 2022. 亚非拉民众中国国家形象生成的影响因素研究——基于三个晴雨表的实证分析.新闻大学,(5):61-70.
Wang Lingning, Li Jing, and Chen Junqing. 2022. Influencing Factors of the Generation of China's National Image among Asian, African and Latin American People: An Empirical Analysis of Three Barometers. Journalism Research, (5): 61-70.
|
|
王庆喜,徐维祥. 2014. 多维距离下中国省际贸易空间面板互动模型分析. 中国工业经济,(3):31-43.
Wang Qingxi and Xu Weixiang. 2014. A Research on Chinese Inter-Provincial Trade Based on Spatial Panel Interaction Model under Multi-Dimensional Distances. China Industrial Economics, (3): 31-43.
|
|
王淑芳,葛岳静,刘玉立. 2015. 中美在南亚地缘影响力的时空演变及机制. 地理学报,70(6):864-878.
Wang Shufang, Ge Yuejing, and Liu Yuli. 2015. The Spatio-Temporal Evolution and Driving Mechanism of Geopolitical Influence of China and the US in South Asia. Acta Geographica Sinica, 70(6): 864-878.
|
|
王震. 2019. 制衡中国?——中美日印在缅甸影响力变迁分析(2010-2018). 南亚研究,(2):19-38.
Wang Zhen. 2019. Balancing China? An Assessment of the Fluctuating Influence of China, America, Japan and Indian Myanmar (2010-2018). South Asian Studies, (2): 19-38.
|
|
武铁传. 2009. 论软实力与硬实力的辩证关系及意义. 理论导刊,(5):23-25.
Wu Tiechuan. 2009.The Dialectical Relationship and Significance of Hard Power and Soft Power. Theory Guide, (5): 23-25.
|
|
席金瑞. 2019. 中国在东南亚影响力的民意调查分析. 东南亚研究,(3):137-153.
Xi Jinrui. 2019. A Public Opinion on China's Influence in Southeast Asia. Southeast Asian Studies, (3): 137-153.
|
|
夏梦真,郝雨凡. 2022. 越南民众眼中的中美国家形象认知——基于建构主义视角的分析. 学术研究,(7):52-59.
Xia Mengzhen and Hao Yufan. 2022. The Cognition of National Images of China and USA in the Eyes of Vietnamese People: From the Perspective of Constructivism. Academic Research, (7): 52-59.
|
|
熊琛然,彭邦文,王礼茂. 2020. 中美日印对中南半岛国家影响力的测度与分析. 南亚研究,(1):101-124.
Xiong Chenran, Peng Bangwen, and Wang Limao. 2020. Influence on the Indo-China Peninsula: A Comparison of China, the US, Japan and India. South Asian Studies, (1): 101-124.
|
|
徐晏卓. 2017. 变动中的亚洲秩序与中国影响力分析. 上海交通大学学报(哲学社会科学版),25(3):34-43.
Xu Yanzhuo. 2017. An Analysis of the Changing Asian Order and China's Influence. Journal of Shanghai Jiao Tong University (Philosophy and Social Sciences), 25(3): 34-43.
|
|
阎学通. 2016. 政治领导与大国崛起安全. 国际安全研究,34(4):3-19.
Yan Xuetong. 2016. Moral Realism and the Security Strategy for Rising China. Journal of International Security Studies, 34(4): 3-19.
|
|
杨勇,梁辰,胡渊. 2018. 文化距离对中国对外直接投资企业经营绩效影响研究——基于制造业上市公司微观数据的实证分析. 国际贸易问题,(6):27-40.
Yang Yong, Liang Chen, and Hu Yuan. 2018. Effects of Cultural Gap on Chinese OFDI Companies' Performance: An Empirical Analysis Based on Micro Data from Listed Manufacturing Companies. Journal of International Trade, (6): 27-40.
|
|
余红,黄诚. 2021. 大国博弈:国家形象认知差异、影响因素与提升路径——基于中美民众对中国国家形象认知的比较分析. 湖北社会科学,(6):150-161.
Yu Hong and Huang Cheng. 2021. Superpower Games: Differences in National Image Cognition, Influencing Factors and Improving Paths: Based on the Comparative Analysis on Chinese and American People's Cognition of China's State Image. Hubei Social Sciences, (6): 150-161.
|
|
张萌萌,杨雪冬. 2022. 测量抑或规训:对政治评估指数的评估. 社会科学,(11):113-128.
Zhang Mengmeng and Yang Xuedong. 2022. Measurement or Discipline: Reassessment of the Political Indicators. Journal of Social Sciences, (11): 113-128.
|
|
周方银. 2012. 中国崛起、东亚格局变迁与东亚秩序的发展方向.当代亚太,(5):4-32.
Zhou Fangyin. 2012. China's Rise, the Transformation of East Asian Structure and Directions for the Development of the East Asian Order. Journal of Contemporary Asia-Pacific Studies, (5): 4-32.
|
|
朱云汉,肖唐镖,黄旻华. 2018. 中美两国在东亚区域的影响力——受众视角的实证分析. 政治学研究,(3):39-50.
Zhu Yunhan, Xiao Tangbiao, and Huang Minhua. 2018. Co-Opetition and the Influence of China and the United States in East Asia: An Empirical Analysis from the Receiver's Perspective. CASS Journal of Political Science, (3): 39-50.
|
|
祝继高,王谊,汤谷良. 2019.“一带一路”倡议下中央企业履行社会责任研究——基于战略性社会责任和反应性社会责任的视角. 中国工业经济,(9):174-192.
Zhu Jigao, Wang Yi, and Tang Guliang. 2019. An Analysis of Corporate Social Responsibility of Central Enterprises under the One Belt One Road Initiative: A Case Study from the Perspective of Strategic and Responsive Social Responsibility. China Industrial Economics, (9): 174-192.
|
/
| 〈 |
|
〉 |