
基于C-Vine Copula函数的台风灾害链“风-雨-潮”联合概率分布研究
|
周子滢(1999—),女,江苏苏州人,硕士研究生,主要研究方向为沿海灾害风险评估,(E-mail)ziyingzhou@mail.bnu.edu.cn; |
收稿日期: 2023-11-30
修回日期: 2024-01-24
网络出版日期: 2024-06-13
基金资助
浙江科技厅领雁项目(2022C03107)
Joint Probability Distribution of Typhoon Disaster Chain "Strong Wind-Rainstorm- Storm Surge" Based on C-Vine Copula Function
Received date: 2023-11-30
Revised date: 2024-01-24
Online published: 2024-06-13
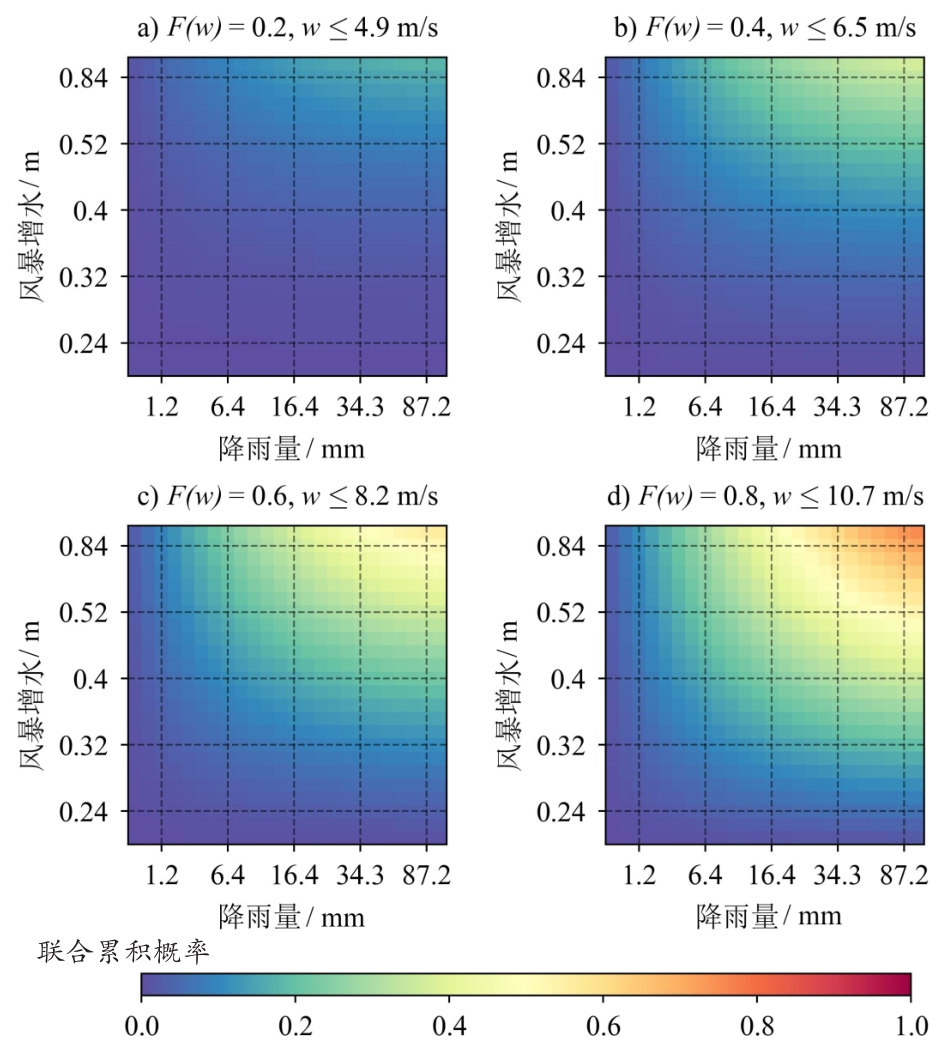
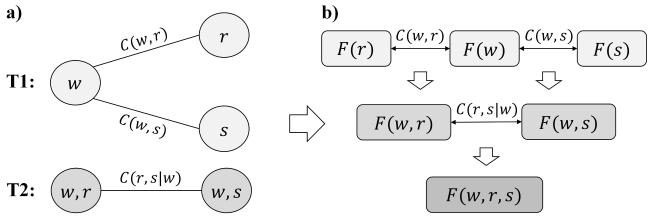
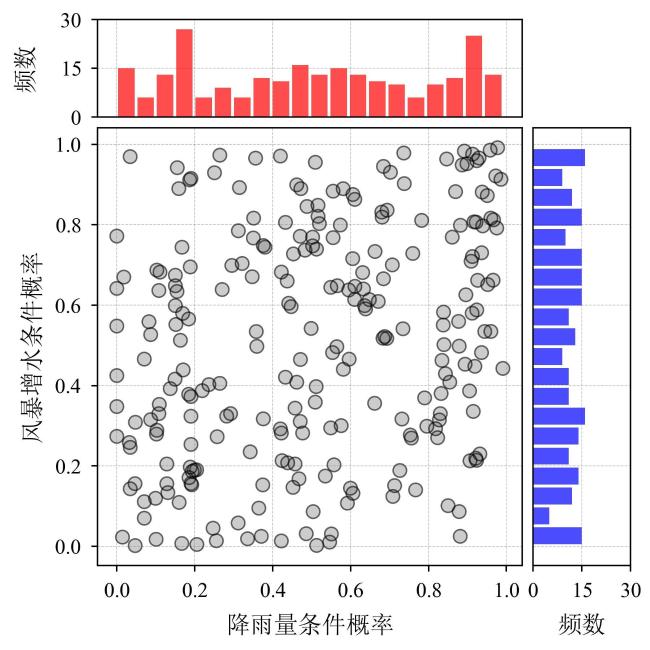
现有台风灾害链研究大多采用高维对称Copula模型建立多个致灾因子的联合分布,对致灾因子之间非线性、非对称的复杂关联结构探究不足。文章以浙江岛屿城市舟山为例,通过C-Vine Copula函数刻画当地台风灾害链“风-雨-潮”之间的复杂依赖关系,利用1979—2018年逐日的最大持续风速、累积降雨量以及最大风暴增水数据估算三者的联合概率分布以及重现期。研究表明:1)风速与降雨量在常规数值区间(非极端情况)具有较强的相关性,最佳联合分布为Frank Copula;风速与风暴增水具有上尾依赖的特征,最佳联合分布为Gumbel Copula;2)降雨量分布在风速条件下显示2处峰值,风暴增水分布在风速条件下近似于均匀,两者之间的最佳联合分布为Gumbel Copula;3)以单变量100 a重现期为例,风速-降雨量与风速-风暴增水组合事件的二维联合重现期分别缩短至29和30 a,而风速-降雨量-风暴增水组合事件的三维联合重现期缩短至17 a。综上,C-Vine Copula函数能准确有效地刻画台风灾害链“风-雨-潮”之间的复杂依赖关系,深化对于台风灾害链内在作用机制的理解,为台风灾害风险管理和工程设计提供科学支持。
周子滢 , 杨赛霓 , 刘晓燕 , 唐继婷 , 石永国 . 基于C-Vine Copula函数的台风灾害链“风-雨-潮”联合概率分布研究[J]. 热带地理, 2024 , 44(6) : 1036 -1046 . DOI: 10.13284/j.cnki.rddl.20230928
Typhoons and their associated disaster chains pose serious threats to the lives and property of coastal residents, and they remain a focal point for research and response. Previous studies on typhoon disaster chains often employed high-dimensional symmetric Copula models to establish the joint distribution of multiple hazard factors, however they failed to explore the complex nonlinear and asymmetric dependencies among them. This study aimed to depict these complex relationships more comprehensively and efficiently to provide a more accurate typhoon hazard assessment. Focusing on Zhoushan, a city comprising numerous islands in Zhejiang Province that faces multiple typhoon threats, this study employed the C-Vine Copula function to model the complex dependencies among "strong wind-rainstorm-storm surge" in the typhoon disaster chain. Utilizing observational data from 1979 to 2018, this study involves three main steps: first, fitting the marginal distribution of each hazard factor and identifying the best one from Lognormal, Gamma, GEV (Generalized Extreme Value), and Burr functions based on the K-S test; second, fitting the bivariate joint distributions of wind speed-rainfall and wind speed-storm surge using Gaussian, Clayton, Gumbel, Frank, and Joe Copula functions, and determining the best fit based on the AIC (Akaike Information Criterion); and finally, estimating the trivariate joint probability distribution and corresponding return periods for wind speed-rainfall-storm surge using the C-Vine Copula function. This revealed (1) a strong correlation between wind speed and rainfall observed within regular value ranges (non-extreme conditions), were best represented by the Frank Copula, In addition, wind speed and storm surge exhibit an upper-tail dependence, best captured by the Gumbel Copula. (2) The rainfall distribution under certain wind speed conditions revealed dual peaks, whereas the storm surge distribution maintained a uniform pattern, with the best joint distribution fitting the Gumbel Copula. (3) Considering a 100-year return period for individual variables, the bivariate return periods for wind speed-rainfall and wind speed-storm surge events were significantly reduced to 29 and 30 years, respectively, while the trivariate return period for the wind speed-rainfall-storm surge combination was further reduced to 17 years. Overall, the C-Vine Copula function effectively characterizes the complex nonlinear and asymmetric dependencies among the typhoon disaster chain "strong wind-rainstorm-storm surge", reducing high-dimensional parameter estimation complexity. This method provides new insights for constructing joint probability and return period models for multiple hazard factors and offers a scientific basis for disaster risk assessment and management strategies. Therefore, this enhances the accuracy of disaster prevention and mitigation efforts. Additionally, the application of the C-Vine Copula assists to deeply understand the mechanisms and development processes of natural disasters, providing new tools for on-site emergency response and decision-making.
表1 基本数据说明Table 1 Basic data description |
| 站点 | 编号 | 经度(°E) | 纬度(°N) | 数据来源 | 要素 | 时间分辨率 | 时间范围 |
|---|---|---|---|---|---|---|---|
| 气象站 | 584770 | 122.117 | 30.033 | 全球逐日气象站点数据集GSOD | 最大持续风速 | 逐日 | 1956年至今 |
| 累积降雨量(24 h) | |||||||
| 潮位站 | 16461 | 122.183 | 30.103 | 全球潮汐和风暴潮再分析数据集GTSR | 最大风暴增水 | 逐日 | 1979―2018年 |
表2 常用的二维Copula函数公式Table 2 Formulas of common two-dimensional Copula functions |
| 函数名称 | 累积概率分布公式 | 参数 范围 | 参数 与参数 的换算关系 |
|---|---|---|---|
| Gaussian | |||
| Clayton | |||
| Gumbel | |||
| Frank | |||
| Joe |
|
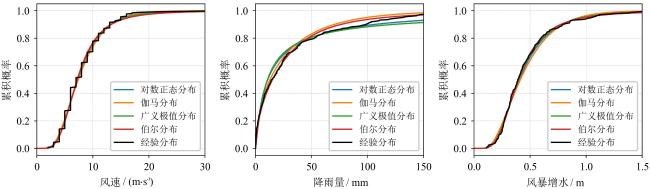
表3 风速、降雨量和风暴增水的边缘分布K-S检验Table 3 K-S test for the marginal distributions of wind speed, rainfall, and storm surge |
| 变量 | 对数正态分布 | 伽马分布 | 广义极值分布 | 伯尔分布 | |||||||
|---|---|---|---|---|---|---|---|---|---|---|---|
| D值 | P值 | D值 | P值 | D值 | P值 | D值 | P值 | ||||
| 风速/(m s-1) | 0.102 | 0.011 | 0.106 | 0.007 | 0.104 | 0.008 | 0.107 | 0.006 | |||
| 降雨量/mm | 0.082 | 0.065 | 0.058 | 0.366 | 0.093 | 0.025 | 0.043 | 0.721 | |||
| 风暴增水/m | 0.049 | 0.572 | 0.061 | 0.295 | 0.039 | 0.824 | 0.037 | 0.865 | |||
|
表4 风速、降雨量和风暴增水的最优边缘分布及其对应参数Table 4 Optimal marginal distributions for wind speed, rainfall, and storm surge and their corresponding parameters |
| 变量 | 边缘分布 | 参数值 |
|---|---|---|
| 风速( )/(m s-1) | ||
| 降雨量( )/mm | ||
| 风暴增水( )/m |
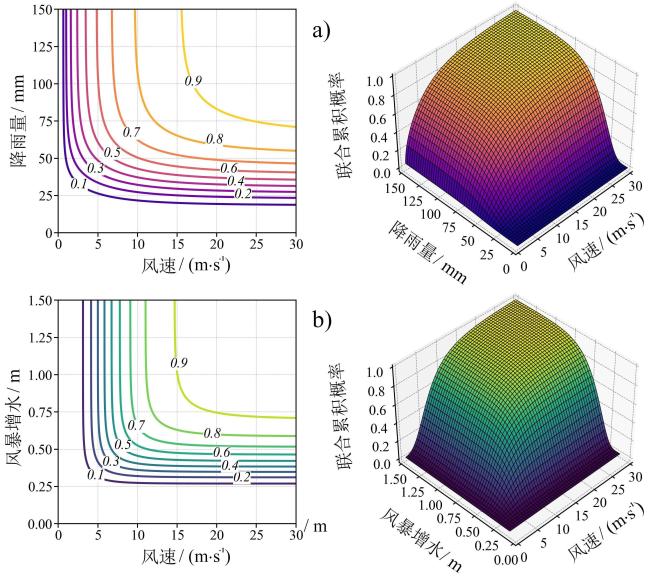
表5 风速-降雨量、风速-风暴增水二维联合分布Table 5 Two-dimensional joint distribution of wind speed-rainfall and wind speed-storm surge |
| Copula函数 | 风速-降雨量 | 风速-风暴增水 | ||||
|---|---|---|---|---|---|---|
| AIC | AIC | |||||
| Gaussian | 0.38 | 0.25 | -59.64 | 0.43 | 0.28 | -48.33 |
| Clayton | 0.10 | 0.05 | -14.90 | 0.36 | 0.15 | -15.53 |
| Gumbel | 1.15 | 0.13 | -18.42 | 1.38 | 0.28 | -54.23 |
| Frank | 3.45 | 0.34 | -71.95 | 2.78 | 0.29 | -47.66 |
| Joe | 1.06 | 0.03 | -5.09 | 1.58 | 0.25 | -53.43 |
|
表6 降雨量和风暴增水在风速条件下的二维联合分布Table 6 Two-dimensional joint distribution of rainfall and storm surge under wind speed conditions |
| Copula函数 | 降雨量-风暴增水 | ||
|---|---|---|---|
| AIC | |||
| Gaussian | 0.18 | 0.11 | -11.00 |
| Clayton | 0.02 | 0.01 | 1.27 |
| Gumbel | 1.19 | 0.16 | -17.68 |
| Frank | 1.65 | 0.18 | -17.52 |
| Joe | 1.29 | 0.14 | -16.85 |
|
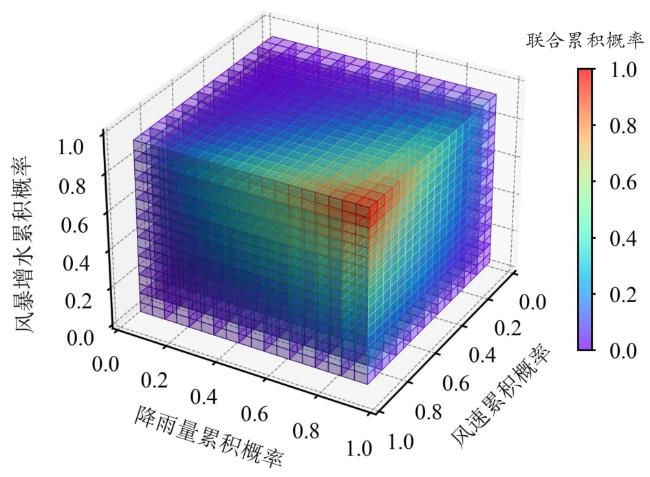
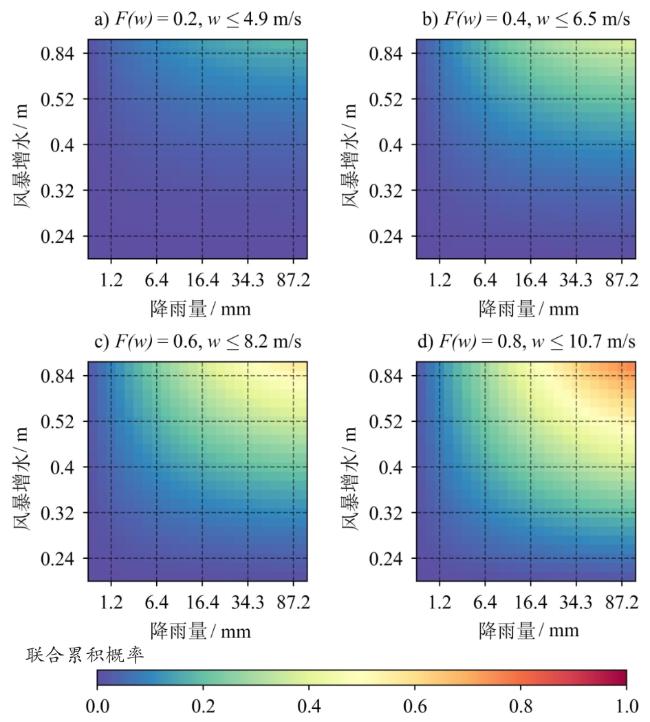
图5 风速-降雨量-风暴增水的联合累积概率分布Fig.5 Joint cumulative distribution of wind speed, rainfall, and storm surge |
表7 风速-降雨量-风暴增水单变量重现期、二维联合重现期及三维联合重现期Table 7 Univariate, two-dimensional, and three-dimensional return period of wind speed, rainfall, and storm surge |
| 重现期/a | 风速/(m s-1) | 降雨量/mm | 风暴 增水/m | 联合重现期/a | ||
|---|---|---|---|---|---|---|
| 5 | 11.08 | 50.29 | 0.62 | 1.73 | 2.09 | 1.2 |
| 10 | 12.51 | 67.2 | 0.72 | 3.17 | 3.87 | 2.13 |
| 20 | 13.84 | 85.1 | 0.82 | 6.19 | 7.75 | 4.19 |
| 50 | 15.66 | 114.1 | 0.98 | 16.18 | 19.31 | 10.07 |
| 100 | 16.76 | 134.76 | 1.09 | 28.74 | 29.67 | 17.14 |
表8 C-Vine Copula与三维对称Copula的比较Table 8 Comparison between C-Vine Copula and Three-Dimensional Symmetric Copula |
| Copula函数 | 参数值 | AIC值 | 对数似然函数值 |
|---|---|---|---|
| Gaussian | 0.354 | -117.696 | 59.848 |
| Clayton | 0.094 | -23.136 | 12.568 |
| Gumbel | 1.357 | -142.811 | 72.405 |
| Frank | 2.796 | -138.500 | 70.250 |
| Joe | 1.562 | -134.994 | 68.497 |
| C-Vine | — | -143.859 | 74.930 |
|

周子滢:完成整体研究设计和论文撰写;
杨赛霓:提供研究思路并指导论文撰写;
刘晓燕:参与数据收集处理与分析;
唐继婷:提供研究工具和方法;
石永国:帮助审阅和修订论文。
|
白晓宇. 2022. 近海风浪地震组合概率特性及跨海桥梁致灾机理与易损性评估方法. 北京:北京交通大学.
Bai Xiaoyu. 2022. Combination Probability Characteristic of Coastal Wind, Wave, and Earthquake and the Disaster-Causing Mechanism and Vulnerability Assessment Method of Sea-Crossing Bridge. Beijing: Beijing Jiaotong University.
|
|
Bedford T and Cooke R M. 2001. Probability Density Decomposition for Conditionally Dependent Random Variables Modeled by Vines. Annals of Mathematics and Artificial Intelligence, 32: 245-268.
|
|
Bedford T and Cooke R M. 2002. Vines-A New Graphical Model for Dependent Random Variables. The Annals of Statistics, 30(4): 1031-1068.
|
|
Bloemendaal N, De Moel H, Martinez A B, Muis S, Haigh I D, Van Der Wiel K, Haarsma R J, Ward P J, Roberts M J, Dullaart J C M, and Aerts J C J H. 2022. A Globally Consistent Local-Scale Assessment of Future Tropical Cyclone Risk. Science Advances, 8(17): eabm8438.
|
|
曹伟华,梁旭东,赵晗萍,段小刚,张自银. 2016. 基于Copula函数的北京强降水频率及危险性分析. 气象学报,74(5):772-783.
Cao Weihua, Liang Xudong, Zhao Hanping, Duan Xiaogang, and Zhang Ziyin. 2016. Copula Based Frequency Analysis and Its Application in Hazard Risk Assessment of Heavy Rainfall in Beijing. Acla Meteorologica Sinica, 74(5): 772-783.
|
|
曾文颖,徐明庆,宋松柏,吴昊昊. 2022. 基于R-Vine Copula函数的极端降水联合分布模型及风险识别. 水资源保护,38(6):96-103.
Zeng Wenying, Xu Mingqing, Song Songbai, and Wu Haohao. 2022. Joint Probability Distribution and Risk Identification of Extreme Precipitation Based on R-Vine Copula Function. Water Resources Protection, 38(6): 96-103.
|
|
何兵,高凡,唐小雨,覃姗. 2019. 基于滑动Copula函数的新疆干旱内陆河流水文气象要素变异关系诊断. 水土保持研究,26(1):155-161.
He Bing, Gao Fan, Tang Xiaoyu, and Qin Shan. 2019. Diagnosis of Variation of the Relationship between Hydrological and Meteorological Elements in Arid Inland Rivers of Xinjiang Based on the Sliding Copula Function. Research of Soil and Water Conservation, 26(1): 155-161.
|
|
贺芳芳,梁卓然,董广涛. 2021. 上海地区洪涝致灾因子复合概率及未来变化分析. 灾害学,36(2):9-13.
He Fangfang, Liang Zhuoran, and Dong Guangtao. 2021. Analysis on the Compound Probability and Future Change of Flood and Waterloging Disaster Factors in Shanghai. Journal of Calastrophology, 36(2): 9-13.
|
|
侯静惟,方伟华,程锰,叶妍婷,吴鹏,韩轶男. 2019. 基于Copula函数的海南热带气旋风雨联合概率特征分析. 自然灾害学报,28(3):54-64.
Hou Jingwei, Fang Weihua, Cheng Meng, Ye Yanting, Wu Peng, and Han Yinan. 2019. Joint Probability Analysis of Tropical Cyclone Wind and Rainfall for Integrated Hazard Severity Assessment in Hainan. Journal of Natural Disasters, 28(3): 54-64.
|
|
黄宇,张冰哲,庞慧珍,徐璟,刘磊,王彪. 2022. 基于混合Copula优化算法的风速预测方法研究. 太阳能学报,43(10):192-201.
Huang Yu, Zhang Bingzhe, Pang Huizhen, Xu Jing, Liu Lei, and Wang Biao. 2022. Research on Wind Speed Forecasting Method Based on Hybrid Copula Optimization Algorithm. Acta Energiae Solaris Sinica, 43(10): 192-201.
|
|
Jalili Pirani F and Najafi M R. 2022. Multivariate Analysis of Compound Flood Hazard Across Canada's Atlantic, Pacific and Great Lakes Coastal Areas. Earth's Future, 10(8): e2022EF002655.
|
|
刘青,王军,许瀚卿,牛怡莹,魏旭辰. 2022. 台风影响下沿海城市风雨复合灾害风险研究——以海口市为例. 灾害学,37(4):129-134.
Liu Qing, Wang Jun, Xu Hanqing, Niu Yiying, and Wei Xuchen. 2022. Research on the Risk of Joint Wind and Rain Hazards in Coastal Cities During Typhoons: A Case Study of Haikou City. Journal of Calastrophology, 37(4): 129-134.
|
|
卢韦伟,陈璐,周建中,陈华. 2015. 基于多元分布函数的区域洪水频率分析. 水文,35(5):6-10.
Lu Weiwei, Chen Lu, Zhou Jianzhong, and Chen Hua. 2015. Regional Flood Frequency Analysis Based on Multivariate Distribution Function. Journal of Hydrology, 35(5): 6-10.
|
|
Meiler S, Vogt T, Bloemendaal N, Ciullo A, Lee C Y, Camargo S J, Emanuel K, and Bresch D N. 2022. Intercomparison of Regional Loss Estimates from Global Synthetic Tropical Cyclone Models. Nature Communications, 13(1): 6156.
|
|
闵惠学,许波刘,陈金浩. 2023. 浙江省“2022·12”号台风潮雨洪等综合分析//《中国防汛抗旱》杂志社,水利部防洪抗旱减灾工程技术研究中心(水旱灾害防御中心). 2022—2023年度全国典型洪旱过程应对技术经验交流会论文集. 杭州:浙江省水文管理中心,90-94.
Min Huixue, Xu Boliu, and Chen Jinhao. 2023. Comprehensive Analysis of Typhoon, Storm Surge, and Floods in Zhejiang Province during "2022·12". In: China Flood and Drought Management, Research Center on Flood & Drought Disaster Prevention and Reduction of the Ministry of Water Resources. Proceedings of the National Symposium on Response Techniques and Experiences for Typical Flood and Drought Processes 2022-2023. Hangzhou: Zhejiang Provincial Hydrology Bureau, 90-94.
|
|
Muis S, Verlaan M, Winsemius H C, Aerts J C J H, and Ward P J. 2016. A Global Reanalysis of Storm Surges and Extreme Sea Levels. Nature Communications, 7(1): 11969.
|
|
Muis S, Apecechea M I, Dullaart J, De Lima Rego J, Madsen K S, Su J, Yan K, and Verlaan M. 2020. A High-Resolution Global Dataset of Extreme Sea Levels, Tides, and Storm Surges, Including Future Projections. Frontiers in Marine Science, 7: 263.
|
|
Shi X, Chen B, Liang Y, Zhang B, and Ye T. 2021. Inundation Simulation of Different Return Periods of Storm Surge Based on a Numerical Model and Observational Data. Stochastic Environmental Research and Risk Assessment, 35(10): 2093-2103. DOI:10.1007/s00477-021-02010-3.
|
|
Sklar M. 1959. Fonctions de Répartition à n Dimensions et Leurs Marges. Annales de l'Institut Statistique de l'Université de Paris, 8(3): 229-231.
|
|
Salvadori G, Durante F, De Michele C, Bernardi M, and Petrella L. 2016. A Multivariate Copula‐Based Framework for Dealing with Hazard Scenarios and Failure Probabilities. Water Resources Research, 52(5): 3701-3721.
|
|
宋松柏,王小军. 2018. 基于Copula函数的水文随机变量和概率分布计算. 水利学报,49(6):687-693.
Song Songbai and Wang Xiaojun. 2018. Probability Distribution Calculation of the Sum of Hydrological Random Variables Based on Copula Function Approach. Journal of Hydraulic Engineering, 49(6): 687-693.
|
|
Tang J, Hu F, Liu Y, Wang W, and Yang S. 2022. High-Resolution Hazard Assessment for Tropical Cyclone-Induced Wind and Precipitation: An Analytical Framework and Application. Sustainability, 14(21): 13969.
|
|
王静爱,雷永登,周洪建,尹衍雨,常晟,李群芳. 2012. 中国东南沿海台风灾害链区域规律与适应对策研究. 北京师范大学学报(社会科学版),1(2):130-138.
Wang Jing'ai, Lei Yongdeng, Zhou Hongjian, Yin Yanyu, Chang Sheng, and Li Qunfang. 2012. Regional Features and Adaptation Countermeasures of Typhoon Disaster Chains in Southeast Coastal Regions of China. Journal of Beijing Normal University(Social Sciences), 1(2): 130-138.
|
|
王然,连芳,余瀚,史培军,王静爱. 2016. 基于孕灾环境的全球台风灾害链分类与区域特征分析. 地理研究,35(5):836-850.
Wang Ran, Lian Fang, Yu Han, Shi Peijun, and Wang Jing'ai. 2016. Classification and Regional Features Analysis of Global Typhoon Disaster Chains Based on Hazard-Formative Environment. Geographical Research, 35(5): 836-850.
|
|
王灶平,刘桂平,龚政,张长宽. 2014. 考虑风、潮联合概率分布的海堤超越频率分析. 水利水电科技进展,34(6):18-22.
Wang Zaoping, Liu Guiping, Gong Zheng, and Zhang Changkuan. 2014. Exceeding Cumulative Probability Analysis of Seawall Considering the Joint Probability Distribution of Tide Level and Wind Speed. Advances in Science and Technology of Water Resources, 34(6): 18-22.
|
|
武传号,黄国如,吴思远. 2014. 基于Copula函数的广州市短历时暴雨与潮位组合风险分析. 水力发电学报,33(2):33-40.
Wu Chuanhao, Huang Guoru, and Wu Siyuan. 2014. Risk Analysis of Combinations of Short Duration Rainstorm and Tidal Level in Guangzhou Based on Copula Function. Journal of Hydroelectric Engineering, 33(2): 33-40.
|
|
许瀚卿,谭金凯,李梦雅,王军. 2022. 基于Copula函数的沿海城市雨潮复合灾害风险研究. 自然灾害学报,31(1):40-48.
Xu Hanqing, Tan Jinkai, Li Mengya, and Wang Jun. 2022. Compound Flood Risk of Rainfall and Storm Surge in Coastal Cities Based on Copula Formal. Journal of Natural Disasters, 31(1): 40-48.
|
|
许红师,练继建,宾零陵,徐奎. 2018. 台风灾害多元致灾因子联合分布研究. 地理科学,38(12):2118-2124.
Xu Hongshi, Lian Jijian, Bin Lingling, and Xu Kui. 2018. Joint Distribution of Multiple Typhoon Hazard Factors. Scientia Geographica Sinica, 38(12): 2118-2124.
|
|
Xu H, Xu K, Bin L, Lian J, and Ma C. 2018. Joint Risk of Rainfall and Storm Surges during Typhoons in a Coastal City of Haidian Island, China. International Journal of Environmental Research and Public Health, 15(7): 1377.
|
|
闫长城,刘耀辉. 2016. 基于风潮联合概率分布的海堤设防标准分析. 水利规划与设计,(10):20-22.
Yan Changcheng and Liu Yaohui. 2016. Analysis of Coastal Embankment Design Standards Based on Wind-Tide Joint Probability Distribution. Water Resources Planning and Design, (10): 20-22.
|
|
Yang X, and Qian J. 2019. Joint Occurrence Probability Analysis of Typhoon-Induced Storm Surges and Rainstorms Using Trivariate Archimedean Copulas. Ocean Engineering, 171: 533-539.
|
|
叶舟,顾文炜,陈芳. 2023. 舟山相关海域台风暴潮增水研究. 水运工程,(12):8-15,21.
Ye Zhou, Gu Wenwei, and Chen Fang. 2023. Study on the Typhoon Storm Surge Increase in the Waters around Zhoushan. Port & Waterway Engineering, (12): 8-15, 21.
|
|
于忱,陈隽,王红瑞,朱中凡,来文立. 2018. 多变量Copula函数在干旱风险分析中的应用进展. 南水北调与水利科技,16(1):14-21.
Yu Chen, Chen Jun, Wang Hongrui, Zhu Zhongfan, and Lai Wenli. 2018. Application Progress of Multi-Variate Copula Function in Drought Risk Analysis. South-to-North Water Transfers and Water Science & Technology, 16(1): 14-21.
|
|
张野,王康,刘欣铭,张苏辰,周嘉,王菜林. 2017. 基于Copula函数的暴雨要素三维联合分布——以宽甸县为例,地理科学,37(4):603-610.
Zhang Ye, Wang Kang, Liu Xinming, Zhang Suchen, Zhou Jia, and Wang Cailin. 2017. The Three-Dimensional Joint Distributions of Rainstorm Factors Based on Copula Function: A Case in Kuandian County, Liaoning Province. Scientia Geographica Sinica, 37(4): 603-610.
|
|
中国气象局. 2021. 中国气象灾害年鉴 (2020). 北京:气象出版社.
China Meteorological Administration. 2021. Yearbook of Meteorological Disasters in China (2020). Beijing: China Meteorological Press.
|
|
周晓,吴瑞雅,郭泽勇,梁巧倩,杨朝晖,李昭春. 2023. 基于C-Vine-Copula函数的暴雨致灾危险性联合分布研究. 气象与环境科学,46(5):104-111.
Zhou Xiao, Wu Ruiya, Guo Zeyong, Liang Qiaoqian, Yang Zhaohui, and Li Zhaochun. 2023. Study on the Joint Distribution of Rainstorm Disaster Risk Based on C-Vine-Copula Function. Meteorological and Environmental Sciences, 46(5): 104-111.
|
/
| 〈 |
|
〉 |