
舒适性视角下文化创意企业迁移特征与影响机制——以广州市为例
|
廖辉辉(1993—),男,湖南衡阳人,博士研究生,工程师,主要研究方向为城市与区域发展战略、产业发展研究,(E-mail)694739253@qq.com; |
收稿日期: 2024-03-24
修回日期: 2024-07-20
网络出版日期: 2025-03-14
基金资助
国家自然科学基金项目(42271181)
广东省重点领域研发计划项目(2020B0101130009)
广州市城市规划勘测设计研究院科技基金项目(RDI2230202097)
Characteristics and Influence Mechanism of Cultural and Creative Enterprise Migration from the Amenity Perspective: A Case Study of Guangzhou
Received date: 2024-03-24
Revised date: 2024-07-20
Online published: 2025-03-14
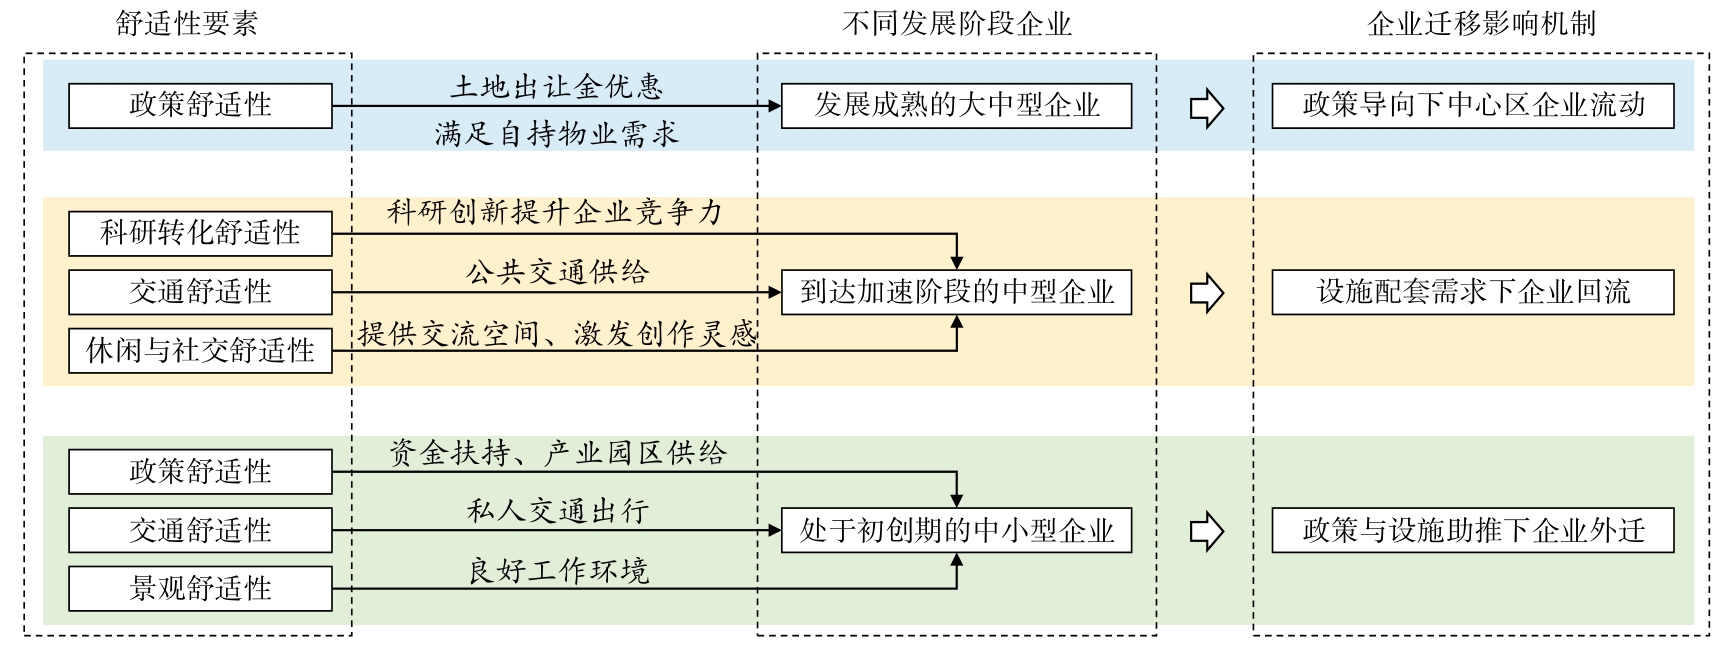
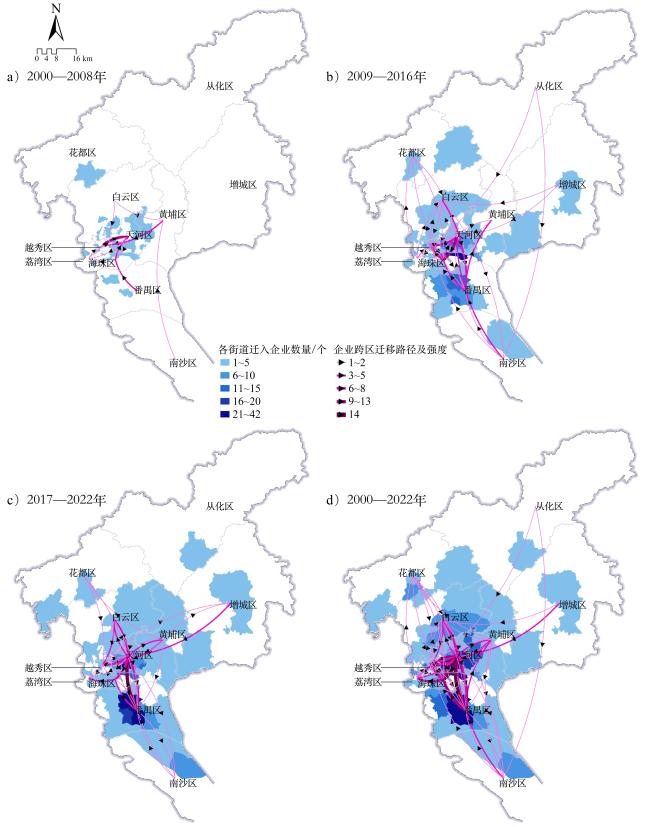
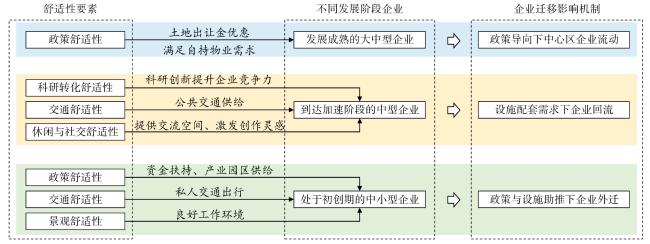
科创时代背景下,文化创意企业的空间分布演变格局趋于多元化,传统区域要素难以较好地解释其迁移机理,而舒适性理论为解读其迁移特征与机制提供新视角。基于企业微观主体,运用UCINET社会网络分析和地理探测器,从舒适性视角探究广州市文化创意企业迁移特征与影响机制。研究表明:1)有别于早期的文化创意企业主要向中心区集聚的演变模式,也不同于制造业企业主要由中心区向外围转移的单向迁移路径,文化创意企业呈现更为复杂的迁移网络关系。具体表现为城市中心区既是企业的主要迁入地,也是主要迁出地,迁出与迁入模式均以中心区为核心,分别呈均衡扩散和等级衰减,且不同类型企业的舒适性偏好和迁移特征趋于多样化。2)舒适性因子对于不同阶段和类型企业迁移的影响力具有异质性,其中休闲与社交场所、交通设施等因素影响力较为显著,景观舒适性因子的影响力相对较低。无论在国外还是国内,舒适性因子的适用均存在地域性。3)舒适性对于企业迁移的决策影响主要通过作用于企业本身和从业者2类主体实现,其影响机制可总结为政策导向下中心区企业流动、设施配套需求下企业回流、政策与设施助推下企业外迁3方面。最后,提出文化创意空间营造、文化创意产业发展、舒适性环境塑造等策略建议。
廖辉辉 , 魏成 , 罗鹏 , 沈静 . 舒适性视角下文化创意企业迁移特征与影响机制——以广州市为例[J]. 热带地理, 2025 , 45(3) : 460 -476 . DOI: 10.13284/j.cnki.rddl.20240171
In the context of science and technological innovation, the spatial distribution and evolutionary patterns of cultural and creative enterprises tend to diversify, and their migration characteristics and mechanisms also change. Although traditional regional factors are difficult to explain the migration characteristics and mechanisms of cultural and creative enterprises effectively, amenity theory provides a new perspective for interpreting these characteristics. However, there is still relatively little research on amenities in China, and most of it focuses on national and regional scales, emphasizing conceptual interpretation, indicator construction, and evaluation. Few scholars have focused on the correlation between amenities and the spatial agglomeration of cultural and creative industries, and there have been few quantitative studies on the interaction between amenities and the relocation of cultural and creative enterprises. This study is based on the micro subjects of enterprises using UCINET social network analysis and geographic detectors to explore the migration characteristics and impact mechanisms of cultural and creative enterprises in Guangzhou from an amenity perspective. Research has shown the following: (1) Unlike the early evolution pattern of cultural and creative enterprises mainly gathering in the central area, and also different from the one-way migration path of manufacturing enterprises mainly transferring from the central area to the periphery, cultural and creative enterprises present more complex migration network relationships. The specific manifestation is that the urban center is not only the main place for enterprises to move in, but also the main place for them to move out. Both the migration and relocation modes dominate the central area, showing balanced diffusion and hierarchical decay, and the amenity preferences and migration characteristics of different types of enterprises tend to be diversified. (2) The influence of amenity factors on the migration of enterprises at different stages and types is heterogeneous, with factors such as leisure, social places, and transportation facilities having significant impacts. In contrast, the influence of landscape amenity factors is relatively low. The applicability of amenity factors varies regionally, domestically, and internationally. (3) The impact of amenities on the decision-making process of enterprise migration is mainly achieved through two types of entities: the enterprise and practitioners. The impact mechanism can be summarized into three aspects: the flow of enterprises in the central area under policy guidance, the return of enterprises under demand for supporting facilities, and the outward migration of enterprises under the assistance of policies and facilities. Specifically, the migration of large and medium-sized enterprises within the central area is often driven by their own development considerations. For enterprises that relocate from peripheral urban areas to central areas, the demand for amenity facilities from employees has gradually become a concern. Small- and medium-sized enterprises that relocate from the central to peripheral urban areas have higher autonomy and local mobility among their employees, and are more sensitive to environmental and policy amenities. Finally, based on the migration characteristics and impact mechanisms of cultural and creative enterprises, this study proposes strategic recommendations for creating cultural and creative spaces, developing cultural and creative industries, and shaping these amenities. The main contribution of this study to the existing literature is the exploration of the spatiotemporal migration characteristics of cultural and creative enterprises in Guangzhou from the perspective of new urban economic theory and summarization and improvement of existing research on the construction of amenity index systems. This study systematically reveals the impact mechanism of cultural and creative enterprise migration. Enriching and improving theoretical research on the interaction between amenities and creative enterprises can provide decision-making support for the high-quality development of Guangzhou's cultural and creative industries, as well as a reference for the spatial allocation and management of cultural and creative industries in other regions of the country.
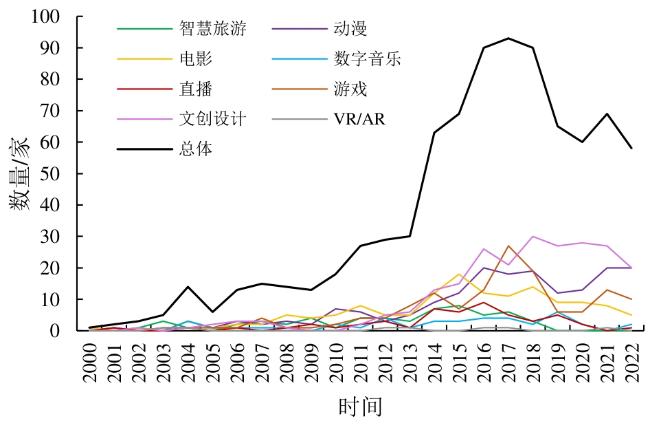
图3 2000—2022年广州市文化创意企业迁移数量变化情况Fig.3 Changes in the number of cultural and creative enterprises migrating in Guangzhou during 2000-2022 |
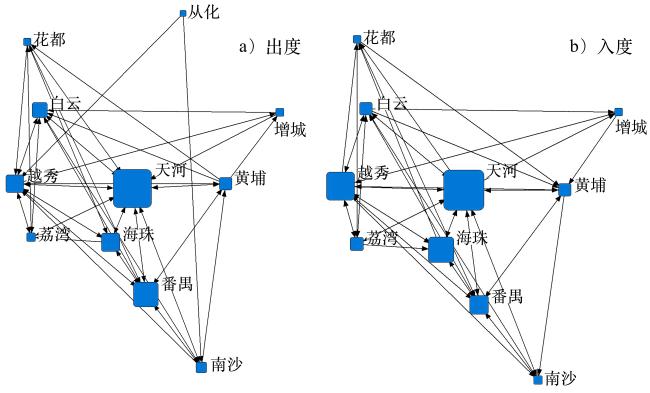
图5 文化创意企业出度与入度分析Fig.5 Analysis of the out-degree and in-degree of cultural and creative enterprises |
表1 各区域文化创意企业迁移总体情况Table 1 Overall migration of cultural and creative enterprises in various regions |
| 区域 | 迁出 数量/家 | 出度/% | 迁入 数量/家 | 入度/% | 净迁入数量/家 | 迁出 迁入比 | |
|---|---|---|---|---|---|---|---|
| 中 心 区 | 越秀区 | 23 | 11.11 | 40 | 19.32 | 17 | 0.58 |
| 荔湾区 | 8 | 3.86 | 14 | 6.76 | 6 | 0.57 | |
| 天河区 | 61 | 29.47 | 63 | 30.43 | 2 | 0.97 | |
| 海珠区 | 24 | 11.59 | 35 | 16.91 | 11 | 0.69 | |
| 合计 | 116 | 56.04 | 152 | 73.43 | 36 | 0.76 | |
| 近 郊 区 | 白云区 | 19 | 9.18 | 11 | 5.31 | -8 | 1.73 |
| 黄埔区 | 14 | 6.76 | 11 | 5.31 | -3 | 1.27 | |
| 番禺区 | 36 | 17.39 | 23 | 11.11 | -13 | 1.57 | |
| 合计 | 69 | 33.33 | 45 | 21.74 | -24 | 1.53 | |
| 远 郊 区 | 花都区 | 4 | 1.93 | 3 | 1.45 | -1 | 1.33 |
| 增城区 | 6 | 2.90 | 3 | 1.45 | -3 | 2.00 | |
| 南沙区 | 10 | 4.83 | 4 | 1.93 | -6 | 2.50 | |
| 从化区 | 2 | 0.97 | 0 | 0.00 | -2 | — | |
| 合计 | 22 | 10.63 | 10 | 4.83 | -12 | 2.20 | |
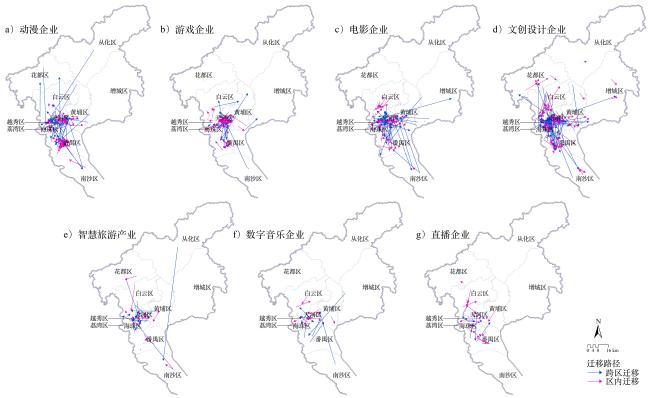
表2 各类型企业迁移情况Table 2 Migration of various types of enterprises |
| 企业类型 | 企业类别 | 总企业 数量/家 | 发生迁移 企业数量/家 | 迁移发生 率/% | 迁移企业当中小型、 微型企业占比/% | 平均迁移 距离/m | 空间迁移特征 |
|---|---|---|---|---|---|---|---|
| 互联网科技型 | 动漫企业 | 2 458 | 181 | 7.36 | 95.58 | 7 439.02 | 多中心集聚 |
| 游戏企业 | 2 287 | 142 | 6.21 | 90.85 | 5 808.47 | ||
| 内容创作型 | 电影企业 | 2 414 | 148 | 6.13 | 93.92 | 8 136.20 | 集聚与扩散并存 |
| 文创设计企业 | 5 001 | 232 | 4.64 | 99.57 | 8 326.49 | ||
| 平台应用型 | 智慧旅游企业 | 972 | 63 | 6.48 | 76.19 | 7 693.95 | 随机扩散 |
| 数字音乐企业 | 1 129 | 43 | 3.81 | 90.70 | 7 479.47 | ||
| 直播企业 | 806 | 53 | 6.58 | 79.25 | 4 741.48 | ||
| — | VR/AR企业 | 98 | 7 | 7.14 | 71.43 | 1 353.76 | — |
| — | 文化创意企业 | 15 165 | 869 | 5.73 | 92.75 | 7 345.69 | — |
表3 文化创意企业迁移影响因素变量指标体系Table 3 Index system of variables influencing the migration of cultural and creative enterprises |
| 变量 | 一级指标 | 二级指标 | 指标描述 |
|---|---|---|---|
| 因变量 | 企业密度 | 迁入企业密度y | 迁入地的迁入企业密度/(个·km-²) |
| 自变量 | 景观舒适性 | 风景名胜 1 | 文化遗产、风景区的密度差值/(个·km-²) |
| 文化遗产、风景区人均面积差值/(km²) | |||
| 广场 2 | 广场的密度差值/(个·km-²) | ||
| 广场人均面积差值/km² | |||
| 公园 3 | 公园的密度差值/(个·km-²) | ||
| 公园人均面积差值/km² | |||
| 休闲与社交舒适性 | 夜生活场所 4 | KTV、酒吧、夜总会、音乐吧的密度差值/(个·km-²) | |
| KTV、酒吧、夜总会、音乐吧人均数量差值/个 | |||
| 咖啡厅、茶馆 5 | 咖啡厅和茶馆的密度差值/(个·km-²) | ||
| 咖啡厅和茶馆人均数量差值/个 | |||
| 餐饮场所 6 | 饭店和快餐店的密度差值/(个·km-²) | ||
| 饭店和快餐店人均数量差值/个 | |||
| 购物中心 7 | 商场和超市的密度差值/(个·km-²) | ||
| 商场和超市人均数量差值/个 | |||
| 交通舒适性 | 公交站 8 | 公交站点的密度差值/(个·km-²) | |
| 公交站点人均数量/个 | |||
| 地铁站 9 | 地铁站点的密度差值/(个·km-²) | ||
| 地铁站点人均数量差值/个 | |||
| 停车场 10 | 停车场的密度差值/(个·km-²) | ||
| 停车场人均数量差值/个 | |||
| 科研转化舒适性 | 高校 11 | 大学的密度差值/(个·km-²) | |
| 大学人均面积差值/km² | |||
| 文化展览机构 12 | 博物馆、美术馆、展览馆的密度差值/(个·km-²) | ||
| 博物馆、美术馆、展览馆人均面积差值/km² | |||
| 研究机构 13 | 研究机构的密度差值/(个·km-²) | ||
| 研究机构人均面积差值/km² | |||
| 政策舒适性 | 文化创意产业园区 14 | 文化创意产业园区的密度差值/(个·km-²) | |
| 文化创意产业园区人均面积差值/km² | |||
| 财政拨款 15 | 地均文化体育事业财政拨款差值/(万元·km-²) | ||
| 人均文化体育事业财政拨款差值/万元 |
|
表4 影响因子空间回归分析检验结果Table 4 Results of regression analysis of influencing factors |
| 舒适性因子 | y 1 | y 2 | y 3 | ya | yb | yc | |||||||||||
|---|---|---|---|---|---|---|---|---|---|---|---|---|---|---|---|---|---|
| 显著性(P) | VIF | P | VIF | P | VIF | P | VIF | P | VIF | P | VIF | ||||||
| 常量 | 0.011 | — | 0.018 | — | 0.002 | — | 0.006 | — | 0.012 | — | 0.004 | — | |||||
| 风景名胜 1 | 0.006 | 3.648 | 0.003 | 1.732 | 0.004 | 1.471 | 0.002 | 1.054 | 0.001 | 0.689 | 0.011 | 0.984 | |||||
| 广场 2 | — | — | 0.007 | 1.413 | 0.009 | 2.782 | 0.011 | 1.215 | 0.002 | 1.505 | 0.001 | 1.076 | |||||
| 公园 3 | 0.003 | 1.456 | 0.002 | 1.331 | 0.001 | 1.479 | 0.005 | 1.197 | 0.004 | 0.534 | 0.001 | 0.810 | |||||
| 夜生活场所 4 | 0.015 | 2.081 | 0.001 | 3.089 | 0.009 | 3.528 | 0.012 | 2.114 | 0.011 | 3.594 | 0.003 | 3.548 | |||||
| 咖啡厅、茶馆 5 | 0.001 | 4.937 | 0.026 | 2.661 | 0.002 | 3.553 | 0.008 | 2.910 | 0.016 | 4.213 | 0.011 | 4.529 | |||||
| 餐饮场所 6 | 0.018 | 3.481 | 0.005 | 3.398 | 0.006 | 3.419 | 0.012 | 2.815 | 0.015 | 3.874 | 0.007 | 3.030 | |||||
| 购物中心 7 | 0.002 | 4.084 | 0.001 | 2.579 | 0.001 | 1.521 | 0.003 | 1.659 | 0.021 | 2.238 | 0.009 | 2.056 | |||||
| 公交站 8 | — | — | — | — | 0.009 | 2.163 | 0.003 | 2.499 | 0.031 | 3.432 | 0.010 | 2.501 | |||||
| 地铁站 9 | — | — | 0.009 | 1.929 | 0.005 | 2.888 | 0.012 | 1.945 | 0.008 | 2.280 | 0.002 | 3.518 | |||||
| 停车场 10 | 0.035 | 3.523 | 0.012 | 1.412 | 0.001 | 3.201 | 0.003 | 2.864 | 0.002 | 3.974 | 0.013 | 3.316 | |||||
| 高校 11 | 0.007 | 1.783 | 0.011 | 2.180 | 0.009 | 4.494 | 0.002 | 0.593 | 0.016 | 0.900 | 0.011 | 1.033 | |||||
| 文化展览场所 12 | 0.002 | 3.316 | 0.002 | 1.971 | 0.006 | 2.245 | 0.008 | 1.979 | 0.012 | 1.768 | 0.016 | 2.840 | |||||
| 科研机构 13 | 0.008 | 1.736 | 0.001 | 3.641 | 0.008 | 2.813 | 0.001 | 2.132 | 0.001 | 3.542 | 0.028 | 2.886 | |||||
| 文化创意园区 14 | 0.009 | 2.235 | 0.006 | 1.221 | 0.002 | 3.215 | 0.001 | 2.029 | 0.002 | 2.403 | 0.032 | 1.253 | |||||
| 财政拨款 15 | 0.022 | 1.607 | 0.001 | 1.236 | 0.004 | 1.957 | 0.002 | 1.568 | 0.011 | 2.818 | 0.014 | 2.174 | |||||
|
表5 文化创意企业迁移影响因子解释力Table 5 Explanatory power of factors influencing the migration of cultural and creative enterprises |
| 影响因子 | 各阶段企业影响力q值 | 各类型企业响力q值 | ||||||
|---|---|---|---|---|---|---|---|---|
| y 1 | y 2 | y 3 | 2000—2022年平均 | ya | yb | yc | ||
| 景观舒适性 | 0.279 0 | 0.053 2 | 0.070 3 | 0.134 2 | 0.079 8 | 0.103 8 | 0.183 8 | |
| 风景名胜 1 | 0.334 4 | 0.079 8 | 0.078 1 | 0.164 1 | 0.099 5 | 0.065 9 | 0.076 1 | |
| 广场 2 | — | 0.069 9 | 0.103 0 | 0.086 4 | 0.084 2 | 0.217 6 | 0.388 3 | |
| 公园 3 | 0.223 7 | 0.009 9 | 0.029 6 | 0.087 7 | 0.055 6 | 0.028 0 | 0.087 0 | |
| 休闲与社交舒适性 | 0.372 5 | 0.217 8 | 0.182 3 | 0.257 5 | 0.222 7 | 0.232 2 | 0.302 2 | |
| 夜生活场所 4 | 0.321 4 | 0.238 8 | 0.147 9 | 0.236 0 | 0.226 8 | 0.242 6 | 0.408 7 | |
| 咖啡厅、茶馆 5 | 0.463 2 | 0.266 9 | 0.257 4 | 0.329 1 | 0.299 4 | 0.346 1 | 0.451 3 | |
| 餐饮场所 6 | 0.402 6 | 0.253 5 | 0.246 8 | 0.301 0 | 0.230 1 | 0.196 4 | 0.164 1 | |
| 购物中心 7 | 0.302 6 | 0.112 1 | 0.077 1 | 0.164 0 | 0.134 6 | 0.143 5 | 0.184 9 | |
| 交通舒适性 | 0.387 7 | 0.382 0 | 0.219 0 | 0.329 6 | 0.231 7 | 0.313 5 | 0.290 9 | |
| 公交站 8 | — | — | 0.116 9 | 0.116 9 | 0.161 6 | 0.293 7 | 0.192 2 | |
| 地铁站 9 | — | 0.370 9 | 0.115 2 | 0.243 0 | 0.171 9 | 0.148 1 | 0.266 7 | |
| 停车场 10 | 0.387 7 | 0.393 2 | 0.424 9 | 0.401 9 | 0.361 5 | 0.498 6 | 0.413 7 | |
| 科研转化舒适性 | 0.249 4 | 0.166 0 | 0.145 2 | 0.186 9 | 0.153 5 | 0.234 4 | 0.289 8 | |
| 高校 11 | 0.217 6 | 0.191 6 | 0.087 7 | 0.165 6 | 0.056 9 | 0.116 1 | 0.156 2 | |
| 文化展览场所 12 | 0.402 8 | 0.065 5 | 0.082 1 | 0.183 5 | 0.143 7 | 0.162 1 | 0.341 3 | |
| 科研机构 13 | 0.127 7 | 0.241 0 | 0.265 6 | 0.211 5 | 0.259 8 | 0.425 0 | 0.372 1 | |
| 政策舒适性 | 0.206 1 | 0.161 0 | 0.238 1 | 0.201 7 | 0.144 6 | 0.126 7 | 0.146 7 | |
| 文化创意园区 14 | 0.132 1 | 0.283 6 | 0.401 2 | 0.272 3 | 0.238 2 | 0.132 2 | 0.183 5 | |
| 财政拨款 15 | 0.280 0 | 0.038 5 | 0.075 1 | 0.131 2 | 0.051 1 | 0.121 2 | 0.109 9 | |
| 平均 | — | — | — | — | 0.166 4 | 0.202 1 | 0.242 7 | |
|
1 分类方式源自于企查查平台基于大数据模型,结合不同行业企业的经营数据(其中上市/发债企业以合并报表口径)计算形成的L(大型)、M(中型)、S(小型)和XS(微型)4类企业规模分类体系(部分缺乏判定指标或新成立的企业不纳入计算范畴)。
2 源自笔者的调研访谈,时间为2023-06-07,访谈对象为广州国际金融城A游戏企业某高管。
3 源自笔者的调研访谈,时间为2022-10-19,访谈对象为广州市天河智慧城B游戏企业某高管。
廖辉辉:负责数据收集与分析,技术路线制定及论文撰写;
魏 成:负责研究总体推进与论文修改和提升;
罗 鹏:负责数据收集与分析,论文修改和提升;沈 静:负责理论与方法支撑,提供指导意见。
|
Dahms F and Mccomb J. 1999. 'Counterurbanization', Interaction and Functional Change in a Rural Amenity Are—A Canadian Example. Journal of Rural Studies, 15(2): 129-146.
|
|
Ferrans C E and Powers M J. 1985. Quality of Life Index: Development and Psychometric Properties. Ans Advances in Nursing Science, 8(1): 15-24.
|
|
Florida R L. 2012. The Rise of the Creative Class—Revisited. New York: Basic Books.
|
|
Forslid R and Ottaviano G I P. 2003. An Analytically Solvable Core-Periphery Model. Journal of Economic Geography, 3(3): 229-240.
|
|
Glaeser E L, Kolko J, and Saiz A. 2001. Consumer City. Journal of Economic Geography, 1(1): 27-50.
|
|
Graves P E. 1983. Migration with a Composite Amenity: The Role of Rents. Journal of Regional Science, 23(4): 541.
|
|
Hadley C D, Mclaughlin G E, and Robock S. 1949. Why Industry Moves South: A Study of Factors Influencing the Recent Location of Manufacturing Plants in the South. Kingsport: Kingsport Press.
|
|
He C. 2003. Location of Foreign Manufactures in China: Agglomeration Economies and Country of Origin Effects. Papers in Regional Science, 82(3): 351-372.
|
|
Hutton Thomas A. 2006. Spatiality, Built Form, and Creative Industry Development in the Inner City. Environment and Planning A, 38: 1819-1841.
|
|
Jr D H and Rubinfeld D L. 1978. Hedonic Housing Prices and the Demand for Clean Air. Journal of Environmental Economics &Management, 5(1): 81-102.
|
|
Krugman P. 1991. Geography and Trade. Cambridge, MA: MIT Press.
|
|
Kumagai K and Smith D M. 1979. Human Geography: A Welfare Approach. Annals of the Association of Economic Geographers, 25(3): 204-208.
|
|
Liao H F and Chan R C K. 2012. Industrial Relocation of Hong Kong Manufacturing Firms: Towards an Expanding Industrial Space Beyond the Pearl River Delta. GeoJournal, 77(3): 361-381.
|
|
Lopez R A, Shah F A, and Altobello M A. 1994. Amenity Benefits and the Optimal Allocation of Land. Land Economics, 70(1): 53-62.
|
|
Munir A, Zeeshan K, Muhammad K A, and Gul J. 2021. Do Rural-Urban Migration and Industrial Agglomeration Mitigate the Environmental Degradation Across China's Regional Development Levels? Sustainable Production and Consumption, 27: 679-697.
|
|
Pellenbarg P H. 2002. Sustainable Business Sites in the Netherlands: A Survey of Policies and Experiences. Journal of Environmental Planning and Management, 45(1): 59-84.
|
|
Ramos R, Surinach J, and Artis M. 2012. Regional Economic Growth and Human Capital: The Role of Over-Education. Regional Studies, 46(10): 1389-1400.
|
|
Scott A J. 2010. Cultural Economy and the Creative Field of the City. Geografiska Annaler: Series B, Human Geography, 92B(2): 115-130.
|
|
Ullman E L. 1954. Amenities as a Factor in Regional Growth. Geographical Review, 44(1): 119-132.
|
|
陈政,胡吉,洪敏,周怡岑,张亨溢. 2018. 湖南文化产业发展的时空特征与影响因素分析. 经济地理,38(3):129-134.
Chen Zheng, Hu Ji, Hong Min, Zhou Yicen, and Zhang Hengyi. 2018. The Spatial Temporal Characteristics and Influencing Factors of Hunan Cultural Industry Development. Economic Geography, 38 (3): 129-134.
|
|
褚劲风. 2009. 上海创意产业空间集聚的影响因素分析. 经济地理,29(1):102-107,129.
Chu Jingfeng. 2009. A Study on Spatial Difference of the Creative Industrial Zones in Shanghai. Economic Geography, 29(1): 102-107, 129.
|
|
戴其文,杨靖云,张晓奇,胡森林. 2020. 污染企业/产业转移的特征、模式与动力机制. 地理研究,39(7):1511-1533.
Dai Qiwen, Yang Jingyun, Zhang Xiaoqi, and Hu Senlin. 2020. Characteristics, Models, and Motivation Mechanisms of Polluting Enterprises/Industries Transfer. Geographical Research, 39(7): 1511-1533.
|
|
邓清华,薛德升,龚建周. 2020. 广州市居民网络购物频率的影响因素及其空间差异. 地理科学,40(6):928-938.
Deng Qinghua, Xue Desheng, and Gong Jianzhou. 2020. The Influencing Factors and Spatial Differences of Online Shopping Frequency Among Residents in Guangzhou. Scientia Geographica Sinica, 40(6): 928-938.
|
|
邓智团,郭红星. 2023. 创新时代城市发展新逻辑——城市舒适性吸引人才的理论与实证. 学术月刊,55(10):61-74.
Deng Zhituan and Guo Hongxing. 2023. New Development Ideas of Urban Economy in the Era of Innovation: The Theoretically Explain and Empirically Test of "Urban Amenity Attracting Talents". Academic Monthly, 55(10): 61-74.
|
|
段楠. 2012. 城市视角下的文化创意产业研究. 天津:南开大学.
Duan Nan. 2012. A Study on the Cultural and Creative Industry from City Perspective. Tianjin: Nankai University.
|
|
广州市文化广电旅游局. 2021. 广州市推动文化创意产业链高质量发展三年行动计划(2021―2023年).(2021-10-28)[2023-03-09]. www.gd.gov.cn/gdywdt/dsdt/content/post_4127987.html.
Guangzhou Authority of Culture, Radio, Film and Tourism. 2021. Three Year Action Plan for Promoting High Quality Development of Cultural and Creative Industry Chain in Guangzhou City (2021-2023). (2021-10-28) [2023-03-09]. www.gd.gov.cn/gdywdt/dsdt/content/post_4127987.html.
|
|
广州市文化广电旅游局. 2022. 广州市关于推进数字文化创意产业高质量发展的实施意见.(2022-08-23)[2022-08-24]. http://wglj.gz.gov.cn/xxgk/gzdt/tzgsgg/content/post_8522313.html.
Guangzhou Authority of Culture, Radio, Film and Tourism. 2022. Implementation Opinions of Guangzhou Municipality on Promoting High Quality Development of Digital Culture and Creative Industry.(2022-08-23) [2022-08-24]. http://wglj.gz.gov.cn/xxgk/gzdt/tzgsgg/content/post_8522313.html.
|
|
郭杰,杨永春,冷炳荣. 2012. 1949年以来中国西部大城市制造业企业迁移特征、模式及机制——以兰州市为例. 地理研究,31(10):1872-1886.
Guo Jie, Yang Yongchun, and Leng Bingrong. 2012. The Migration Characteristics, Models, and Mechanisms of Manufacturing Enterprises in Major Cities in Western China Since 1949: A Case Study of Lanzhou City. Geographical Research, 31(10): 1872-1886.
|
|
浩飞龙,张杰,王士君. 2022. 国内外城市舒适性研究综述与展望. 地理科学进展,41(12):2396-2409.
Hao Feilong, Zhang Jie, and Wang Shijun. 2022. A Literature Review of Urban Amenity and Its Research Prospects. Progress in Geography, 41(12): 2396-2409.
|
|
何金廖,曾刚. 2019. 城市舒适性驱动下的创意产业集聚动力机制——以南京品牌设计产业为例. 经济地理,39(3):134-142,161.
He Jinliao and Zeng Gang. 2019. Dynamic Mechanism of Creative Industry Agglomeration under the Driving of Urban Amenities: A Case Study of Brand Design Industry in Nanjing. Economic Geography, 39(3): 134-142, 161.
|
|
何金廖,彭珏,胡浩. 2021. 设计创意人才的空间集聚及其影响机理研究——基于城市舒适性视角. 地理科学,41(9):1525-1535.
He Jinliao, Peng Yu, and Hu Hao. 2021. Spatial Agglomeration of Design Creative Talents and Its Driving Factors: Based on the Perspective of Urban Amenities. Scientia Geographica Sinica, 41(9): 1525-1535.
|
|
黄柏青. 2012. 炫目的艺术景观:新媒体与动漫艺术的耦合. 湖南大学学报(社会科学版),26(3):121-126.
Huang Baiqing. 2012. Stunning Art Landscape: New Media and Animation Art Coupling. Journal of Hunan University(Natural Sciences), 26(3): 121-126.
|
|
黄江,胡晓鸣. 2011. 创意产业企业空间分布研究——以杭州市为例. 经济地理,31(11):1851-1856.
Huang Jiang and Hu Xiaoming. 2011. Spatial Pattern of Creative Industry: A Case Study of Hangzhou. Economic Geography, 31(11): 1851-1856.
|
|
黎逸科,黎碧茵. 2009. 珠三角企业迁移浅析. 热带地理,29(3):251-256.
Li Yike and Li Biyin. 2009. Analysis of the Migration of Enterprises in the Pearl River Delta. Tropical Geography, 29(3): 251-256.
|
|
李博,曲艺,王泽宇,吴芳仪,吴景辉. 2023. 长三角城市产业演化路径依赖对经济韧性的影响. 地理研究,42(8):2036-2052.
Li Bo, Qu Yi, Wang Zeyu, Wu Fangyi, and Wu Jinghui. 2023. The Impact of Industrial Evolution Path Dependence on Economic Resilience in Yangtze River Delta Cities. Geographical Research, 42(8): 2036-2052.
|
|
李俊峰,陶世杰,高凌宇. 2018. 跨江发展下杭州市企业迁移空间模式及影响机制. 地理科学,38(1):87-96.
Li Junfeng, Tao Shijie, and Gao Lingyu. 2018. The Space Model and the Influence Mechanism of Enterprise Migration Under River-Crossing Development in Hangzhou. Scientia Geographica Sinica, 38(1): 87-96.
|
|
廖辉辉,罗鹏,贾梦蛟,魏成. 2023. 广州市文化创意产业空间格局特征及其演变——以游戏产业为例. 南方建筑,(10):68-78.
Liao Huihui, Luo Peng, Jia Mengjiao, and Wei Cheng. 2023. Characteristics and Evolution of the Spatial Pattern of Cultural and Creative Industry in Guangzhou: A Case Study of the Game Industry. Southern Architecture, (10): 68-78.
|
|
林柄全,李想,谷人旭. 2023. “对口帮扶”政策引发污染企业的迁移行为及其驱动机制. 经济地理,43(4):114-123.
Lin Bingquan, Li Xiang, and Gu Renxu. 2023. Spatiotemporal Evolution and Mechanism of the Migration of Polluting Enterprises under the Influence of Hand-in-Hand Assistance Policy. Economic Geography, 43 (4): 114-123.
|
|
刘军. 2009. 整体网分析讲义:UCINET软件实用指南. 上海:上海人民出版社.
Liu Jun. 2009. Lecture on Overall Network Analysis: UCINET Software Practical Guide. Shanghai: Shanghai People Press.
|
|
马凌,李丽梅,朱竑. 2018. 中国城市舒适物评价指标体系构建与实证. 地理学报,73(4):755-770.
Ma Ling, Li Limei, and Zhu Hong. 2018. Construction and Empirical Study of Evaluation Index System for Urban Amenities in China. Acta Geographica Sinica, 73(4): 755-770.
|
|
潘峰华,夏亚博,刘作丽. 2013. 区域视角下中国上市企业总部的迁址研究. 地理学报,68(4):449-463.
Pan Fenghua, Xia Yabo, and Liu Zuoli. 2013. A Study on the Relocation of Headquarters of Chinese Listed Companies from a Regional Perspective. Acta Geographica Sinica, 68(4): 449-463.
|
|
王缉慈. 2010. 超越集群. 北京:科学出版社. [Wang Jici. 2010. Beyond Clusters. Beijing: Science Press. ]
|
|
王劲峰,徐成东. 2017. 地理探测器:原理与展望. 地理学报,72(1):116-134.
Wang Jinfeng and Xu Chengdong. 2017. Geodetectors: Principles and Prospects. Acta Geographica Sinica, 72(1): 116-134.
|
|
王宁. 2014. 地方消费主义、城市舒适物与产业结构优化——从消费社会学视角看产业转型升级. 社会学研究,29(4):24-48,242-243.
Wang Ning. 2014. Local Consumerism, Urban Comfort and Industrial Structure Optimization: From the Perspective of Consumer Sociology to Analyze Industrial Transformation and Upgrading. Sociological Studies, 29(4): 24-48, 242-243.
|
|
温婷,林静,蔡建明,杨振山,丁悦. 2016. 城市舒适性:中国城市竞争力评估的新视角及实证研判. 地理研究,35(2):214-226.
Wen Ting, Lin Jing, Cai Jianming, Yang Zhenshan, and Ding Yue. 2016. Urban Amenity: A New Perspective and Empirical Testimony on China's City Competitiveness Assessment. Geographical Research, 35(2): 214-226.
|
|
武前波,张露茗,俞姝姝. 2019. 知识经济时代杭州近郊大型社区消费设施特征. 城市规划,43(2):35-45.
Wu Qianbo, Zhang Luming, and Yu Shushu. 2019. Characteristics of Urban Amenity in Large Communities in the Suburb of Hangzhou at the Era of Knowledge Economy. Urban Planning, 43(2): 35-45.
|
|
武前波,郭豆豆,赵淑红. 2023. 舒适性视角下城市创意空间分布格局及其影响因素——以杭州为例. 经济地理,43(6):54-64.
Wu Qianbo, Guo Doudou, and Zhao Shuhong. 2023. Distribution Pattern and Influencing Factors of Urban Creative Space from the Amenity Perspective: A Case Study of Hangzhou. Economic Geography, 43(6): 54-64.
|
|
谢宇. 2013. 回归分析. 修订版. 北京:社会科学文献出版社.
Xie Yu. 2013. Regression Analysis. Revised Edition. Beijing: Social Sciences Academic Press.
|
|
徐彦,韦素琼,徐旳,蔡世珍. 2022. 文化创意产业空间分布与城市区位功能影响分析——以台中市为例. 地域研究与开发,41(4):52-58.
Xu Yan, Wei Suqiong, Xu Di, and Cai Shizhen.2022. Spatial Distribution of Cultural and Creative Industries and the Impact of Urban Location Function: A Case Study of Taichung City. Areal Research and Development, 41(4): 52-58.
|
|
许闻博,王兴平,陈秋伊. 2023. 制造业企业迁移和城市创新格局演化互动——基于51家深圳企业的实证. 城市规划学刊,(3):92-99.
Xu Bowen, Wang Xingping, and Chen Qiuyi. 2023. Interactions between the Migration of Manufacturing Firms and the Pattern of Urban Innovation: An Empirical Study of 51 Shenzhen Enterprises. Urban Planning Forum, (3): 92-99.
|
|
喻忠磊,唐于渝,张华,梁进社. 2016. 中国城市舒适性的空间格局与影响因素. 地理研究,35(9):1783-1798.
Yu Zhonglei, Tang Yuyu, Zhang Hua, and Liang Jinshe. 2016. Spatial Pattern and Driving Factors of Chinese Urban Amenities. Geographical Research, 35(9): 1783-1798.
|
|
袁俊. 2011. 深圳市旅游业与文化产业互动发展模式研究. 热带地理,31(1):82-87,99.
Yuan Jun. 2011. A Study on the Interactive Development Patterns of Tourism and Cultural Industries in Shenzhen. Tropical Geography, 31(1): 82-87, 99.
|
|
张筱娟,徐维祥,黄明均,刘程军,唐根年. 2019. 制造业企业的迁移特征、机制及其绩效——以杭州市为例. 经济地理,39(6):136-146.
Zhang Xiaojuan, Xu Weixiang, Huang Mingjun, Liu Chengjun, and Tang Gennian. 2019. Migration Characteristics, Mechanisms and Performance of Manufacturing Enterprises: A Case of Hangzhou. Economic Geography, 39(6): 136-146.
|
|
赵佩佩,刘彦,杨驹. 2021. 杭州创新空间集聚规律与布局模式研究. 规划师,37(5):67-73. [Zhao Peipei, Liu Yan, and Yang Ju. 2021. Conglomeration and Layout of Innovation Space in Hangzhou. Planners, 37(5): 67-73. ]
|
|
周京奎. 2009. 城市舒适性与住宅价格、工资波动的区域性差异——对1999—2006中国城市面板数据的实证分析. 财经研究,35(9):80-91.
Zhou Jingkui. 2009. Regional Differences of the Impacts of Urban Amenity on House Price and Wages: An Empirical Test Based on Panel Data of China's Cities from 1999 to 2006. Journal of Finance and Economics, 35(9): 80-91.
|
|
周尚意,沈小平. 2008. 北京美术产业对地方文化的嵌入性程度分析. 人文地理,23(2):26-32.
Zhou Shangyi and Shen Xiaoping. 2008. Analysis of the Degree of Embedding of Local Culture in Beijing's Art Industry. Human Geography, 23(2): 26-32.
|
|
庄玉梅,王莉. 2022. 是谁驱动了科技企业的技术创新. 科研管理,43(3):46-54.
Zhuang Yumei and Wang Li. 2022. Who Drives the Technology Innovation of Science and Technology Enterprises? Science Research Management, 43(3): 46-54.
|
/
| 〈 |
|
〉 |