
上海汛期暴雨内涝时空分异及文旅集聚区影响评价
|
沈涣焕(2000—),男,江苏无锡人,硕士研究生,从事内涝模拟与影响评估研究,(E-mail)shh00317@126.com; |
收稿日期: 2024-12-06
修回日期: 2025-03-10
网络出版日期: 2025-04-28
基金资助
上海哲学社会科学基金(2024BJC014)
国家自然科学基金面上项目(42171080)
Spatio-Temporal Variations of Rainstorms and Pluvial Floods and Impact Assessment on Cultural Tourism Clusters during Flood Seasons in Shanghai
Received date: 2024-12-06
Revised date: 2025-03-10
Online published: 2025-04-28
利用上海市1990—2020年逐日降雨数据,构建了汛期3个时期(梅雨期、盛夏期、秋雨期)3种雨量阈值(最大值、99分位、95分位)下的9种暴雨情景。基于SCS-CN水文模型和Mike21水动力模型进行城市暴雨水淹模拟,构建了基于层次分析法和熵权法组合权重与控制规则的模糊综合评价指标体系,对上海文旅集聚区进行内涝影响评价。结果表明:1)盛夏期为上海暴雨内涝高影响时期,95分位情景下郊区受轻微内涝影响,极大值情景下中心城区内涝影响显著增加;2)控制规则有效地提升了内涝影响评价体系的合理性与适应性,常住人口和流动人口是内涝影响评价的关键因子;上海市文旅集聚区内涝影响呈现显著的时空梯度特征,中高及高影响区域主要集中于中心城区文旅集聚区;3)盛夏期中高及高影响区域面积最大,达3.1 km2(占比8.79%),梅雨期次之,秋雨期影响最小;4)盛夏期街区马路型集聚区的高影响面积占比最大,水岸休闲型和文旅综合型次之,面积占比分别为27.52%、8.30%和6.44%。
沈涣焕 , 胡恒智 , 辛辰 , 温家洪 , 杨雨露 . 上海汛期暴雨内涝时空分异及文旅集聚区影响评价[J]. 热带地理, 2025 , 45(4) : 605 -620 . DOI: 10.13284/j.cnki.rddl.20240806
With the acceleration of climate change and urbanization in recent years, extreme rainstorms and urban flooding have increasingly threatened urban safety. Their impact on cultural, commercial, and tourism industries is widespread and significant, often leading to traffic paralysis, closure of tourist attractions, business shutdowns, and passenger stranding. In severe cases, this can endanger personal safety and result in significant economic losses. Shanghai, a representative coastal tourist city in China, is highly prone to rainstorm-induced flooding events from June to October each year due to the Meiyu front, extreme rainstorms, and typhoons. Conducting flood inundation simulations in Shanghai during the flood season is essential to identify high-impact urban flood areas and evaluate flood effects on densely populated cultural, commercial, and tourism hubs. This study used daily rainfall data from Shanghai between 1990 and 2020 to construct nine rainstorm scenarios based on three flood season periods (Meiyu, midsummer, and autumn) and three rainfall thresholds (maximum, 99th, and 95th percentiles). Using the SCS-CN and Mike21 hydrodynamic models for urban rainstorm flood simulations, a fuzzy comprehensive evaluation index system was developed based on a combination of Analytic Hierarchy Process(AHP) and Entropy Weighting Method (EWM) to assess the impact of flooding on Shanghai's cultural and tourism cluster areas. Results indicate the following: (1) Shanghai experiences the highest impact from rainstorm-induced flooding in the midsummer period. In the 95th percentile scenario, suburban areas experience minor flooding, whereas in the maximum value scenario, central urban areas experience a significant increase in flooding impact. (2) Control rules effectively improved the rationality and adaptability of the flood impact evaluation system. Resident and transient populations are key factors in evaluating flood impact. The flood impacts in Shanghai's cultural and tourism clusters showed significant spatial and temporal gradient characteristics, with medium-to-high- and high-impact areas primarily concentrated in the central urban cultural and tourism clusters. (3) Midsummer had the largest medium-to-high and high-impact zones, reaching 3.1 km² (8.79% of the total area), followed by the Meiyu period, whereas the autumn period has the smallest impact. (4) During midsummer, the largest proportion of high-impact areas was found in street- and road-type clusters, followed by waterfront leisure and comprehensive cultural tourism clusters, with areas accounting for 27.52%, 8.30%, and 6.44%, respectively. Cultural and tourism clusters should strengthen early warning, regulation, and preventive measures based on seasonal variations, especially during midsummer, when effective countermeasures must be implemented to reduce flooding impacts on visitor experience and regional safety. This study provides valuable insights for urban flood forecasting, early warning, and emergency response, as well as recommendations for sustainable development of the urban cultural, commercial, and tourism industries.
表1 文旅集聚区类别与名称Table 1 Categories and names of cultural-tourism clusters |
| 编号 | 集聚区类别 | 名称 |
|---|---|---|
| 1 | 文 旅 综 合 型 | 新天地—思南公馆 |
| 2 | 徐家汇源—美罗城 | |
| 3 | 南京西路商圈 | |
| 4 | 五角场 | |
| 5 | 豫园 | |
| 6 | 西岸美术馆大道 | |
| 7 | 大宁片区 | |
| 8 | 上海国际旅游度假区 | |
| 9 | 莫干山路艺术街区 | |
| 10 | 夜虹桥潮流街区 | |
| 11 | 静安寺 | |
| 12 | 陆家嘴 | |
| 13 | 苏河湾―中山公园 | |
| 14 | 虹桥古北 | |
| 15 | 水 岸 休 闲 型 | 黄浦外滩 |
| 16 | 北外滩滨江 | |
| 17 | 外白渡桥 | |
| 18 | 杨浦滨江 | |
| 19 | 静安—苏河湾 | |
| 20 | 浦江富都滨江1862船舱—艺仓 | |
| 21 | 前滩 | |
| 22 | 世博片区 | |
| 23 | 街 区 马 路 型 | 衡复音乐街区 |
| 24 | 安福路文艺街区 | |
| 25 | 新华历史风貌街区 | |
| 26 | 愚园路风貌景区 | |
| 27 | 吴江路—张园—丰盛里 | |
| 28 | 音乐谷—瑞虹 | |
| 29 | 定西路—上生新所 |
表2 上海市文旅区内涝影响指标体系构建Table 2 Construction of the pluvial flood impact indicator system for cultural and tourism districts in shanghai |
| 准则层 | 指标层 | 方案层 |
|---|---|---|
| 致灾 因子 | 淹没水深 | 极大值水深/m |
| 99分位水深/m | ||
| 95分位水深/m | ||
| 淹没时间 | 最大淹没时间/h | |
| 99分位淹没时间/h | ||
| 95分位淹没时间/h | ||
| 淹没面积 | 最大淹没面积/m2 | |
| 99分位淹没面积/m2 | ||
| 95分位淹没面积/m2 | ||
| 承灾体 暴露度 | 人口 | 总人口/(人·hm-2) |
| 流动人口/(人·hm-2) | ||
| 交通 | 主干道路网密度/(km·hm-2) | |
| 次干道路网密度/(km·hm-2) | ||
| 道路流量等级 | ||
| 交通站点/(个·hm-2) | ||
| 旅游要素 | 餐饮设施/(个·hm-2) | |
| 住宅设施/(个·hm-2) | ||
| 出行设施/(个·hm-2) | ||
| 游览设施/(个·hm-2) | ||
| 购物设施/(个·hm-2) | ||
| 娱乐设施/(个·hm-2) |
表3 模糊控制规则与规范映射Table 3 Fuzzy control rules and specification mapping |
| 规则 | 触发条件 | 输出逻辑 | 规范依据 |
|---|---|---|---|
| 规 则 一 | 任一条件满足: 1)淹没水深最大隶属度为低影响评价集; 2)承灾体最大隶属度为低影响评价集。 | 判定为低影响,无需紧急干预。 | 规范第2条:“道路积水≤0.15 m,建筑物底层不进水”。 |
| 规则二 | 同时满足: 1)淹没水深最大隶属度为中、中高、高影响评价集; 2)人口与旅游要素最大隶属度为非低影响评价集。 | 输出三者中最高影响等级,触发区域疏散或限流。 | 规范第1、3条:“水深≥0.15m需评估,规避人口密集区”。 |
| 规则三 | 同时满足: 1)路网密度最大隶属度为非低影响评价集; 2)道路流量、淹没水深最大隶属度均为非低影响评价集。 | 输出淹没水深的最高影响等级 | 规范第3条:“行泄通道避开主干道,设置于下游道路”。 |
表4 评价因子权重及各等级分割点(a 1~a 5)Table 4 Weights of evaluation factors and division points for each grade(a 1~a 5) |
| 评价因子 | 权重 | a 1 | a 2 | a 3 | a 4 | a 5 | 值域 | ||
|---|---|---|---|---|---|---|---|---|---|
| 梅雨 | 盛夏 | 秋雨 | |||||||
| 极大值水深/m | 0.12 | 0.12 | 0.12 | 0.15 | 0.3 | 0.5 | 0.75 | 1 | 0~2.69 |
| 99分位水深/m | 0.09 | 0.09 | 0.09 | 0.15 | 0.3 | 0.5 | 0.75 | 1 | 0~2.57 |
| 95分位水深/m | 0.06 | 0.06 | 0.06 | 0.15 | 0.3 | 0.5 | 0.75 | 1 | 0~2.56 |
| 最大淹没时间/h | 0.05 | 0.05 | 0.05 | 1 | 2 | 3 | 6 | 12 | 0~21 |
| 99分位淹没时间/h | 0.04 | 0.04 | 0.04 | 1 | 2 | 3 | 6 | 12 | 0~20 |
| 95分位淹没时间/h | 0.04 | 0.04 | 0.04 | 1 | 2 | 3 | 6 | 12 | 0~16 |
| 最大淹没面积/m2 | 0.01 | 0.01 | 0.01 | 900 | 1 800 | 2 700 | 3 600 | 5 400 | 0~8 100 |
| 99分位淹没面积/m2 | 0.01 | 0.01 | 0.01 | 900 | 1 800 | 2 700 | 3 600 | 5 400 | 0~8 100 |
| 95分位淹没面积/m2 | 0.01 | 0.01 | 0.01 | 900 | 1 800 | 2 700 | 3 600 | 5 400 | 0~8 100 |
| 总人口/(人·hm-2) | 0.05 | 0.05 | 0.05 | 103 | 310 | 735 | 1 673 | 3 746 | 0~18 496 |
| 流动人口/(人·hm-2) | 0.07 | 0.07 | 0.07 | 239 | 778 | 1 317 | 1 915 | 2 992 | 0~15 259 |
| 主干道路网密度/(km·hm-2) | 0.04 | 0.04 | 0.04 | 0.302 | 0.532 | 0.786 | 1.076 | 1.487 | 0~3.083 |
| 次干道路网密度/(km·hm-2) | 0.02 | 0.02 | 0.02 | 0.196 | 0.336 | 0.532 | 0.839 | 3.02 | 0~7.13 |
| 道路流量等级 | 0.01 | 0.01 | 0.01 | 0.669 | 0.893 | 1.151 | 1.515 | 2.02 | 0~3 |
| 交通站点/(个·hm-2) | 0.06 | 0.06 | 0.06 | 1 | 2 | 5 | 9 | 13 | 0~17 |
| 餐饮设施/(个·hm-2) | 0.05 | 0.05 | 0.05 | 4 | 11 | 24 | 46 | 97 | 0~162 |
| 住宅设施/(个·hm-2) | 0.05 | 0.05 | 0.05 | 1 | 3 | 7 | 14 | 28 | 0~62 |
| 出行设施/(个·hm-2) | 0.05 | 0.05 | 0.05 | 1 | 3 | 6 | 12 | 22 | 0~35 |
| 游览设施/(个·hm-2) | 0.07 | 0.07 | 0.07 | 1 | 2 | 5 | 9 | 13 | 0~19 |
| 购物设施/(个·hm-2) | 0.05 | 0.05 | 0.05 | 6 | 20 | 62 | 156 | 341 | 0~621 |
| 娱乐设施/(个·hm-2) | 0.05 | 0.05 | 0.05 | 2 | 5 | 9 | 15 | 26 | 0~42 |
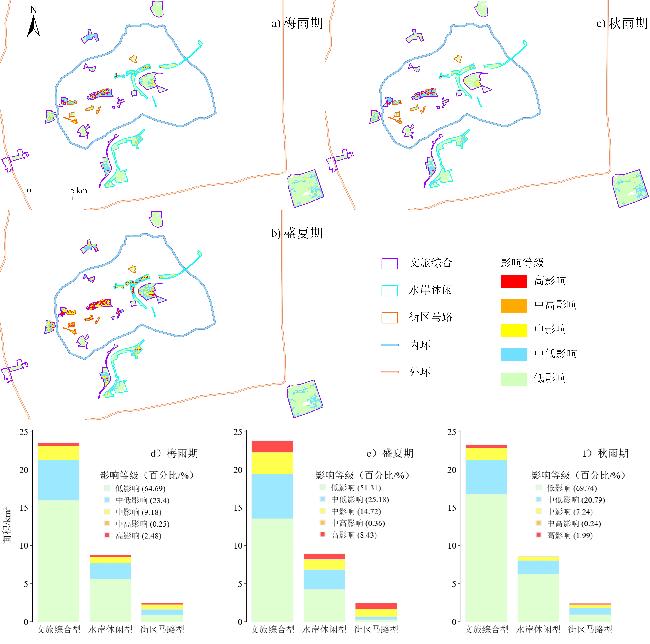
图4 各阈值下3种暴雨情景内涝淹没影响及分布Fig.5 Spatial distribution of pluvial flood impact in shanghai based on fuzzy comprehensive evaluation |
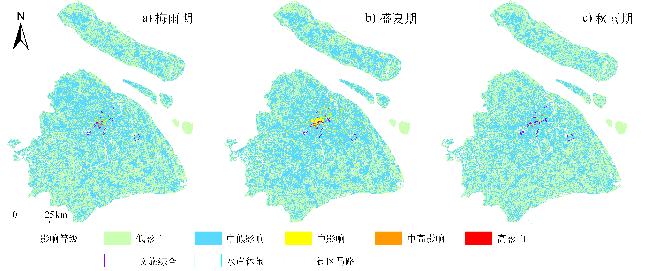
图5 上海内涝影响模糊综合评价结果分布Fig.5 Spatial distribution of pluvial flood impact in shanghai based on fuzzy comprehensive evaluation |
表5 模糊综合评价结果中各等级对应的面积统计Table 5 Area statistics for each level in the fuzzy comprehensive evaluation results |
| 影响等级 | 汛期淹没面积/km2(比例/%) | ||
|---|---|---|---|
| 梅雨期 | 盛夏期 | 秋雨期 | |
| 低 | 3 075.88(47.04) | 2 762.78(42.09) | 3 337.28(51.15) |
| 中低 | 3 368.41(51.51) | 3 641.33(55.48) | 3 119.03(47.81) |
| 中 | 94.53(1.45) | 159.13(2.42) | 67.63(1.04) |
| 中高 | 0.13(<0.01) | 0.60(<0.01) | 0.15(<0.01) |
| 高 | — | — | — |
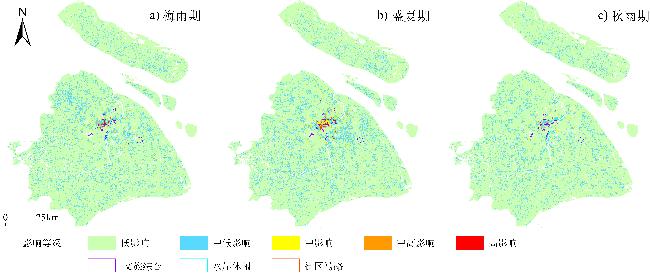
表6 控制规则下的模糊综合评价结果中各等级对应的面积统计Table 6 Area statistics of each level in the fuzzy comprehensive evaluation results under control rules |
| 影响等级 | 淹没面积/km2(比例/%) | ||
|---|---|---|---|
| 梅雨期 | 盛夏期 | 秋雨期 | |
| 低 | 5 606.36(85.74) | 5 459.71(83.18) | 5 714.9(87.60) |
| 中低 | 853.08(13.05) | 967.42(14.74) | 751.87(11.53) |
| 中 | 72.84(1.11) | 118.73(1.81) | 52.91(0.81) |
| 中高 | 0.94(0.01) | 1.54(0.02) | 0.63(0.01) |
| 高 | 5.73(0.09) | 16.44(0.25) | 3.79(0.06) |
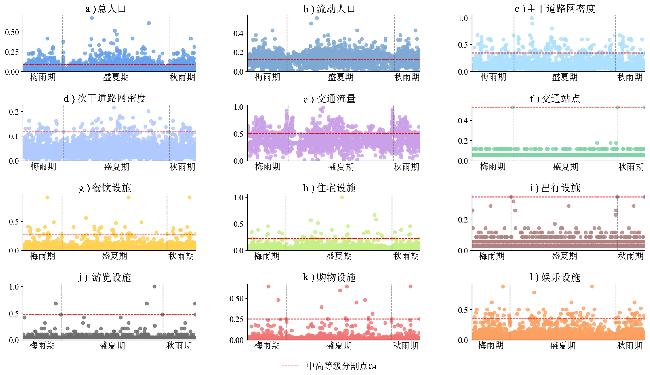
图7 不同汛期中高、高影响区域中各承灾体暴露总量 Fig.7 Total quantity of each disaster-bearing entity in the medium-high and high impact areas during different flood seasons |
表7 上海汛期各类文旅集聚区内涝影响面积统计Table 7 Flooded area statistics of various types of cultural and tourism clusters in shanghai during the flood season |
| 影响 等级 | 各类文旅区汛期淹没面积/km2(比例/%) | ||||||||||
|---|---|---|---|---|---|---|---|---|---|---|---|
| 梅雨期 | 盛夏期 | 秋雨期 | |||||||||
| 文旅综合 | 水岸休闲 | 街区马路 | 文旅综合 | 水岸休闲 | 街区马路 | 文旅综合 | 水岸休闲 | 街区马路 | |||
| 总计 | 23.75 | 8.92 | 2.58 | 23.75 | 8.92 | 2.58 | 23.75 | 8.92 | 2.58 | ||
| 低 | 16.15(68.00) | 5.76(64.57) | 1.05(40.70) | 13.45(56.63) | 4.18(46.86) | 0.46(17.83) | 17.24(72.59) | 6.51(72.98) | 1.09(42.25) | ||
| 中低 | 5.31(22.36) | 2.12(23.77) | 0.71(27.52) | 5.90(24.84) | 2.60(29.15) | 0.37(14.34) | 4.47(18.82) | 1.79(20.07) | 0.88(34.11) | ||
| 中 | 1.84(7.75) | 0.77(8.63) | 0.59(22.87) | 2.83(11.92) | 1.39(15.58) | 0.97(37.60) | 1.61(6.78) | 0.52(5.83) | 0.37(14.34) | ||
| 中高 | 0.03(0.13) | 0.02(0.22) | 0.04(1.55) | 0.04(0.17) | 0.01(0.11) | 0.07(2.71) | 0.03(0.13) | 0.01(0.11) | 0.04(1.55) | ||
| 高 | 0.42(1.77) | 0.25(2.80) | 0.19(7.36) | 1.53(6.44) | 0.74(8.30) | 0.71(27.52) | 0.4(1.68) | 0.09(1.01) | 0.2(7.75) | ||
|
1 土地利用数据来源网址:https://zenodo.org/records/8176941
2 道路与交通站点数据来源网址:https://www.openstreetmap.org/
3 道路流量数据来源网址:https://lbs.amap.com/
4 时空人口数据来源网址:https://gisuni.geoq.cn
5 旅游要素兴趣点数据来源网址:https://lbs.amap.com/
沈涣焕:承担本研究的数据处理、内涝模型建模与模拟、结果统计分析、文章撰写与修改。
胡恒智:承担本研究的水文、地理数据搜集与处理、方法与技术路线设计、结果分析、文章撰写与修改。
辛 辰:承担本研究的降雨资料搜集与处理、汛期情景构建和分析、文章修改。
温家洪:统筹整体研究思路与文章修改。
杨雨露:承担部分数据处理和文献整理。
|
Adikari Y, Osti R, and Noro T. 2010. Flood-Related Disaster Vulnerability: An Impending Crisis of Megacities in Asia. Journal of Flood Risk Management, 3(3): 185-191.
|
|
Akter M, Jahan M, Kabir R, Karim D S, Haque A, Rahman M, and Salehin M. 2019. Risk Assessment Based on Fuzzy Synthetic Evaluation Method. Science of the Total Environment, 658: 818-829.
|
|
Cai T, Li X, Ding X, Wang J, and Zhan J. 2019. Flood Risk Assessment Based on Hydrodynamic Model and Fuzzy Comprehensive Evaluation with GIS Technique. International Journal of Disaster Risk Reduction, 35: 101077.
|
|
程朋根,黄毅,郭福生,周万蓬,吴静. 2022. 基于多源数据的城市洪涝灾害风险评估. 灾害学,37(3):69-76.
Cheng Penggen, Huang Yi, Guo Fusheng, Zhou Wanpeng, and Wu Jing. 2022. Urban Flooding Risk Assessment Based on Multi-source Data. Journal of Catastrophology, 37(3): 69-76.
|
|
Chen H, Xu Z, Liu Y, Huang Y, and Yang F. 2022. Urban Flood Risk Assessment Based on Dynamic Population Distribution and Fuzzy Comprehensive Evaluation. International Journal of Environmental Research and Public Health, 19(24): 16406.
|
|
丁亮,钮心毅,宋小冬. 2020. 基于个体移动轨迹的多中心城市引力模型验证. 地理学报,75(2):268-285.
Ding Liang, Niu Xinyi, and Song Xiaodong. 2020. Validating Gravity Model in Multi-Centre City: A Study Based on Individual Mobile Trajectory. Acta Geographica Sinica, 75(2): 268-285.
|
|
Dube K, Nhamo G, Chikodzi D, and Chapungu L. 2023. Mapping and Evaluating the Impact of Flood Hazards on Tourism in South African National Parks. Journal of Outdoor Recreation and Tourism, 43: 100661.
|
|
胡恒智,董强,辛辰,沈涣焕,温家洪. 2024. 上海汛期极端降雨阈值时空分布与内涝影响评估. 自然灾害学报,33(3):28-38.
Hu Hengzhi, Dong Qiang, Xin Chen, Shen Huanhuan, and Wen Jiahong. 2024. Spatial-Temporal Distribution of Extreme Rainfall Thresholds and Assessment of Urban Water Logging Impact during Flood Seasons in Shanghai. Journal of Natural Disaster, 33(3): 28-38.
|
|
黄国如,李碧琦. 2021. 基于模糊综合评价的深圳市暴雨洪涝风险评估. 水资源与水工程学报,32(1):1-6.
Huang Guoru and Li Biqi. 2021. Risk Assessment of Storm Water Fooding in Shenzhen City Based on Fuzzy Comprehensive Evaluation Method. Journal of Water Resources & Water Engineering, 32(1): 1-6.
|
|
黄晓萱,徐慧,温家洪,王丹,沈菊,田雨,杜士强. 2022. 上海市居民对城市暴雨内涝的风险感知与适应行为研究. 灾害学,37(1):192-198,219.
Huang Xiaoxuan, Xu Hui, Wen Jiahong, Wang Dan, Shen Ju, Tian Yu, and Du Shiqiang. 2022. Shanghai Residents' Perception and Adaptation Behavior of Urban Pluvial Flood Risk. Journal of Catastrophology, 37(1): 192-198, 219.
|
|
国务院办公厅. 2019. 国务院办公厅关于进一步激发文化和旅游消费潜力的意见. (2019-08-23)[2024-10-14]. https://www.gov.cn/zhengce/content/2019-08/23/content_5423809.htm.
General Office of the State Council of the People's Republic of China. 2019. Opinions on Further Stimulating Cultural and Tourism Consumption Potential. (2019-08-23) [2024-10-14]. https://www.gov.cn/zhengce/content/2019-08/23/content_5423809.htm.
|
|
孔锋,方建,乔枫雪,王瑞. 2019. 透视中国小时极端降水强度和频次的时空变化特征(1961—2013年). 长江流域资源与环境,28(12):3051-3067.
Kong Feng, Fang Jian, Qiao Fengxue, and Wang Rui. 2019. Temporal and Spatial Variation Characteristics of Intensity and Frequency of Hourly Extreme Precipitation in China from 1961 to 2013. Resources and Environment in the Yangtze Basin, 28(12): 3051-3067.
|
|
李欣. 2022. 基于引力势力范围的郑州城市多中心空间形态识别. 地理学报,77(6):1475-1489.
Li Xin. 2022. Recognition of Zhengzhou Urban Multi-Center Spatial Form Based on Influence Sphere of Gravity. Acta Geographica Sinica, 77(6): 1475-1489.
|
|
Lu S, Huang J, and Wu J. 2023. Multi-Dimensional Urban Flooding Impact Assessment Leveraging Social Media Data: A Case Study of the 2020 Guangzhou Rainstorm. Water, 15(24): 4296.
|
|
Pham Q B, Ali S A, Bielecka E, Calka B, Orych A, Parvin F, and Lupikasza E. 2022. Flood Vulnerability and Buildings' Flood Exposure Assessment in a Densely Urbanised City: Comparative Analysis of Three Scenarios Using a Neural Network Approach. Natural Hazards, 113(2): 1043-1081.
|
|
Shariat R, Roozbahani A, and Ebrahimian A. 2019. Risk Analysis of Urban Stormwater Infrastructure Systems Using Fuzzy Spatial Multi-Criteria Decision Making. Science of the Total Environment, 647: 1468-1477.
|
|
上海市水务局. 2021. 上海市城市内涝治理实施方案(2021-2025).(2021-06-30)[2024-07-30]. https://swj.sh.gov.cn/zcwj/202107 07/6aae9f9e22fa4607b0bbd85828b4c355.html.
Shanghai Water Authority. 2021. Shanghai Municipality Urban Waterlogging Management Implementation Plan (2021-2025). (2021-06-30) [2024-07-30]. https://swj.sh.gov.cn/zcwj/20210707/6aae9f9e22fa4607b0bbd85828b4c355.html.
|
|
上海市水务局,上海市规划和自然资源局. 2020. 上海市城镇雨水排水规划(2020-2035年). (2020-04-28)[2024-08-10]. https://hd.ghzyj.sh.gov.cn/hdpt/gzcy/sj/202004/t20200429_967900.html.
Shanghai Water Authority, Shanghai Municipal Bureau of Planning, and Natural Resources. 2020. Shanghai Urban Drainage Masterplan. (2020-04-28) [2024-08-10]. https://hd.ghzyj.sh.gov.cn/hdpt/gzcy/sj/202004/t20200429_967900.html.
|
|
上海市文化和旅游局,上海市广播电视局和上海市文物局. 2022. 打造“24小时活力城市”!申城夜间经济综合指数排名全国第一. (2022-09-13)[2024-10-10]. https://whlyj.sh.gov.cn/cysc/20220913/968c44ff666b4c5b9029e4b34e9e29b5.html.
Shanghai Municipal Administration of Culture and Tourism, Shanghai Municipal Administration of Radio and Television, and Shanghai Municipal Administration of Cultural Heritage. 2022. Building a '24-Hour Vibrant City'! Shanghai Ranks First in the Nation for Nighttime Economy Comprehensive Index. (2022-09-13) [2024-10-10]. https://whlyj.sh.gov.cn/cysc/20220913/968c44ff666b4c5b9029e4b34e9e29b5.html.
|
|
上海市质量技术监督局. 2017. 暴雨强度公式与设计雨型标准. 北京:中国标准出版社.
Shanghai Municipal Bureau of Quality and Technical Supervision. 2017. Standard of Rainstorm Intensity Formula and Design Rainstorm Distribution. Beijing: Standard Press of China.
|
|
Wang G, Liu Y, Hu Z, Lyu Y, Zhang G, Liu J, Liu Y, Gu Y, Huang X, Zheng H, Zhang Q, Tong Z, Hong C, and Liu L. 2020. Flood Risk Assessment Based on Fuzzy Synthetic Evaluation Method in the Beijing-Tianjin-Hebei Metropolitan Area, China. Sustainability, 12(4): 1451.
|
|
王新越,芦雪静,朱文亮. 2020. 我国主要旅游城市旅游业发展影响因素分析与评价. 经济地理,40(5):198-209.
Wang Xinyue, Lu Xuejing, and Zhu Wenliang. 2020. Analysis and Evaluation of the Influencing Factors of Tourism Development in China's Major Tourism Cities. Economic Geography, 40(5): 198-209.
|
|
王兆卫. 2017. 基于模糊评价法的城市洪涝灾害评估研究. 南京:东南大学.
Wang Zhaowei. 2017. The Urban Flood Disaster Assessment Research Based on Fuzzy Evaluation Method. Nanjing: Southeast University.
|
|
吴国凤,刘青,许瀚卿,魏旭辰,王军. 2024. 海平面上升情景下沿海城市极端雨潮复合洪涝危险性评估——以海口市为例. 热带地理,44(6):1025-1035.
Wu Guofeng, Liu Qing, Xu Hanqing, Wei Xuchen, and Wang Jun. 2024. Risk Assessment of Extreme Rainfall and Storm Surge Compound Flooding in Coastal Cities under Sea Level Rise Scenarios: A Case Study of Haikou City. Tropical Geography, 44(6): 1025-1035.
|
|
Xu H, Ma C, Lian J, Xu K, and Chaima E. 2018. Urban Flooding Risk Assessment Based on an Integrated K-Means Cluster Algorithm and Improved Entropy Weight Method in the Region of Haikou, China. Journal of Hydrology, 563: 975-986.
|
|
徐宗学,陈浩,任梅芳,程涛. 2020. 中国城市洪涝致灾机理与风险评估研究进展. 水科学进展,31(5):713-724.
Xu Zongxue, Chen Hao, Ren Meifang, and Cheng Tao. 2020. Progress on Disaster Mechanism and Risk Assessment of Urban Flood/Waterlogging Disasters in China. Advances in Water Science, 31(5): 713-724.
|
|
徐宗学,叶陈雷. 2021. 城市暴雨洪涝模拟:原理、模型与展望. 水利学报,52(4):381-392.
Xu Zongxue and Ye Chenlei. 2021. Simulation of Urban Flooding/Waterlogging Processes: Principle, Models and Prospects. Journal of Hydraulic Engineering, 54(2): 381-392.
|
|
严正宵,夏军,宋进喜,赵玲玲,庞国伟. 2020. 中小流域设计暴雨雨型研究进展. 地理科学进展,39(7):1224-1235.
Yan Zhengxiao, Xia Jun, Song Jinxi, Zhao Lingling, and Pang Guowei. 2020. Research Progress on Design Hyetographs in Small and Medium-Scale Basins. Progress in Geography, 39(7): 1224-1235.
|
|
Yang J and Huang X. 2021. The 30m Annual Land Cover Dataset and Its Dynamics in China from 1990 to 2019. Earth System Science Data, 13(8): 3907-3925.
|
|
Yang W, Xu K, Lian J, Bin L, and Ma C. 2018. Multiple Flood Vulnerability Assessment Approach Based on Fuzzy Comprehensive Evaluation Method and Coordinated Development Degree Model. Journal of Environmental Management, 213: 440-450.
|
|
Yin J, Yu D, and Liao B, 2021. A City-Scale Assessment of Emergency Response Accessibility to Vulnerable Populations and Facilities under Normal and Pluvial Flood Conditions for Shanghai, China. Environment and Planning B: Urban Analytics and City Science, 48(8): 2239-2253.
|
|
Yin J, Yu D, Yin Z, Liu M, and He Q. 2016. Evaluating the Impact and Risk of Pluvial Flash Flood on Intra-Urban Road Network: A Case Study in the City Center of Shanghai, China. Journal of Hydrology, 537: 138-145.
|
|
Zhang L, Zhang L and Liu X. 2022. Evaluation of Urban Spatial Growth Performance from the Perspective of a Polycentric City: A Case Study of Hangzhou. Land, 11(8): 1173.
|
|
张会,李铖,程炯,吴志峰,吴艳艳. 2019. 基于“H-E-V”框架的城市洪涝风险评估研究进展. 地理科学进展,38(2):175-190.
Zhang Hui, Li Cheng, Cheng Jiong, Wu Zhifeng, and Wu Yanyan. 2019. A Review of Urban Flood Risk Assessment Based on the Framework of Hazard-Exposure-Vulnerability. Progress in Geography, 38(2): 175-190.
|
|
中华人民共和国住房和城乡建设部,中华人民共和国国家质量监督检验检疫总局. 2017. 城镇内涝防治技术规范. 北京:中国计划出版社.
Ministry of Housing and Urban-Rural Development of the People's Republic of China, and General Administration of Quality Supervision, Inspection and Quarantine of the People's Republic of China. 2017. Technical Code for Urban Flooding Prevention and Control. Beijing: China Planning Press.
|
|
中华人民共和国水利部. 2017. 洪水风险图编制导则. 北京:中国计划出版社.
Ministry of Water Resources of the People's Republic of China. 2017. Guidelines for Flood Risk Mapping. Beijing: China Planning Press.
|
/
| 〈 |
|
〉 |