
多尺度道路网络特征对交通事故的非线性效应研究
周芳羽:数据整理、方法设计、图表绘制、初稿撰写;
谢 波:提出研究思路、研究指导、文稿审阅与修改;
肖扬谋:结果验证、文稿审阅与修改。
|
周芳羽(1999—),女,山东烟台人,硕士研究生,主要从事城市交通安全与土地利用规划研究,(E-mail)fangyuzhou@whu.edu.cn; |
收稿日期: 2024-11-26
修回日期: 2025-01-09
网络出版日期: 2025-09-01
基金资助
国家自然科学基金项目(42371252)
国家自然科学基金项目(41971179)
Nonlinear Effects of Multiscale Road Network Features on Traffic Accidents
Received date: 2024-11-26
Revised date: 2025-01-09
Online published: 2025-09-01
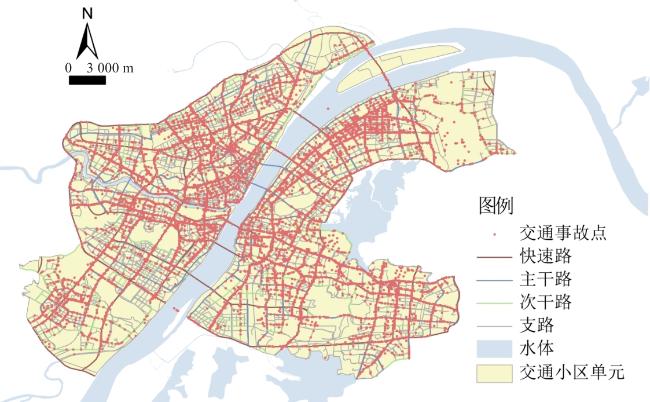
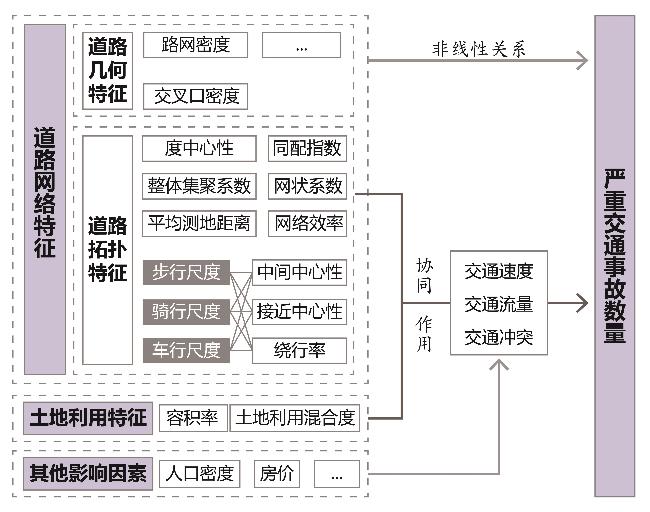
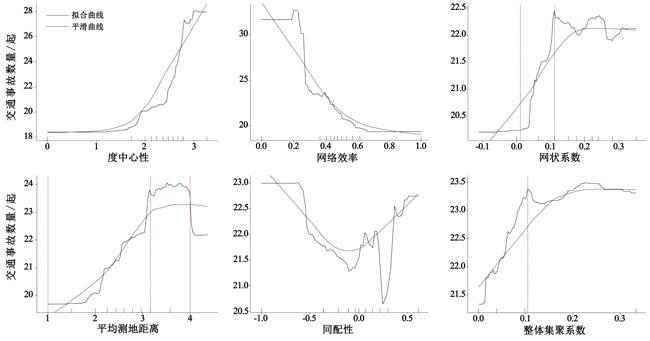
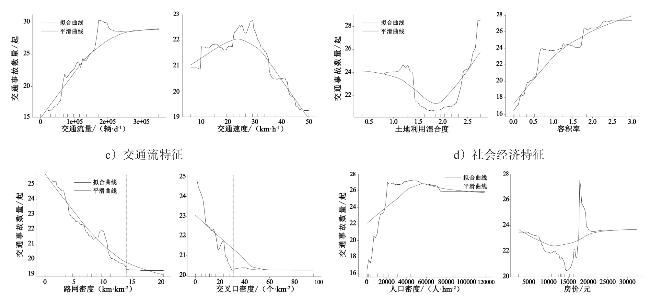
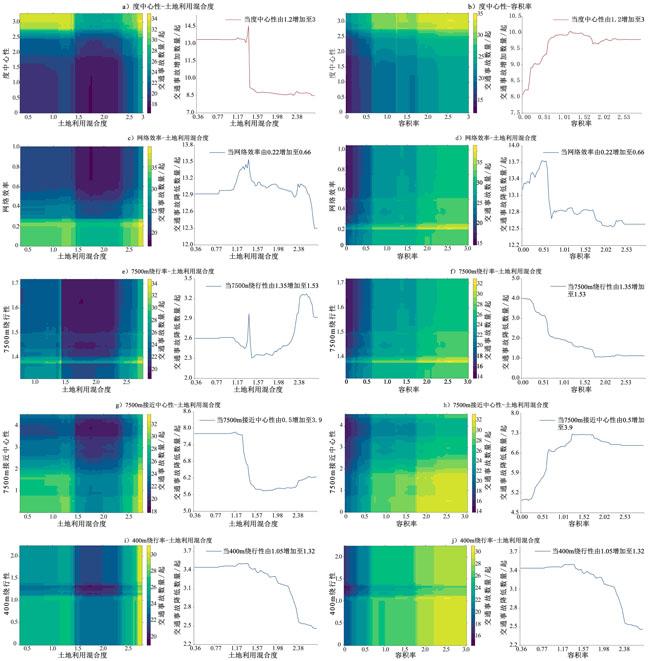
机动交通快速发展背景下,城市道路交通安全问题日益严峻。道路网络作为道路交通系统的基础骨架,其特征对交通事故的发生具有重要影响。然而当前研究在探讨城市道路网络对交通事故的非线性影响及尺度效应方面有所不足。对此,文章以武汉市主城区为研究区,运用梯度提升决策树模型,分析多尺度道路网络的几何拓扑特征与交通事故的非线性关系,并鉴别土地利用与道路网络对交通事故的协同效应。研究发现,城市道路网络的几何拓扑特征与交通事故数量存在显著非线性关系和阈值效应,表现为平均测地距离、网状系数及整体集聚系数与交通事故数量呈非线性正相关,同配性指数呈“U型”关系,以及路网密度和交叉口密度呈非线性负相关。同时,接近中心性、中间中心性及绕行率与交通事故的非线性关系在不同空间尺度呈差异性。土地利用与道路网络在影响交通事故方面表现出复杂的协同效应,适度的土地利用混合度可降低交通事故风险,但过高的土地利用混合度和容积率可能带来负面效应。
周芳羽 , 谢波 , 肖扬谋 . 多尺度道路网络特征对交通事故的非线性效应研究[J]. 热带地理, 2025 , 45(8) : 1344 -1357 . DOI: 10.13284/j.cnki.rddl.20240777
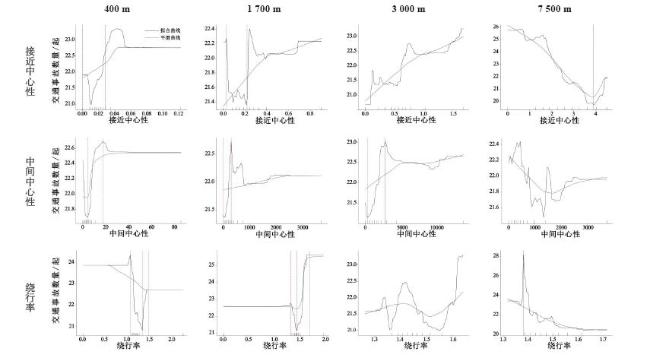
Amidst rapid motorization, urban road traffic safety has become increasingly critical. As a fundamental framework of traffic systems, road networks strongly influence the occurrence of traffic accidents. The impacts of urban road networks on traffic accidents exhibit considerable spatial heterogeneity. However, the nonlinear relationship between road networks and traffic accidents, and the moderating effect of land use, have been overlooked. We focused on the main urban area of Wuhan and used a Gradient Boosting Decision Tree model (GBDT) to explore the nonlinear relationships between road networks and traffic accidents, while also identifying the synergistic effects of land use and road networks on traffic accidents. The geometric and topological features of urban road networks generally have nonlinear and threshold effects on traffic accidents. The total contribution rate of road network characteristics to traffic accidents reached 51.2%, highlighting their key role in traffic accidents. Average geodesic distance, mesh density, and global clustering coefficient showed a nonlinear positive correlation with traffic accidents. Meanwhile, the density of the road network and the density of intersections showed a nonlinear negative correlation with traffic accidents. The assortativity index showed a nonlinear U-shaped relationship with traffic accidents. Closeness centrality, betweenness centrality, and detour rate have nonlinear effects on traffic accidents, with spatial scale differences observed at 400, 1 700, 3 000, and 7 500 m. The influence of the 7 500 m scale is greater. In terms of near centrality, there is a nonlinear positive correlation and threshold effect between near centrality at the 400 and 1 700 m scales and the number of traffic accidents. In contrast, the near-centrality at the 3 000 m scale has an approximate linear positive correlation with the number of traffic accidents. Meanwhile, the near-centrality at the 7 500 m scale has a right-biased U-shaped relationship. For the betweenness centrality, the betweenness centrality of 400, 1 700, and 3 000 m scales also showed a nonlinear positive correlation and threshold effect. However, the betweenness centrality of 7 500 m scale and the number of traffic accidents showed a U-shaped relationship. In terms of the detour rate, there is a nonlinear negative correlation and threshold effect between the detour rate at the 400 m and 7 500 m scales and the number of traffic accidents. There is a non-linear positive correlation and threshold effect between the detour rate of 1 700 and 3 000 m and the number of traffic accidents. Land use and road networks exhibit complex synergistic effects on traffic accidents. First, moderate land use mixing produces positive traffic safety benefits under the combined effects of road networks. However, when the land-use mixing degree exceeds a certain threshold, excessive mixing reduces the positive traffic safety benefits caused by road networks. Second, there was a positive correlation between floor area ratio and traffic flow. Increasing the floor area ratio may inhibit the positive effect of road network characteristics on traffic safety. However, on a global scale, traffic flow in a high plot ratio area may be more positively affected by the optimization of road network characteristics, thus reducing the risk of traffic accidents. This study used machine-learning methods to examine the nonlinear relationships between urban road network characteristics and traffic accidents. By identifying nonlinear, scale, and threshold effects, this study overcomes the limitations of traditional studies. It not only enriches the dimensions and depth of research on the relationships between road networks and traffic accidents, but also accurately identifies the thresholds of key road network indicators, providing strong support for the in-depth analysis of the driving mechanisms behind traffic accidents. This study further investigated the synergistic effects of urban land use and road networks on traffic accidents and proposed collaborative optimization strategies. These strategies offer theoretical guidance and technical support for urban road traffic planning and contribute to the enhancement of urban traffic safety.
表1 道路网络变量名称、内涵及计算公式Table 1 Road network variable names, connotations and calculation formulas |
| 变量名称 | 变量内涵 | 计算公式 |
|---|---|---|
| 度中心性 | 度中心性反映网络中某一节点的重要程度(Kamel & Sayed, 2020),即与该节点相连接的路段数量,可用于体现交通小区内道路交叉口的平均岔口数。 | (5) 式中: 表示节点i的度中心度,用于计算节点i与其他g-1个j节点之间的直接联系的数量; 表示i节点与j节点相连的路段数量。 |
| 接近 中心性 | 接近中心性体现网络中某一节点与其他节点的 邻近程度(Freeman, 1979),即从出发点到目的 地的难易程度。 | (6) 式中: 为链段x与链段y之间的最短路径距离; 为链段x在搜索半径内的所能联系的链段数量; 为搜索半径与路段长度的之比。 |
| 中间 中心性 | 中间中心性反映网络中某一节点或连线的重要性, 在道路网络中体现为任意起讫点间的交通出行是否 将某些道路作为出行的必经之路(宋小冬 等,2020)。 | (7) 式中: 是节点i的中间中心性; 是节点j和k经过节点i的最短路径的数量; 表示点i随机落在的节点j和k最短路径上的概率。 |
| 网状系数 | 网状系数为网络中实际圈数和最大圈数的比值, 可衡量道路网络的连通性。 | (8) 式中:e表示网络中的链段数;v表示节点数。 |
| 绕行性 | 绕行性为网络中某对起止点间的实际网络距离与 直线距离之比,常通过绕行率衡量,即测地距离与 欧几里得距离之比。 | (9) 式中: 是节点i的绕行率; 是节点i和j之间的测地距离; 是节点i和j之间的欧几里得距离。 |
| 网络 效率 | 节点对的网络效率定义为节点间最短路径距离的 倒数(Hagberg et al., 2008)。 | (10) 式中:N为网络节点数; 为节点i与j的最短路径距离。 |
| 平均测地 距离 | 平均测地距离即为网络中任意2个节点之间最短 路径的边数的平均值(Zhang et al., 2015)。 | (11) 式中:N为网络节点数; 为节点i与j的测地距离。 |
| 集聚 系数 | 集聚系数定义为网络中某一节点与相邻节点之间的 实际连接数目占最大可能连接边数的比例,区域内 所有节点集聚系数的平均值即为整体集聚系数, 反映集群性。 | (12) 式中: 为i节点的集聚系数; 为i节点的节点度; 为节点i的邻节点间实际存在的边数。 |
| 同配 指数 | 一个节点倾向于与具有相同度的其他节点相连 (Newman, 2002),这种特性被称为同配性,反之 则称为异配性,可通过同配指数衡量。 | (13) 式中: 是元素为 的矩阵; 和 分别是连接到类型 顶点的每条边的端点的比例。当不存在同配性时, ;当完全相同时, ,反之 。 |
| 交叉口 密度 | 交叉口密度通过交通小区内的交叉口数量与交通 小区面积的比值所计算。 | (14) 式中: 表示第i个交通小区的道路交叉口数量; 表示第i个交通小区的面积。 |
| 路网 密度 | 路网密度通过交通小区内的道路长度与交通小区 面积的比值所计算。 | (15) 式中: 和 分别表示第i个交通小区的道路长度和面积。 |
表2 变量特征Table 2 Variable characteristics |
| 类型 | 变量名称 | 最小值 | 最大值 | 平均值 | 标准差 | 变量描述 | ||
|---|---|---|---|---|---|---|---|---|
| 交通事故 | 严重交通事故数/起 | 0 | 231 | 22.16 | 20.12 | TAZ内发生的严重交通事故数 | ||
| 道路网络特征 | 拓扑特征 | 度中心性 | 0 | 3.26 | 2.3 | 0.43 | TAZ中各节点度的平均值 | |
| 中间中心性 | 400 m | 0 | 51.27 | 6.04 | 7.42 | 分别表示在400、1 700、3 000和7 500 m搜索半径下,TAZ中各路段中间中心性的平均值 | ||
| 1 700 m | 0 | 3 403.18 | 380.29 | 455.35 | ||||
| 3 000 m | 0 | 11 666 | 1 989.12 | 1 951.43 | ||||
| 7 500 m | 0 | 150 935 | 31 394.29 | 28 500.94 | ||||
| 接近中心性 | 400 m | 0 | 0.08 | 0.02 | 0.01 | 分别表示在400、1 700、3 000和7 500 m搜索半径下,TAZ中某一节点与其他节点的邻近程度 | ||
| 1 700 m | 0 | 0.9 | 0.23 | 0.14 | ||||
| 3 000 m | 0 | 1.68 | 0.59 | 0.31 | ||||
| 7 500 m | 0 | 4.52 | 2.59 | 1.04 | ||||
| 绕行性 | 400 m绕行率 | 0 | 1.56 | 1.17 | 0.12 | 分别表示在400、1 700、3 000和7 500 m搜索半径下,TAZ中某对起止点之间的最短网络距离与欧几里得距离之比 | ||
| 1 700 m绕行率 | 0 | 1.93 | 1.39 | 0.11 | ||||
| 3 000 m绕行率 | 0 | 1.73 | 1.49 | 0.92 | ||||
| 7 500 m绕行率 | 0 | 1.83 | 1.49 | 0.19 | ||||
| 网络效率 | 0 | 1 | 0.49 | 0.11 | TAZ中任意节点之间最短路径距离的倒数的平均值 | |||
| 平均测地距离 | 0 | 5.39 | 1.71 | 3.52 | TAZ中单一节点到另一节点最短链路数的平均值 | |||
| 同配指数 | -0.66 | 0.61 | -0.01 | 0.26 | TAZ中节点度数的相似程度 | |||
| 网状系数 | 0 | 0.35 | 0.15 | 0.1 | TAZ中实际圈数和最大圈数的比值 | |||
| 整体集聚系数 | 0 | 0.27 | 0.02 | 0.05 | TAZ中单一节点与所有其他节点归一化链接数的平均值 | |||
| 几何 特征 | 路网密度/(km·km-2) | 0 | 20.42 | 7.37 | 3.14 | 道路总长度与TAZ面积的比值 | ||
| 交叉口密度/(个·km-2) | 0 | 96 | 19.22 | 14.54 | 交叉口数量与TAZ面积的比值 | |||
| 土地利用 特征 | 土地利用类型混合度 | 0 | 2.76 | 1.82 | 0.39 | TAZ内土地利用的香农多样性指数 | ||
| 容积率 | 0 | 3 | 0.86 | 0.68 | TAZ内地上建筑物的总建筑面积与基底面积的比值 | |||
| 交通流 特征 | 交通流量/(辆·d-1) | 0 | 352 628 | 95 000.21 | 62 658.18 | 武汉市2 015年TAZ内主要道路年平均日交通流量 | ||
| 交通速度/(km·h-1) | 6.15 | 50 | 26.55 | 8.6 | 武汉市2 015年TAZ内主要道路机动车平均行驶速度 | |||
| 社会经济 特征 | 房价/元 | 0 | 32 432 | 13 001.87 | 3 275.11 | 武汉市2 015年TAZ内房价均值 | ||
| 人口密度/(人·hm-2) | 0 | 94 644 | 17 334 | 19 261 | 居住人口数量与TAZ面积的比值 | |||
表3 自变量的相对重要性排名Table 3 Ranking of relative importance of independent variables |
| 变量 | 指标 | 相对重要性/% | 排名 | 总贡献度/% | |
|---|---|---|---|---|---|
| 交通流 特征 | 交通流量 | 10.3 | 1 | 13.5 | |
| 交通速度 | 3.2 | 12 | |||
| 土地利用 特征 | 土地利用混合度 | 7.5 | 3 | 14 | |
| 容积率 | 6.5 | 4 | |||
| 社会经济 特征 | 人口密度 | 9.4 | 2 | 15.9 | |
| 房价 | 6.5 | 5 | |||
| 道路网络特征 | 拓扑特征 | 度中心性 | 5.9 | 6 | 51.2 |
| 7 500 m绕行率 | 4.8 | 7 | |||
| 网络效率 | 4.6 | 8 | |||
| 7 500 m接近中心性 | 4.6 | 9 | |||
| 400 m绕行率 | 3.6 | 10 | |||
| 平均测地距离 | 3.3 | 11 | |||
| 同配指数 | 3.1 | 13 | |||
| 1 700 m绕行率 | 2.9 | 15 | |||
| 3 000 m绕行率 | 2.8 | 16 | |||
| 7 500 m中间中心性 | 2.1 | 18 | |||
| 3 000 m接近中心性 | 2.1 | 19 | |||
| 网状系数 | 2 | 20 | |||
| 400 m接近中心性 | 1.7 | 21 | |||
| 整体集聚系数 | 1.6 | 22 | |||
| 1 700 m中间中心性 | 1.5 | 23 | |||
| 3 000 m中间中心性 | 1.5 | 24 | |||
| 400 m中间中心性 | 1.5 | 25 | |||
| 1 700 m接近中心性 | 1.4 | 26 | |||
| 几何 特征 | 路网密度 | 3.1 | 14 | 5.4 | |
| 交叉口密度 | 2.3 | 17 | |||
1 https://wuhan.anjuke.com/
|
Amoh-Gyimah R, Saberi M, and Sarvi M. 2016. Macroscopic Modeling of Pedestrian and Bicycle Crashes: A Cross-Comparison of Estimation Methods. Accident Analysis and Prevention, 93: 147-159.
|
|
Berrigan D, Pickle L, and Dill J. 2010. Associations between Street Connectivity and Active Transportation. International Journal of Health Geographics, 9: 20.
|
|
Bhatia R and Wier M. 2011. "Safety in Numbers" Re-Examined: Can We Make Valid or Practical Inferences from Available Evidence? Accident Analysis and Prevention, 43: 235-240.
|
|
Boeing G. 2019. The Morphology and Circuity of Walkable and Drivable Street Networks. In: Luca D'Acci. The Mathematics of Urban Morphology. Cham: Springer International Publishing, 271-287.
|
|
Cooper C and Chiaradia A. 2020. SDNA: 3-d Spatial Network Analysis for GIS, CAD, Command Line & Python. SoftwareX, 12: 100525.
|
|
Ding C, Chen P, and Jiao J. 2018. Non-Linear Effects of the Built Environment on Automobile-Involved Pedestrian Crash Frequency: A Machine Learning Approach. Accident Analysis and Prevention, 112: 116-126.
|
|
Ewing R and Dumbaugh E. 2009. The Built Environment and Traffic Safety: A Review of Empirical Evidence. Journal of Planning Literature, 23: 347-367.
|
|
Ewing R and Cervero R. 2010. Travel and the Built Environment. Journal of the American Planning Association, 76: 265-294.
|
|
Freeman L. 1979. Centrality in Social Networks Conceptual Clarification. Social Networks, 1: 215-239.
|
|
Friedman J. 2001. Greedy Function Approximation: A Gradient Boosting Machine. Annals of Statistics, 29: 1189-1232.
|
|
Friedman J. 2002. Stochastic Gradient Boosting. Computational Statistics & Data Analysis, 38: 367-378.
|
|
Hagberg A, Schult D, and Swart P. 2008. Exploring Network Structure, Dynamics, and Function Using Networkx. (2008-09-22) [2024-02-25]. http://pdfs.semanticscholar.org/0621/4a0cf38875da38586e81539890f7ad8aeb1c.pdf.
|
|
Hastie T, Tibshirani R, and Friedman J. 2009. The Elements of Statistical Learning: Data Mining, Inference, and Prediction. Cham: Springer International Publishing.
|
|
Kamel M and Sayed T. 2020. The Impact of Bike Network Indicators on Bike Kilometers Traveled and Bike Safety: A Network Theory Approach. Environment and Planning B-Urban Analytics and City Science, 48: 2055-2072.
|
|
毛蒋兴,阎小培. 2002. 我国城市交通系统与土地利用互动关系研究述评. 城市规划汇刊,(4):34-37,79.
Mao Jiangxing and Yan Xiaopei. 2002. Review on the Interaction between Urban Transport System and Land Use in China. Urban Planning Review, (4): 34-37, 79.
|
|
Marshall W and Garrick N. 2010a. Street Network Types and Road Safety: A Study of 24 California Cities. Urban Design International, 15: 133-147.
|
|
Marshall W and Garrick N. 2010b. Effect of Street Network Design on Walking and Biking. Transportation Research Record, 2198: 103-115.
|
|
Marshall W and Garrick N. 2011. Does Street Network Design Affect Traffic Safety? Accident Analysis and Prevention, 43: 769-781.
|
|
Moeinaddini M, Asadi-Shekari Z, and Zaly Shan M. 2014. The Relationship between Urban Street Networks and the Number of Transport Fatalities at the City Level. Safety Science, 62: 114-120.
|
|
Newman M. 2002. Assortative Mixing in Networks. Physical Review Letters, 89: 208701.
|
|
潘海啸,沈青,张明. 2009. 城市形态对居民出行的影响——上海实例研究. 城市交通,7(6):28-32,49.
Pan Haixiao, Shen Qing, and Zhang Ming. 2009. Impacts of Urban Forms on Travel Behavior: Case Studies in Shanghai. Urban Transport of China, 7(6): 28-32, 49.
|
|
庞哲,谢波. 2023. 城市土地利用对交通事故的作用机制研究——以武汉市为例//中国城市规划学会. 人民城市,规划赋能——2023中国城市规划年会论文集(06城市交通规划). 武汉:武汉大学城市设计学院,175-187.
Pang Zhe and Xie Bo. 2023. Research on the Mechanism of Urban Land Use on Traffic Accidents—A Case Study of Wuhan City. In: Urban Planning Society of China. People's Cities, Planning Empowerment—Proceedings of the 2023 China Urban Planning Annual Conference(06 Urban Transport Planning). Wuhan: School of Urban Design of Wuhan University, 175-187.
|
|
Ridgeway G. 2024. Generalized Boosted Models: A Guide to the Gbm Package. (2024-06-26) [2024-07-01]. https://cran.r-project.org/web/packages/gbm/vignettes/gbm.pdf.
|
|
Rifaat S, Tay R, Perez A, and Barros A. 2009. Effects of Neighborhood Street Patterns on Traffic Collision Frequency. Journal of Transportation Safety & Security, 1: 241-253.
|
|
Saha D, Alluri P, and Gan A. 2015. Prioritizing Highway Safety Manual's Crash Prediction Variables Using Boosted Regression Trees. Accident Analysis & Prevention, 79: 133-144.
|
|
Saha D and Dumbaugh E. 2021. Use of a Model-Based Gradient Boosting Framework to Assess Spatial and Non-Linear Effects of Variables on Pedestrian Crash Frequency at Macro-Level. Journal of Transportation Safety & Security, 14: 1419-1450.
|
|
Sarkar C, Webster C, and Kumari S. 2018. Street Morphology and Severity of Road Casualties: A 5-Year Study of Greater London. International Journal of Sustainable Transportation, 12: 510-525.
|
|
宋小冬,陶颖,潘洁雯,肖扬. 2020. 城市街道网络分析方法比较研究:以Space Syntax、sDNA和UNA为例. 城市规划学刊,(2):19-24.
Song Xiaodong, Tao Ying, Pan Jiewen, and Xiao Yang. 2020. A Comparison of Analytical Methods for Urban Street Network: Taking Space Syntax, sDNA and UNA as Examples. Urban Planning Forum, (2): 19-24.
|
|
王成,谢波. 2020. 土地利用视角下城市交通事故驱动机理的研究进展. 地理科学进展,39(9):1597-1606.
Wang Cheng and Xie Bo. 2020. Research Progress on the Driving Mechanism of Traffic Accidents from the Perspective of Land Use. Progress in Geography, 39(9): 1597-1606.
|
|
王雪松,游世凯. 2014. 基于多项罗吉特模型的路网形态判别. 同济大学学报(自然科学版),42(1):64-70.
Wang Xuesong and You Shikai. 2014. Street Patterns Distinction Based on Logit Model. Journal of Tongji University(Natural Science), 42(1): 64-70.
|
|
Wang X, Yuan J, Schultz G, and Fang S. 2018. Investigating the Safety Impact of Roadway Network Features of Suburban Arterials in Shanghai. Accident Analysis & Prevention, 113: 137-148.
|
|
Weichenthal S, Ryswyk VK, Kulka R, Sun L, Wallace L, and Joseph L. 2015. In-Vehicle Exposures to Particulate Air Pollution in Canadian Metropolitan Areas: the Urban Transportation Exposure Study. Environmental Science & Technology, 49: 597-605.
|
|
肖扬谋,谢波,庞哲. 2023. 城市道路网络特征对交通事故的作用机理研究. 南方建筑,(4):61-68.
Xiao Yangmou, Xie Bo, and Pang Zhe. 2023. Urban Road Network Characteristics and Their Influence on Traffic Accidents. South Architecture, (4): 61-68.
|
|
谢波,南贤淑. 2018. 城市土地利用对交通事故的影响与规划调控——以武汉市为例//中国城市规划年会. 共享与品质——2018中国城市规划年会论文集(05城市规划新技术应用). 武汉:武汉大学,1262-1279.
Xie Bo and Nan Xianshu. 2018. The Influence of Urban Land-Use on Traffic Crashes—A Case of Wuhan. In: Urban Planning Society of China. Sharing and Quality—Proceedings of 2018 China Urban Planning Annual Conference(05 Application of New Technologies in Urban Planning). Wuhan: Wuhan University, 1262-1279.
|
|
谢波,肖扬谋. 2022. 城市道路网络特征对交通事故作用机理的研究进展. 地理科学进展,41(10):1956-1968.
Xie Bo and Xiao Yangmou. 2022. Progress of Research on the Mechanism of Impact of Urban Road Network Characteristics on Traffic Accidents. Progress in Geography, 41(10): 1956-1968.
|
|
邢璐,孙健敏,尹奎,王震. 2018. “过犹不及”效应及其作用机制. 心理科学进展,26(4):719-730.
Xing Lu, Sun Jianmin, Yin Kui, and Wang Zhen. 2018. The Too-Much-of-a-Good-Thing Effect and Its Mechanisms. Advances in Psychological Science, 26(4): 719-730.
|
|
Zeng Q and Huang H. 2014. Bayesian Spatial Joint Modeling of Traffic Crashes on an Urban Road Network. Accident Analysis & Prevention, 67: 105-112.
|
|
Zhang Y, Bigham J, Ragland D, and Chen X. 2015. Investigating the Associations between Road Network Structure and Non-Motorist Accidents. Journal of Transport Geography, 42: 34-47.
|
|
郑依玲,谢波,南贤淑,安子豪. 2020. 城市土地利用对交通事故的影响因素与作用机制研究——以武汉市为例. 现代城市研究,(2):42-49.
Zheng Yiling, Xie Bo, Nan Xianshu, and An Zihao. 2020. The Impact Factor and Mechanism of Urban Land Use on Traffic Accidents: A Case Study of Wuhan City. Modern Urban Research, (2): 42-49.
|
|
中共中央 国务院. 2016. “健康中国2030”规划纲要. (2016-10-25)[2024-02-25]. https://www.sport.gov.cn/gdnps/files/c25531179/25531211.pdf.
The State Council of the People's Republic of China. 2016. "Healthy China 2030" Plan Outline. (2016-10-25) [2024-02-25]. https://www.sport.gov.cn/gdnps/files/c25531179/25531211.pdf.
|
/
| 〈 |
|
〉 |