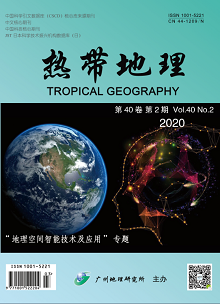
Plant nutrient status is a comprehensive response to soil nutrient supply, crop nutrient demand, and crop nutrient abilities. Detecting variations in plant nutrient content is an important aspect of forest management. However, conventional chemical analysis techniques are often time and labor intensive, particularly when applied over large areas. In recent years, some convenient and non-destructive tools have been applied to monitor plant biochemical properties; however, there is no agreement about which methods are most reliable. Among the available methods, some employ hyperspectral data to nondestructively estimate levels of nitrogen, phosphorus, and potassium in plants, thus providing a theoretical framework to support scientific forest management. Certain optical characteristics in the visible and near-infrared regions are closely associated with the absorption features of chlorophyll, other pigments, water, and chemicals in leaves and canopies. However, the efficacy of utilizing spectral data to detect various nutrient parameters is dependent on the data processing methods employed. In this study, we applied near-infrared spectroscopy to examine the leaves of nineteen wetland forest species and assessed various models’ performances in estimating Total Nitrogen (TN), Total Phosphorus (TP) and Total Potassium (TK) content in the vegetation. Eleven spectral preprocessing methods and three spectral data dimensionality reduction methods were used to preprocess the spectra. And two of algorithms, the Partial Least Squares Regression (PLSR) and Support Vector Machine Regression (SVR), were used to develop the nutrients prediction models. The determination coefficients (R 2) and Root Mean Square Error (RMSE) of the models were used to evaluate the performance of the models for calibration, cross validation and prediction datasets. The Relative Percent Difference (RPD) for the prediction dataset was also used to assess the models. Results showed that the Standard Normal Variate (SNV) approach combined with the first derivative (1 st) preprocessing method had the highest accuracy among the 11 data pretreatment approaches, with RPD values of 2.35, 2.39, and 2.45 for TN, TP, and TK, respectively. Among the different dimensional-reduction methods, the Principal Component Analysis (PCA) performed the best, and SVR outperformed PLSR in parameter estimation. Models incorporating the SVR algorithm and data preprocessed using the SNV+1 st approach yielded the best prediction results for the three parameters. The best model for TN had ${R^{2}}_{p}$, RMSEp, and RPD values of 0.85, 2.82% and 2.50, respectively; best model for TP had ${R^{2}}_{p}$, RMSEp, and RPD values of 0.90, 0.55%, and 2.83, respectively; and best model for TK had ${R^{2}}_{p}$, RMSEp, and RFD values of 0.85, 3.80%, and 2.60, respectively. The results indicated that visible and near-infrared spectra can be used to estimate the leaf TN, TP, and TK content of wetland trees. However, before model calibration, the proper preprocessing of the spectral data is necessary to improve the performance of the models.
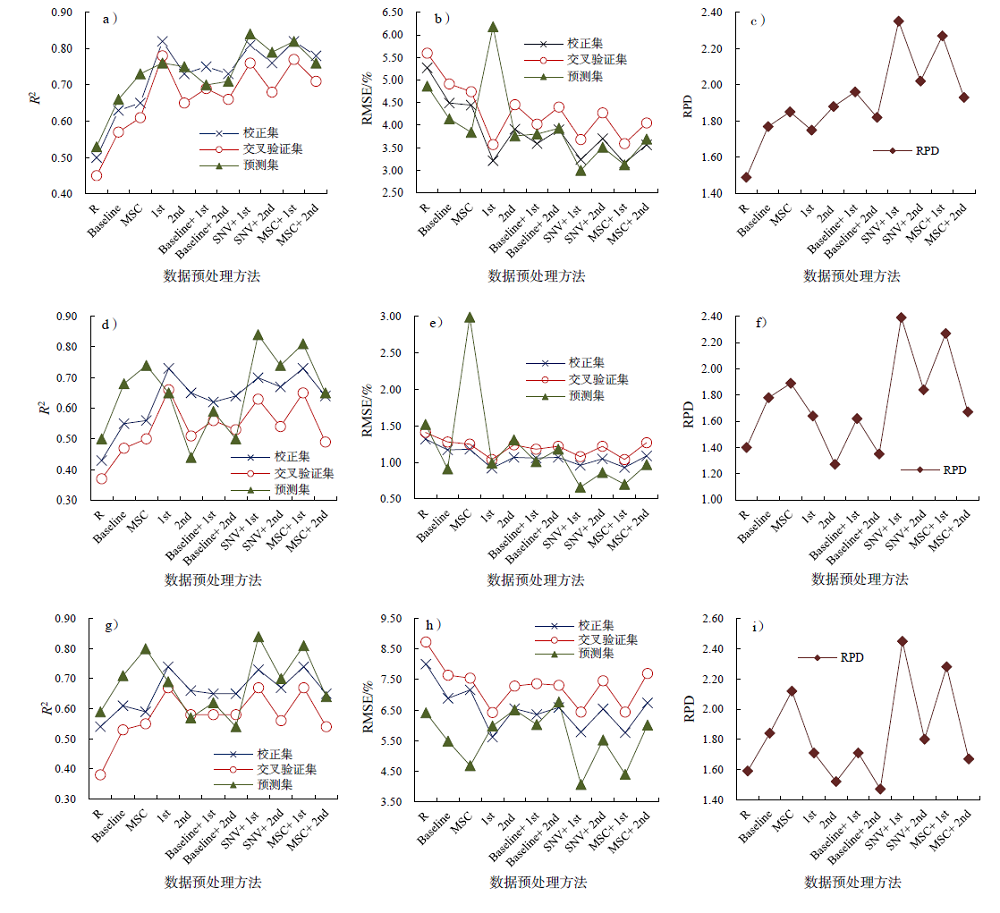
In recent years, many studies on the application of Volunteered Geographic Information (VGI) to natural disaster management have been reported. To date, it has been shown that VGI can provide big geospatial data, incorporating rich content and extensive spatiotemporal coverage, in a real-time and cost-effective manner. Thus, it can facilitate disaster management by filling information voids known to occur in traditional geospatial datasets. However, existing studies have mostly focused on disaster prevention, preparedness, and response phases, and few studies have focused on post-disaster recovery. The aim of the proposed work is to help bridge this research gap by investigating how VGI data can facilitate post-disaster recovery monitoring, both in general, and for specific aspects such as tourism, business, industry, and the daily routines of residents. In the work reported here, we first review the development of VGI research in the decade since 2007, and then propose a research framework for post-disaster recovery monitoring, based on VGI data. The research framework involves three key components—data acquisition, data quality control, and data mining. Data acquisition is generally referred to as VGI collection (for example, OpenStreetMap, Twitter, and Flickr data), while authoritative data (such as remote sensing data, official statistics, and field survey data) can be collected as ancillary information. Data quality control is based on a fuzzy expert system, which considers Linus’ law, metadata, data lineage and provenance, geographic contexts (Tobler’s first law of geography), user credibility, spatiotemporal data density, and user activeness, and leverages artificial neural networks (deep learning) for optimizing the fuzzy rule sets of the expert system. Data mining is based on the transformative paradigm, using a combination of quantitative and qualitative approaches, involving text mining, spatial statistics, and machine learning. Using this combination, the status of infrastructure (roads, electricity, water, transport, housing, buildings, and telecoms), the economy (external sources of economy, internal sources of economy, and services), and safety (reputation, secondary disasters, health, security, and stability), which are the three main measures of post-disaster recovery, are investigated. This work thus paves a way for future studies related to this topic, identifying both research and practical implications. We also identify limitations in using VGI for post-disaster recovery management. The first of these is that a VGI source may rapidly become obsolete due to the fast development of cyberspace, making it imperative for researchers to keep the technique up-to-date, adapting it to the diverse and emerging VGI sources. The second limitation is that certain VGI platforms do not provide all the data available in their databases, and have imposed constraints on their Application Programing Interfaces (APIs). The third limitation is related to privacy issues pertinent to VGI data use. We suggest that the future work should also focus on seamlessly integrating VGI with traditional post-disaster recovery monitoring approaches, such as remote sensing, field surveys, and resident interviews.
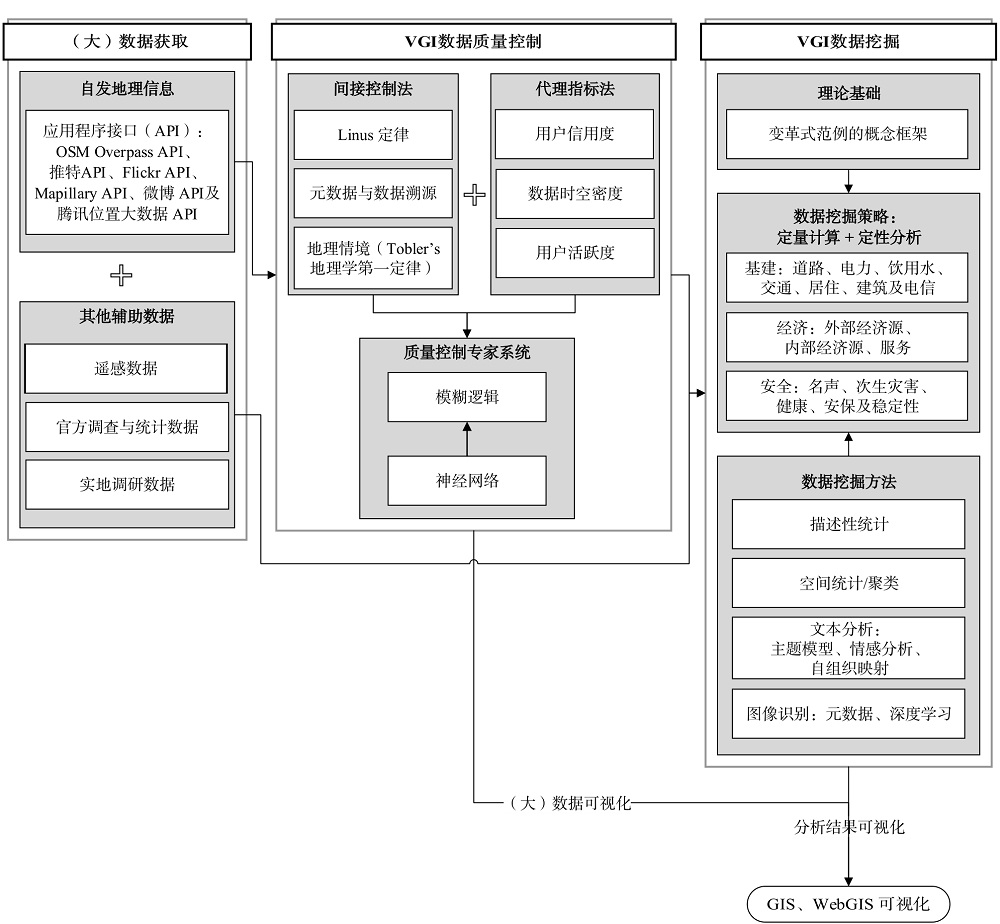
During the last 10 years, aviation demand in China grew faster than transport capacity, leading to the intensification of the conflict between airspace capacity and flight flow and causing significant route congestion and flight delays. The Beijing-Guangzhou air corridor is considered the core component of the “inverted N-shaped north-south frame” of China’s air corridor pattern. In this study, a multi-level measurement framework that includes delay, duration-delay and accumulation-delay elasticity coefficient was constructed. By applying the actual track point data of 848 flights during a 24 h period in the Beijing-Guangzhou air corridor, the duration of the delay of a single flight, the system delay accumulation, and the system delay elasticity coefficient were calculated. The delay elasticity of the Beijing-Guangzhou air corridor system was evaluated, and its relationship with the air flow structure was analyzed. The improvement of the node-link settings and grid division reflected the characteristics of fine-grained research and the reasons for the heterogeneity of the delay elasticity were analyzed based on the airline network structure. The research suggests that: 1) overall, the flights in this air corridor primarily generate delay and show delay absorption capacity in low traffic periods. The average delay time for flights is 1.4 min. The mean delay of departure flights is generally higher than that of arrival flights. With the increase of flow intensity between hub airports, the mean and peak amplitudes of flight delay increase. According to the standard statistics of delay duration >15 min, the probability density and mean delay of each confluent flight are higher than those of a direct flight between the hub airports; 2) the delay of the Beijing-Guangzhou air corridor system presents a dynamic process that accumulates in the central route while peripheral routes recover. The accumulated delay of central airlines is 689 min, while the recovery of peripheral airlines is 936 min. The preference of the operators for central routes makes high-density traffic convergence the principal cause of delay accumulation; 3) the delay elasticity of the Beijing-Guangzhou air corridor system varies greatly among different air route segments and improves significantly with an increase in the number of paths and the dispersion of traffic flow between nodes. Multi-link air route segments trigger active delay absorption and thus have a strong delay recovery ability. The relationship between the delay elasticity and the air flow operation structure of the air corridor system is established by three key elements: the central route, the peripheral route, and the track clusters. This article provides a new perspective for the measurement and understanding of system delay elasticity and a basis for the selection of diverse routes and flight schedules in air corridors. Contrary to the previous elastic strategy of adjusting the allocation of flight slot resources and retaining the remaining capacity, this study reflects that flexible airspace utilization and dynamic airspace management, namely, adaptive route reconstruction and optimization of connections, would improve the efficiency of the system elasticity guarantee system.
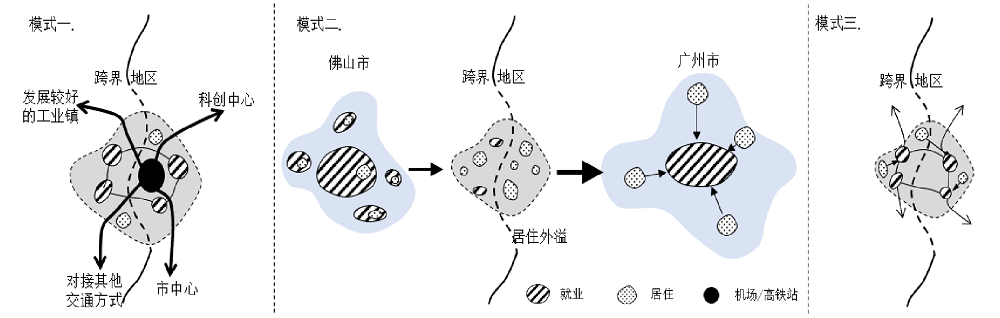
Based on mobile phone signaling data, this study uses the Guangzhou-Foshan area as the focus area of a case study. The spatial structure is determined using the Lorenz method, and the spatio-temporal characteristics of job-housing are analyzed in a cross-border region. The findings of the study are as follows. First, the job-housing space of Guangzhou exhibits the characteristics of a single employment center and suburbanization, which is mismatched. The job-housing space of Foshan is mixed and presents a spatial pattern of "large scatter, small cluster," which is related to the urban development mode. Second, the job-housing space presents a new trend that emerged after the cities of Guangzhou and Foshan were integrated. The cross-border region, including Jinshazhou, Fangcun, and Guicheng, has formed a continuous high-intensity commuting area. Third, the job-housing patterns of the five cross-border regions are quite different. The Huadu airport area and the new station area (also referred to as a traffic hub type) support the airport economy and the high-speed rail economy, which affects the flow of labor and capital factors in the two cities and drives industrial development of surrounding areas. At the center of the cross-border region, the Jinshazhou and Fangcun-Guicheng regions (living type) undertake the resident spillover of Guangzhou and Foshan. The Wusha region (industry type) has a geographical advantage of forming a cross-border industrial park, attracting nearby residents for work. This research provides meaningful guidance and practice for the development of cross-border regions. Further, it provides new analytical dimensions and perspectives for related research. It can be seen that the development of different types of transboundary areas is conducive to suturing space rifts between the cities of Guangzhou and Foshan, thereby accelerating the integration of urban space. Based on the Lorenz curve, this study innovatively introduces a stricter endogenous threshold method to determine the threshold value of vocational and residential centers of Guangzhou and Foshan. Existing research mainly focuses on Beijing, Shanghai, Shenzhen, and other big cities. From the perspective of regional functions, this study focuses on cross-border regions and aims to provide references for regional coordinated development. However, some deficiencies still persist in this study, such as one person with multiple phone numbers, or incomplete samples of mobile phone signaling data. In the follow-up study, other trajectory data such as subway use and traffic can be added for verification. In addition, if the economic and social attributes of individual residents can be combined, the characteristics of people residing in cross-border areas during urbanization can be analyzed more precisely. This will be conducive to identifying patterns inoccupation and residence space.
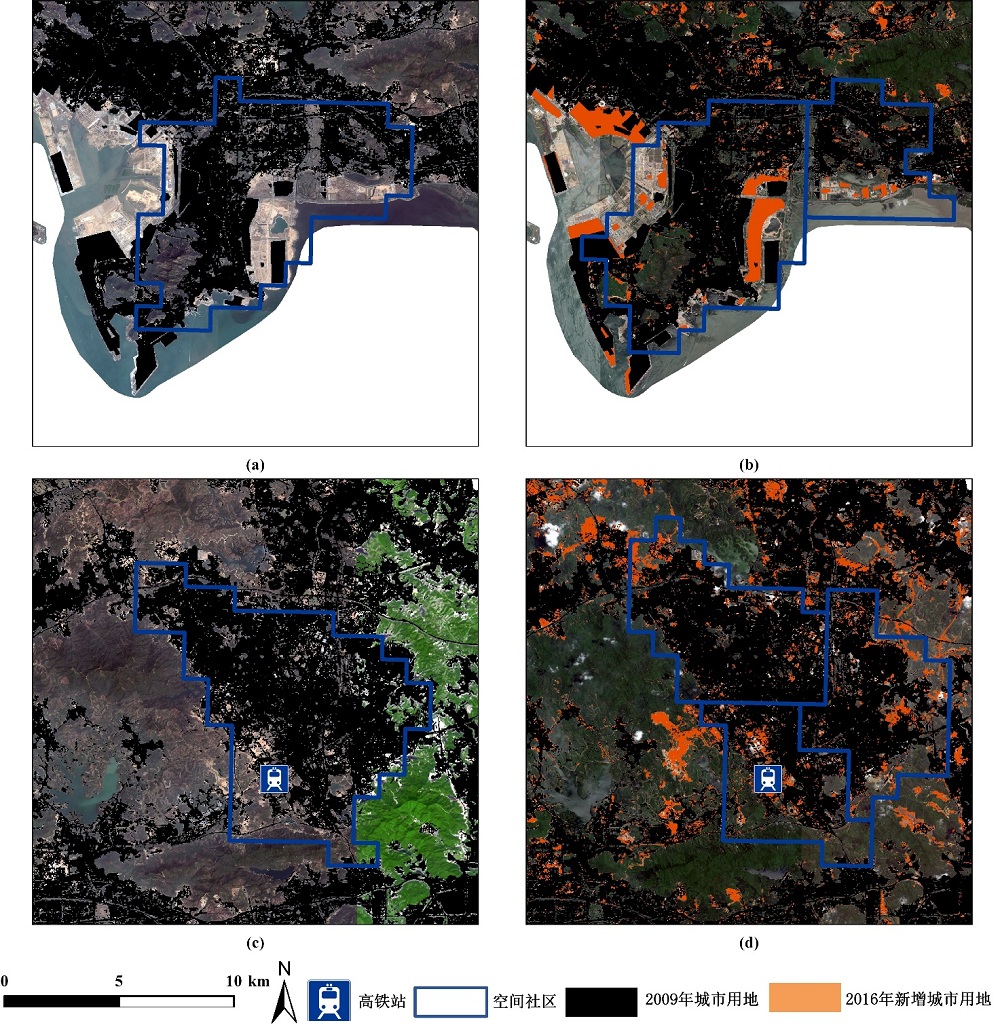
The concept of urban spatial structure refers to the inherent structure formed by interactions between people and places. Studying urban spatial structure (especially its dynamic characteristics) is of considerable significance for understanding and managing cities. This study characterized the long-term dynamics of an interaction-based urban spatial structure using a large-scale taxi trajectory dataset from Shenzhen, China, for May 2009 and September 2016. Spatial networks were built to model intra-city spatial interactions at different times in order to extract the dynamic spatial structure. Due to the differences between the global spatial structure and the local spatial structure of the city, two-level hierarchical spatial networks were built by separating long- and short-distance trips. The cut-off point for hierarchical partitioning was set as 5 km in both 2009 and 2016 by comparing the coefficient of determination (R 2) for the fitted probability distribution functions of the trip distances. Furthermore, the Infomap community detection algorithm was applied to detect global and local spatial communities in the network. By comparing changes in spatial communities and combining remote sensing images with planning policies, this study characterized dynamic changes in Shenzhen’s long-term multi-scale spatial structure and revealed the impacts of infrastructure construction and planning policy on the urban spatial structure. The results showed that the spatial structure of Shenzhen underwent dramatic changes from 2009 to 2016. 1) On a global scale, urban spatial structures tend to be compact. For example, numerous small spatial communities in the suburbs of Shenzhen have merged into five large spatial communities the same as planned functional clusters, which has relevance to the Shenzhen 2020 master plan. 2) The spatial form of communities has also undergone significant changes on a global scale. For example, the shape of the community connecting the Shenzhen urban area and Shenzhen airport has changed from “|” to “U”. This is related to the opening of the Guangshen Yangjian Expressway and the expansion of the Shenzhen airport, reflecting the impact of major transportation infrastructure development on the urban spatial structure. 3) On a local scale, urban spatial structures tend to develop in a polycentric manner. For example, in Shenzhen, the two spatial communities surrounding the North High-speed Rail Station and the Nanshan Center were split into multiple spatially small communities, indicating a strong relationship with major infrastructure construction and economic development. This study verified the effectiveness of Shenzhen’s administrative division adjustment, 2020 master plan, high-speed railway station, airport expansion, and arterial expressway construction from 2009 to 2016. The results provide a valuable reference for planning implementation assessment and impact assessment of infrastructure construction, providing support for urban traffic management.
It is crucial to address the global risk of disease caused by PM2.5 air pollution, which requires large-scale monitoring of PM2.5 pollution. Simulations of pollutant patterns are also necessary; however, it is currently difficult to accurately depict the spatial and temporal distribution patterns of PM2.5 pollution in cities using traditional air pollutant simulation methods. In this study, basic low-cost air quality monitoring equipment was used to conduct mobile monitoring of PM2.5 pollution in the central urban area of Guangzhou within the ring expressway, and 2,257,000 PM2.5 monitoring data were obtained at a frequency of 1 Hz. Using these data, simulation of PM2.5 pollution within the study area was conducted at a spatial and temporal resolution of 10 m × 10 m, and the reliability of collecting spatial and temporal patterns of PM2.5 pollution via the mobile device in the urban center was analyzed. The mobile monitoring data results showed the following: under stable weather conditions, there was a significant temporal correlation between PM2.5 data obtained under mobile monitoring and that from the fixed monitoring station (R 2: 0.72-0.86). The spatial and temporal distributions of PM2.5 pollution in the central area of Guangzhou showed significant spatial and temporal differentiations over short time periods. Temporally, the hourly average ranges in dry and wet seasons were 27 μg/m3 and 11 μg/m3, respectively, where the temporal periods of the highest and lowest concentrations occur depends were related to the background concentrations on the day. Spatially, there were higher values of PM2.5 near transportation hubs, commercial centers, industrial parks, and large commercial markets; however, lower values were found in parks, green areas, and high-end residential areas and on university campuses. Furthermore, spatial differentiation characteristics were evident, with values higher in the west and south and lower in the east and north during the dry season, but higher in the east and lower in the west during the wet season. Although there was no temporal correlation between high PM2.5 values during the day and peak traffic periods, pollution was spatially concentrated in the vicinity of important traffic nodes within the city, and the amount increased during peak traffic periods. These results show that the mobile monitoring method can be used to describe the spatial and temporal patterns of pollutants and key areas of exposure can be identified, which is of great significance for optimizing and adjusting the layout structure of monitoring sites and associated maintenance costs. Implementation of this method could enable the identification of high risk pollution routes, which would prevent and control pollution, improve the ecological environment, and enable targeted protection measures to be effectively evaluated. As such, use of mobile monitoring is important in the construction of smart cities and for realizing the long-term and high-precision air quality monitoring within cities under the support of smart geospatial technology.
Taking the Guangdong-Hongkong-Macao region as our study area, we first used the time series data fitting method in TIMESAT to improve the quality of VIIRS nighttime light remote sensing images. We then generated annually averaged nighttime light images from the repaired VIIRS monthly composite data from June 2012 to May 2019. These, combined with the LandScan TM population distribution map and administrative division data, were used to analyze the spatial and temporal patterns of urban development in the Guangdong-Hongkong-Macao region for the first time, using a spatial statistics method, rank-size distribution method, and the Nighttime Light Development Index (NLDI) constructed using the Gini coefficient. The experiment was performed at both prefecture and county levels. The following conclusions can be drawn from this study. 1) From 2012 to 2018, the total amount of nighttime light in all prefecture-level cities in the Guangdong-Hongkong-Macao region showed an increasing trend. The total amount of night light in Guangzhou has always been highest, with Shenzhen, Dongguan, Foshan and other economically developed cities maintaining steady increases. The growth rate of nighttime light in small and medium-sized cities was significantly higher than in large cities, and was as high as 310.35% in Shanwei City. Small and medium-sized cities located in the surrounding areas show great development potential. 2) In the rank-size distribution analysis, from 2012 to 2018, the q value at prefecture level and county level decreased by 16.86% and 13.52% respectively. At the prefecture and city level, the distribution of urban scale has gradually changed from a first-place distribution to a rank-size distribution. At the district and county level, it has remained a first-place distribution, but the tendency to disperse has been greater than the tendency to concentrate. The "Core-Edge" urban network structure that had prevailed in the Guangdong-Hongkong-Macao region for a long time has gradually been broken. The gaps between urban structure levels are gradually narrowing, and the scale development is gradually becoming more balanced across the whole region. 3) It can be seen from the analysis of the Nighttime Light Development Index that the differences in nighttime light levels and population distribution levels in the Guangdong-Hongkong-Macao region are gradually decreasing, with the imbalance between cities showing a decreasing trend year by year. The rate of decrease of NLDI in small and medium-sized cities is faster than in large cities, which indicates that the development of small and medium-sized cities is faster. The NLDI values of Jieyang City, Shanwei City and Shantou City, which are all in the east of the Guangdong-Hongkong-Macao region, decreased most significantly, indicating that the east of the region has shown a strong development trend in recent years. This paper presents an analysis the evolution of urban scale distribution in the Guangdong-Hongkong-Macao region from the perspective of spatial statistics, and its dynamic urban development in recent years is discussed herein. These findings have both theoretical and practical significance for optimizing development as well as for scientifically informed distribution of resources in the region.
This paper comprehensively analyzes the spatial distribution relationship between employment and residence in central Guangzhou on a meso level with the help of the Baidu Thermal Map, Baidu Real-time Road Conditions, and Baidu POI data. The results show that: 1) high-value areas where the population gathers during working hours are decently marked with plaques, but most of these are concentrated in the core area. The population is primarily concentrated around the commercial areas and transportation lines of various districts because of the close connection between employment activities and transportation. Examining the main functions of specific areas revealed that they are dominated by employment centers, business centers, and transportation hubs with a strong orientation towards work. High-value leisurely areas are relatively concentrated, have higher land use efficiency, and show a polycentric circle structure. The population is principally concentrated in the traditional local and newly developed commercial residential areas, which are relatively staggered from the core business district. There is a distinct difference between the working areas and places of gathering during non-work hours. The high-value places of gathering during non-work hours are mostly residential land; 2) from the correlation between the degree of population aggregation and the density of POI facilities, the density of POI facilities is more significant in areas with higher population aggregation, during both the work and non-work hours. Therefore, population aggregation has certain selectivity and is primarily concentrated in the area where urban infrastructure development is relatively complete; 3) according to Jobs-housing balance index measurements at the meso level, the ratio of occupation and housing (indicates the relative balance of occupation and housing) of each block in central Guangzhou is between 0.73 and 1.54 with little difference between regions. From a distribution perspective, the blocks with higher scores are mostly distributed in the core area (primarily concentrated in the Yuexiu District, northern Liwan District, and southern Tianhe District) and the blocks with lower scores are mostly distributed in the peripheral or marginal zones of the core area (primarily scattered in the Haizhu, Liwan, and Baiyun Districts); 4) from the perspective of the city’s response to traffic, peak morning congestion in central Guangzhou is greater than peak evening traffic. However, the overall variation in road conditions is minimal, and there is no particularly serious commuting phenomenon in the area.
Hyperspectral remote sensing provides highly efficient, convenient, and non-destructive technical means for the quantitative study of the dust retention content of plants. Based on common greening plants in Guangzhou and hyperspectral remote sensing technology, this study designed a semi-closed greenhouse experiment scheme and explored the spectral characteristics of different plants under dust pollution. The research results show that: 1) Dust-retention time is an important factor that affects the accumulated dust retention content of greening plants. The amount of dust retention content increases with time but decreases after reaching saturation. There are differences in the amount and time of saturation of different plants, and the order of saturation of dust retention from large to small is: Cordyline fruticosa(L.) A. Cheval > Loropetalum chinensis(R.Br) Oliv. Var rubrum Yieh > Ficus microcarpa L. f. cv ‘Golden leaves’. In the specific green vegetation screening, Cordyline fruticosa(L.)A. Cheval can be given priority consideration. 2) In the visible wavelengths affected by foliar dust, the spectral reflectance of the leaves increases, with increases in the amount of dust retention; in the near-infrared wavelengths, the spectral reflectance is inversely proportional to the amount of dust retention. 3) Dust retention content directly or indirectly affects the spectral characteristics of plant leaves and has nothing to do with the three sides of the plant. The dust retention content is directly proportional to the red valley reflectance and green peak reflectance and has no significant relationship with the red valley and green peak positions. There is a negative correlation between the dust retention content and the Normalized Difference Vegetation Index (NDVI). The NDVI values of different plants are affected by dust retention content to varying degrees; in order from large to small, these are: Cordyline fruticosa(L.)A. Cheval > Loropetalum chinensis(R.Br) Oliv. Var rubrum Yieh > Ficus microcarpa L. f. cv ‘Golden leaves’. The model established by the NDVI and dust retention content can quickly and non-destructively evaluate the dust retention capability of plants, which can provide a scientific basis for urban air quality monitoring. The experimental scheme of the semi-enclosed greenhouse designed in this study provides a new idea for the long-term sustainability study of the dust retention effect of plants. Furthermore, the dust retention effect of plants differs according to their environments, requiring further research. Important future research areas include the inversion band selection of spectral estimation models, the construction of high-precision spectral estimation models, the influence of different plant species on spectral estimation models, and the inversion of dust retention on a large area scale by combining spectral estimation models of dust retention content with the remote sensing images of hyperspectral UAV, satellite, etc.
As sonic imaging instrument, side scan sonar is widely used in the qualitative detection and recognition of underwater landforms and objects. Some researchers have attempted to quantitatively reconstruct underwater landforms using the Shape From Shading (SFS) method, which is based on the principle of computer vision. At present, it is sometimes used in the investigation of coral reefs in China. In the present study, a quantitative reconstruction of shipwreck and its surrounding relief is carried out at a coral reef in the South China Sea based on single side scan sonar image. After the pre-processing steps of data format conversion, image generation, water removal, image gain and correction, and coordinate conversion, the side scan sonar image of the shipwreck area was used to retrieve the underwater topographic data. The study involved using an SFS algorithm based on minimization approach with the measured bathymetric data as the initial topographic condition to reconstruct the three-dimensional relief of the shipwreck and surrounding area. The mean absolute error was 0.77 m and the mean relative error between the retrieved and measured water depths was 4.5%, revealing the topographic and geomorphic features of the shipwreck area. The results show that the shipwreck area is located on the western side of the coral reef and has the typical geomorphologic form of a reef slope with water depth increasing from -1.8 m to -165.4 m from east to west. It can be divided into two relatively planar terraces and two steep slopes according to the water depth and slope gradient. The first terrace is approximately 46 m wide, with a mean depth of approximately -4.1 m and a mean gradient of approximately 1.4°; the first slope is approximately 35 m wide, with a mean depth of approximately -16.1 m and a mean gradient of approximately 28.8°. The second terrace is approximately 87 m wide, with a mean depth of approximately -26.7 m and a mean gradient of approximately 5.7°; the second slope is approximately 90 m wide, with a mean depth of approximately -63.3 m and a mean gradient of approximately 39.0°. The shipwreck is located on the second terrace of the reef slope. The shipwreck lies in EES-WWN orientation and is approximately 45 m long, 9 m wide, 4 m high, with a tonnage of approximately 500-600 tons. However, the shipwreck is no longer intact. The quantitative inversion and reconstruction of underwater landforms using side scan sonar images is an effective complement to the qualitative analysis of the images and can reveal the topographic and geomorphic characteristics of the coral reef in more comprehensive and detailed ways. In the future, the quantitative analysis method of side scan sonar imaging will have widespread applications in the investigation of topographic reconstructions, substrate types and coral community distributions, human activity footprint monitoring, and identification of special objects such as submerged reefs and shipwrecks.
Determining the accurate distribution of cultivated land is a prerequisite and foundation for the development of precise, modernized agricultural practices, and it is an important factor in land policies and agricultural production at the local scale. However, in karst areas, because of the complex terrain and cloudy and rainy weather conditions, the images often show repeated patterns of “identical foreign matter”; i.e., it is difficult to obtain accurate farmland information using traditional image-based farmland extraction. To solve this problem, Beipanjiang Town and Huajiang Town in Guizhou Province were selected as target areas in this study. Using Google’s high-resolution remote sensing images and combining the concepts of zoning and grading, accurate extraction and evaluation of cultivated land in the study area could be performed based on deep learning methods and traditional constraints. Firstly, based on visual data, farmland was divided into three types: farmland in gentle slopes), Relatively slender and unevenly distributed farmland, and farmland with blurred edges. Then, the Holistically-Nested Edge Detection (HED) model, Richer Convolutional Features (RCF) network model, and D_LinkNet semantic segmentation model were used to extract cultivated land. After confirming that the prediction data were sufficiently accurate, cultivated land was further classified based on the slope and topographical data of the test area, and the distribution characteristics of cultivated land within various terrains were studied. The results showed that: 1) The area of cultivated land in the study area classified via visual morphological differences and various models was 9 867 ha, which is basically consistent with the actual area. The F-measure was mainly distributed between [0.82, 0.98] and was affected by the topography and the exposure rate of rocks. The precision of arable land extraction in areas with severe rocky desertification was low. 2) In terms of morphological accuracy, the Generalized Intersection Over Union (GIOU) of the predicted and actual area of cultivated land was mainly distributed between [0.7, 1], The correct segmentation rate was more than 85%, which indicates that the predicted farmland boundaries generally coincided with the actual plot boundaries, and the extraction results reflected the actual situation in the study area. The research area mainly consists of karst cultivated land, which accounted for 74% of the total arable land area in the study area. Further, the degree of rocky desertification is relatively serious, of which light and moderate rocky desertified arable land accounts for about 32% of the total cultivated land. The narrowness and fragmentation of cultivated land in rocky desertified areas are greatly affected by anthropogenic activities. Land closer to residential areas is more accessible, and the tendency of the plots to be fragmented increases as the land utilization rate increases. In summary, the method proposed in this study can effectively extract cultivated land in areas with fragmented cultivated land and complex terrain, thus providing accurate data to support regional development, cultivated land management and research, and environmental protection and decision-making.
Remote sensing image processing technology based on deep learning can prospectively be used to determine the characteristics of large numbers of remote sensing image data and complex scenes. However, deep-learning algorithms in remote sensing image processing have certain shortcomings, e.g., the popular DeepLabv3+ network has slow fitting speeds, inaccurate edge target segmentation, inconsistencies, and holes in large-scale target segmentation. We therefore proposed a method for introducing a Dual Attention Mechanism Module (DAMM) to DeepLabv3+ to address the above deficiencies. We designed two different network models that connected the DAMM structure to the Atous Spatial Pyramid Pooling (ASPP) layer in series or parallel. In the serial connection method, the feature map was first sent to the DAMM and then passed through the ASPP structure. Furthermore, the feature map was defused with middle-low layer feature information through the decoder layer and restored to the original image resolution. In the parallel connection method, the DAMM and ASPP layers processed the feature map extracted from the backbone network in parallel and subsequently fused the processed feature map information. The mixed feature map was restored to its original resolution by the decoder. The two improved methods were verified by the INRIA Aerial Image high-resolution remote sensing dataset. The results showed that both the series and parallel methods could effectively improve the shortcomings of Deeplabv3+. The experimental results showed that the parallel network had superior performance, and improvements in the original network defects were more obvious. The parallel method achieved a higher score [85.44% Mean Intersection Over Union (MIOU)] in the test dataset, which was 1.8% higher than Deeplabv3+. And the serial network increased by 1.12% compared to Deeplabv3+. The effects of the position and channel attention mechanisms in the DAMM structure were also determined. The ablation study results showed that the channel and position attention mechanisms improved the performance of the Deeplabv3+ model. In the test set, the channel and position attention mechanism mIoU increased by 0.95 and 1.32%, respectively. The experiments revealed that the position attention mechanism had a greater effect on edge target segmentation, the channel attention mechanism had a greater effect on large-scale hole phenomena, and the channel and position attention mechanism promoted network fitting speed in training. The proposed improved DeepLabv3+ algorithm can provide a scientific basis and reference for semantic segmentation of big data remote sensing images.
This study investigates the application of three machine learning algorithms, e.g. the Random Forest (RF), Extreme Gradient Boosting (XGBoost), and Support Vector Machine (SVM) algorithms, in water depth estimation using Sentinel-2 multispectral satellite images. A case study is conducted in the Meizhou Reservoir in Guangdong, China, and a comparative analysis of the inversion results is performed. The results are validated against in-situ measured data using an unmanned ship, in which a global positioning system and a single wave velocity sounding system are integrated. The experimental results based on our water depth inversion models demonstrate good inversion accuracy and efficiency of the machine learning water depth inversion model constructed using 7 925 water depth data samples and satellite multispectral images. By adjusting the key parameters of each model such that the model reaches the optimal state, the determination coefficient (R 2), Root Mean Square Error (RMSE), Mean Absolute Error (MAE), and Bias were used to evaluate the accuracy of the models. For water depth inversion, the RF model indicated that R 2 = 0.80, RMSE = 2.21, MAE = 1.51, and Bias = 0.00; the XGBoost model indicated that R 2 = 0.79, RMSE = 2.22, MAE = 1.50, and Bias = -0.01; and the SVM model indicated that R 2 = 0.78, RMSE = 2.23, MAE = 1.60, and Bias = 0.01. To determine the efficiency of each model, the models’ running times were obtained: 3.92 s for RF, 4.26 s for XGBoost, and 6.66 s for SVM. Notably, the RF model is superior to the XGBoost and SVM models in terms of inversion accuracy and efficiency. Moreover, the advantages and disadvantages of each model can be inferred from the prediction result graph. The prediction results of the RF model are more detailed, and the terrain is clearer compared with those of the XGBoost model. The SVM model does not achieve ideal prediction using the same dataset, and the error at a shallow water depth is much worse than those of the other two models. The scatter plots indicate that the inversion deviation is not obvious between the RF and XGBoost models, and the prediction results are more consistent with the actual results. However, the scatter plot of the SVM has a horizontal bar near 11 m; therefore, it predicts the water depth value in this interval incorrectly. Furthermore, the errors of the RF and XGBoost models evaluated by the standard evaluation method are lower than that of the SVM model, indicating that those models have a higher prediction accuracy for water depth inversion. In summary, the machine learning models for water depth estimation yielded good performances in this study, and they are suitable for estimating the water depth using remote sensing images with lower economy and time cost, especially in unreachable waters.
Innovation is the primary driving force of development and provides strategic support for building a modern economic system. Its role in promoting regional development has been studied and acknowledged by academics. Since the Chinese economic reform, the country’s scientific and technological level and capacity for innovation has significantly improved, and the overall national strength has steadily increased. Presently, innovation plays a critical role in China's economic transformation from a stage of high-speed growth to a stage of high-quality development. Based on urban invention patents, this study analyzes the spatial characteristics of the innovation capabilities of Chinese cities by using the kriging interpolation method and a spatial autocorrelation model. The Geographical Weighted Regression (GWR) model was used to explore the spatial heterogeneity in the factors influencing the innovation ability of 289 cities, and to reveal the spatial differences in the dominant factors. The results indicate that the innovation ability of Chinese cities shows a decreasing trend from the southeast to the west, and the cities with the highest innovation capacity are concentrated in the southeastern coastal areas. The cities in the west, mainly in Tibet, have the lowest innovation capacity. The spatial agglomeration is significant. In terms of the determinants, the significance level of each variable was good. The proportion of significant regions in all cities in order from large to small is financial input, talent element, economic foundation,economy extraversion, financial environment, and information level. In addition to the significant positive correlation between financial input and urban innovation capacity, there are positive and negative correlations among the other determinants. Moreover, the range of the index’s regression coefficient is large and has an obvious spatial differentiation. The talent element is positively correlated with the innovation ability of most cities. The influence of the economic foundation and information level on urban innovation ability is positive for economically developed areas and negative for underdeveloped areas. Economic extraversion is positively correlated with the innovation ability of the eastern coastal areas and the central and western regions, but negatively correlated with that of most cities in northeast and north China. The financial environment, represented by residents' savings, has a positive correlation effect on the innovation output of the northeast and western regions, while it has the opposite effect in the Yangtze river delta and other regions. The input of innovation elements in China is still a leading determinant in improving the country’s innovation ability. For southeastern Chinese cities with a higher level of economic development, more attention should be paid to improving their economic level and promoting the overall improvement of their innovation ability. For cities in the northeast and west, where the economic level is relatively inferior, financial support plays a significant role in the development of their innovation activities. Thus, attention should be paid to the cultivation of the financial market in these areas. The research shows that there are spatial differences in the factors influencing urban innovation capabilities in China, and the characteristics of different cities should be taken into account when formulating innovation policies to make policies more targeted and facilitate the healthy and coordinated development of national urban innovation.
A karst reservoir is a type of semi-natural and semi-artificial water body. Owing to the dual regulation of fragile geological background of the karst and human activities, the geochemical indexes of karst water body differ considerably. To understand the variation processes of hydrochemistry of the Yelanghu karst reservoirs, which are located in Puding in Guizhou Province, the diel cycles of geochemistry of their surface water were measured for three days and nights. The results indicate that: 1) the ion indices of the reservoir water did not exhibit obvious diel variations due to variable weather and hydrological conditions, whereas regular indices of water temperature, Dissolved Oxygen (DO), pH, and partial pressure of CO2 exhibited apparent diurnal fluctuations. Under the control of water-rock interactions and the effect of the coal-bearing bedrock, the water chemical type of the Yelanghu Reservoir is Ca-HCO3·SO4. 2) By calculating the thermodynamic parameters and analyzing the principal components, it is found that these parameters are controlled by temperature, biological effects, and human activities, as well as storage and discharge of the reservoir, of which their contribution rates are 21.66%, 17.28%, 14.08%, and 10.22%, respectively, indicating that the influencing factors of hydrochemistry of the reservoirs are multivariate. 3) During the study period, the variation ranges of the Yelanghu Reservoir water’s δD and δ 18O values were -60.61‰~-57.17‰ and -8.11‰~-8.85‰, respectively, and the mean values were -59.44‰ and -8.46‰, respectively. The δD and δ 18O values were smaller during the day and larger at night. During the day, the biological activity in the reservoir is primarily photosynthesis with weak respiration; whereas at night, it is primarily respiration, which consumes a large amount of O2 to obtain more light isotope 16O, thereby resulting in a decrease in DO concentration in the water at night and a negative 18O. However, a comparison of the d-excess value of the reservoir water with the local atmospheric precipitation shows that the d-excess value of the former (8.21‰) is significantly lower than that of the latter (9.64‰), indicating the main effect of unbalanced fractionation caused by evaporation over a long period of time.
The spatial distribution of population is foundational information for policy making, disaster prevention, economic development, environmental protection, and natural sciences or socioeconomic research. Analyzing different gridded population products is essential for learning their characteristics and proper application. Considering timeliness of data and convenience of access, this study compared the spatial consistency of WorldPop, GPW v4 (Gridded Population of World, version 4) and two types of Gridded Population of China datasets in Guangdong Province, China, a province with significant population density differences. The sixth census data in 2010 were divided into high, middle, and low density groups and used as reference data to validate these four datasets on numerical and spatial distribution of error. Moreover, the study used average absolute error, average relative error, root mean square error, correlation coefficient, four indicators, ratio error statistics, and the Taylor diagram for quantitative evaluation. Then, the spatial distribution of the ratio error and the accuracy of the four datasets in different population density regions were analyzed. Finally, an evaluation of error sources and applications from two aspects, including methods for spatializing census data and variables selection of spatial model, was performed. The findings of the study are as follows: 1) These four population datasets have similar spatial distribution trends, and the population is concentrated in the Pearl River Delta regions such as Guangzhou, Shenzhen, Dongguan, Foshan, Zhongshan and Chaoshan regions such as Shantou and Jieyang. The WorldPop dataset had the highest relative accuracy in the whole Guangdong Province, as well as in the high population density area, whereas the GPW v4 dataset performed better than WorldPop in the middle and low population density areas; however, GPW v4 had a shortcoming in depicting population distribution beneath the township level because of the areal-weighting method used. The two types of Gridded Population of China datasets had relatively lower accuracy than the other two datasets. 2) The accuracy of the four population datasets in Guangdong Province was limited mainly by the spatial method based on the regression algorithm, the weighting method, the selection of model variables, and also related to the geographical and social environment of Guangdong Province. 3) The WorldPop dataset is suitable for detailed research in areas with medium and high population density, GPW v4 is suitable for long-time, minimal research units larger than townships, and the first type of Gridded Population of China dataset is suitable for study that requires consideration of the distribution and spatial heterogeneity of population beneath the township level. The second type of Gridded Population of China dataset is suitable for long-time study that requires consideration of the details of the population distribution and changes of spatial pattern. This study provides important basic information for research and applications using gridded population datasets.
Drought has a serious impact on socio-economic development in China and around the world. This study used daily precipitation records from 24 meteorological stations in Guangdong Province, China from 1960 to 2014 to analyze the spatio-temporal characteristics of drought in that region based on the Equivalent Dry Period (EDP) metric converted from the Average Waiting Time for Precipitation index. Particular emphasis was placed on the spatio-temporal evolution of drought in the 21 stcentury. The results showed that the EDP index was suitable for analyzing drought characteristics in Guangdong Province. Overall, drought intensity decreased from east to west and from south to north, with coastal areas experiencing more severe drought than northern and western areas. During the study period, decadal variations and an annual increasing trend in EDP were obvious over the entire province. In addition, seasonal drought was prominent, occurring most frequently in autumn and winter, followed by spring; the drought’s central location varied from season to season. Drought frequency, intensity, and spatial extent were all higher in the early 21 stcentury than those in the late 20 th century. Specifically, since the turn of the century, both Dongyuan Station in the eastern Pearl River Delta and Luoding Station in western Guangdong showed significant increases in EDP and emerged as new drought hotspots. From a seasonal perspective, autumn and winter drought intensified most severely and tended to extend throughout Guangdong Province, with an EDP increase of 23% from the late 20th century to the early 21 st century. Spring drought worsened more gradually and summer drought occurred more frequently (though still rarely) in the early 21 stcentury. These results identified the spatial pattern and temporal evolution of drought in Guangdong Province since the turn of the century and provide scientific references and technical support for drought monitoring and mitigation in southeastern China.