职住地建成环境对居民通勤距离的影响效应探究——以武汉市为例
牛 强:负责选题确定、研究框架设计、主导论文撰写与修改;
孙汉文:负责模型构建及实验结果分析、图表绘制、论文初稿撰写;
严雪心:负责研究思路与框架设计、数据收集、论文撰写及修改。
|
牛强(1978—),男,湖北宜昌人,博士,教授,博导,研究方向为大数据时代的规划研究新方法、信息时代的规划新理论、数智时代的规划量化分析和智慧城乡规划,(E-mail)niuqiang@whu.edu.cn; Niu Qiang |
|
Sun Hanwen, and |
|
Yan Xuexin |
收稿日期: 2024-08-07
修回日期: 2024-12-26
网络出版日期: 2025-11-12
基金资助
国家自然科学基金面上项目(52278075)
中国博士后科学基金会与湖北省联合资助(2025T022HB)
Exploring the Impact of Built Environment at Residential and Work Locations on Commuting Distance: Evidence from Wuhan, China
Received date: 2024-08-07
Revised date: 2024-12-26
Online published: 2025-11-12
随着城市蔓延的持续,长距离通勤对城市交通、环境和居民福祉的负面影响日益凸显,如何缩短通勤距离是亟需解决的现实问题。现有研究多聚焦于居住地建成环境对通勤距离的影响,而对就业地建成环境影响效应的关注却有所不足。文章以武汉市为例,基于长时序手机信令数据分析通勤距离的动态变化,并采用空间面板杜宾模型(SPDM)探究职住地的建成环境对通勤距离的影响。研究发现:1)随着城市扩张,武汉居民通勤距离呈逐年增长趋势。2)职住地建成环境对通勤距离具有显著影响,其中轨道交通站点数对通勤距离的正向效应最为突出,而就业人口密度的负向效应最显著。3)职住地建成环境对通勤距离还存在显著直接效应与溢出效应,且直接效应与总体效应趋势一致。其中,轨道交通站点数虽未显示显著直接效应,但却具有显著正向溢出效应,表明轨道交通在重构环站点周边居民职住选择中具有重要作用;而就业人口密度以及到城市次中心的距离表现出显著负向溢出效应,验证了多中心开发模式有助于降低平均通勤距离。
牛强 , 孙汉文 , 严雪心 . 职住地建成环境对居民通勤距离的影响效应探究——以武汉市为例[J]. 热带地理, 2025 , 45(10) : 1757 -1769 . DOI: 10.13284/j.cnki.rddl.20240518
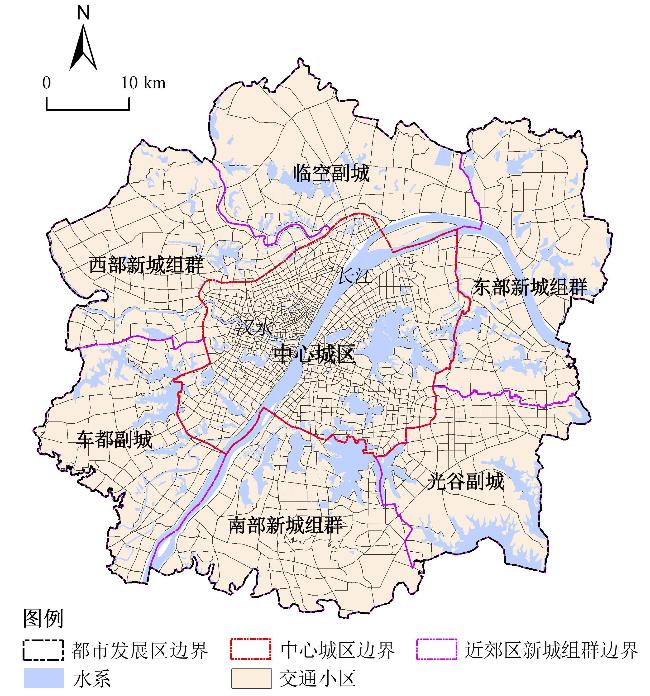
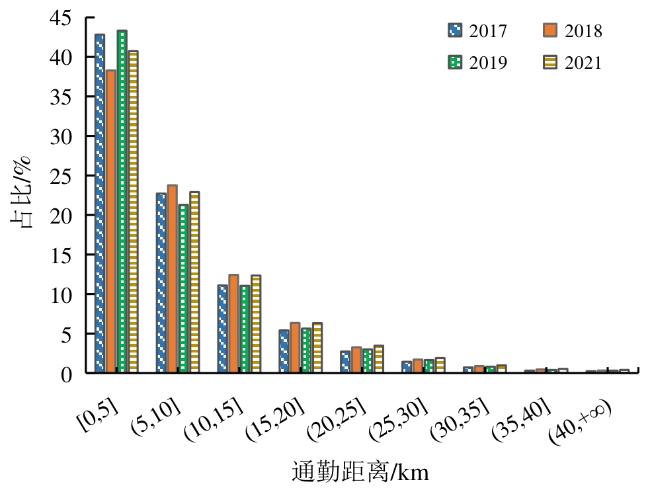
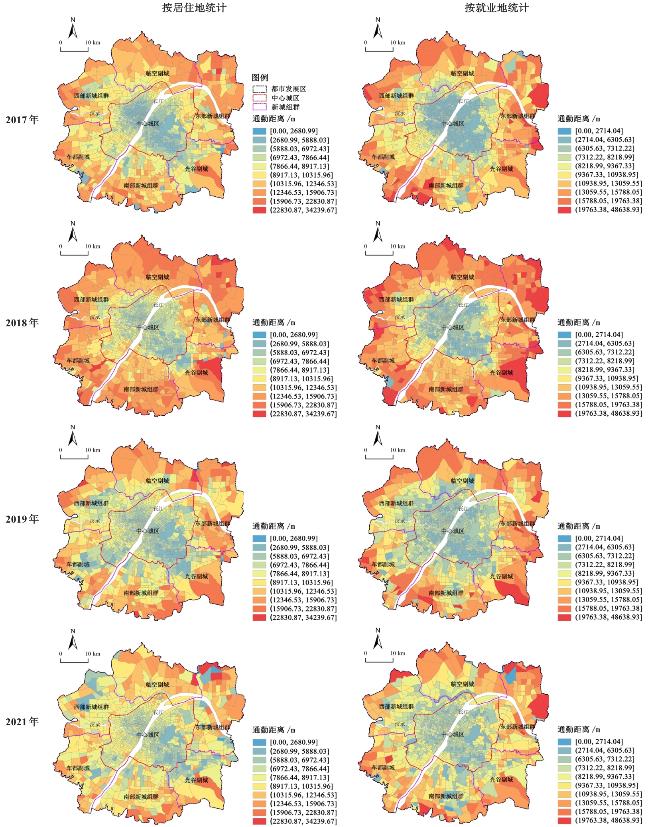
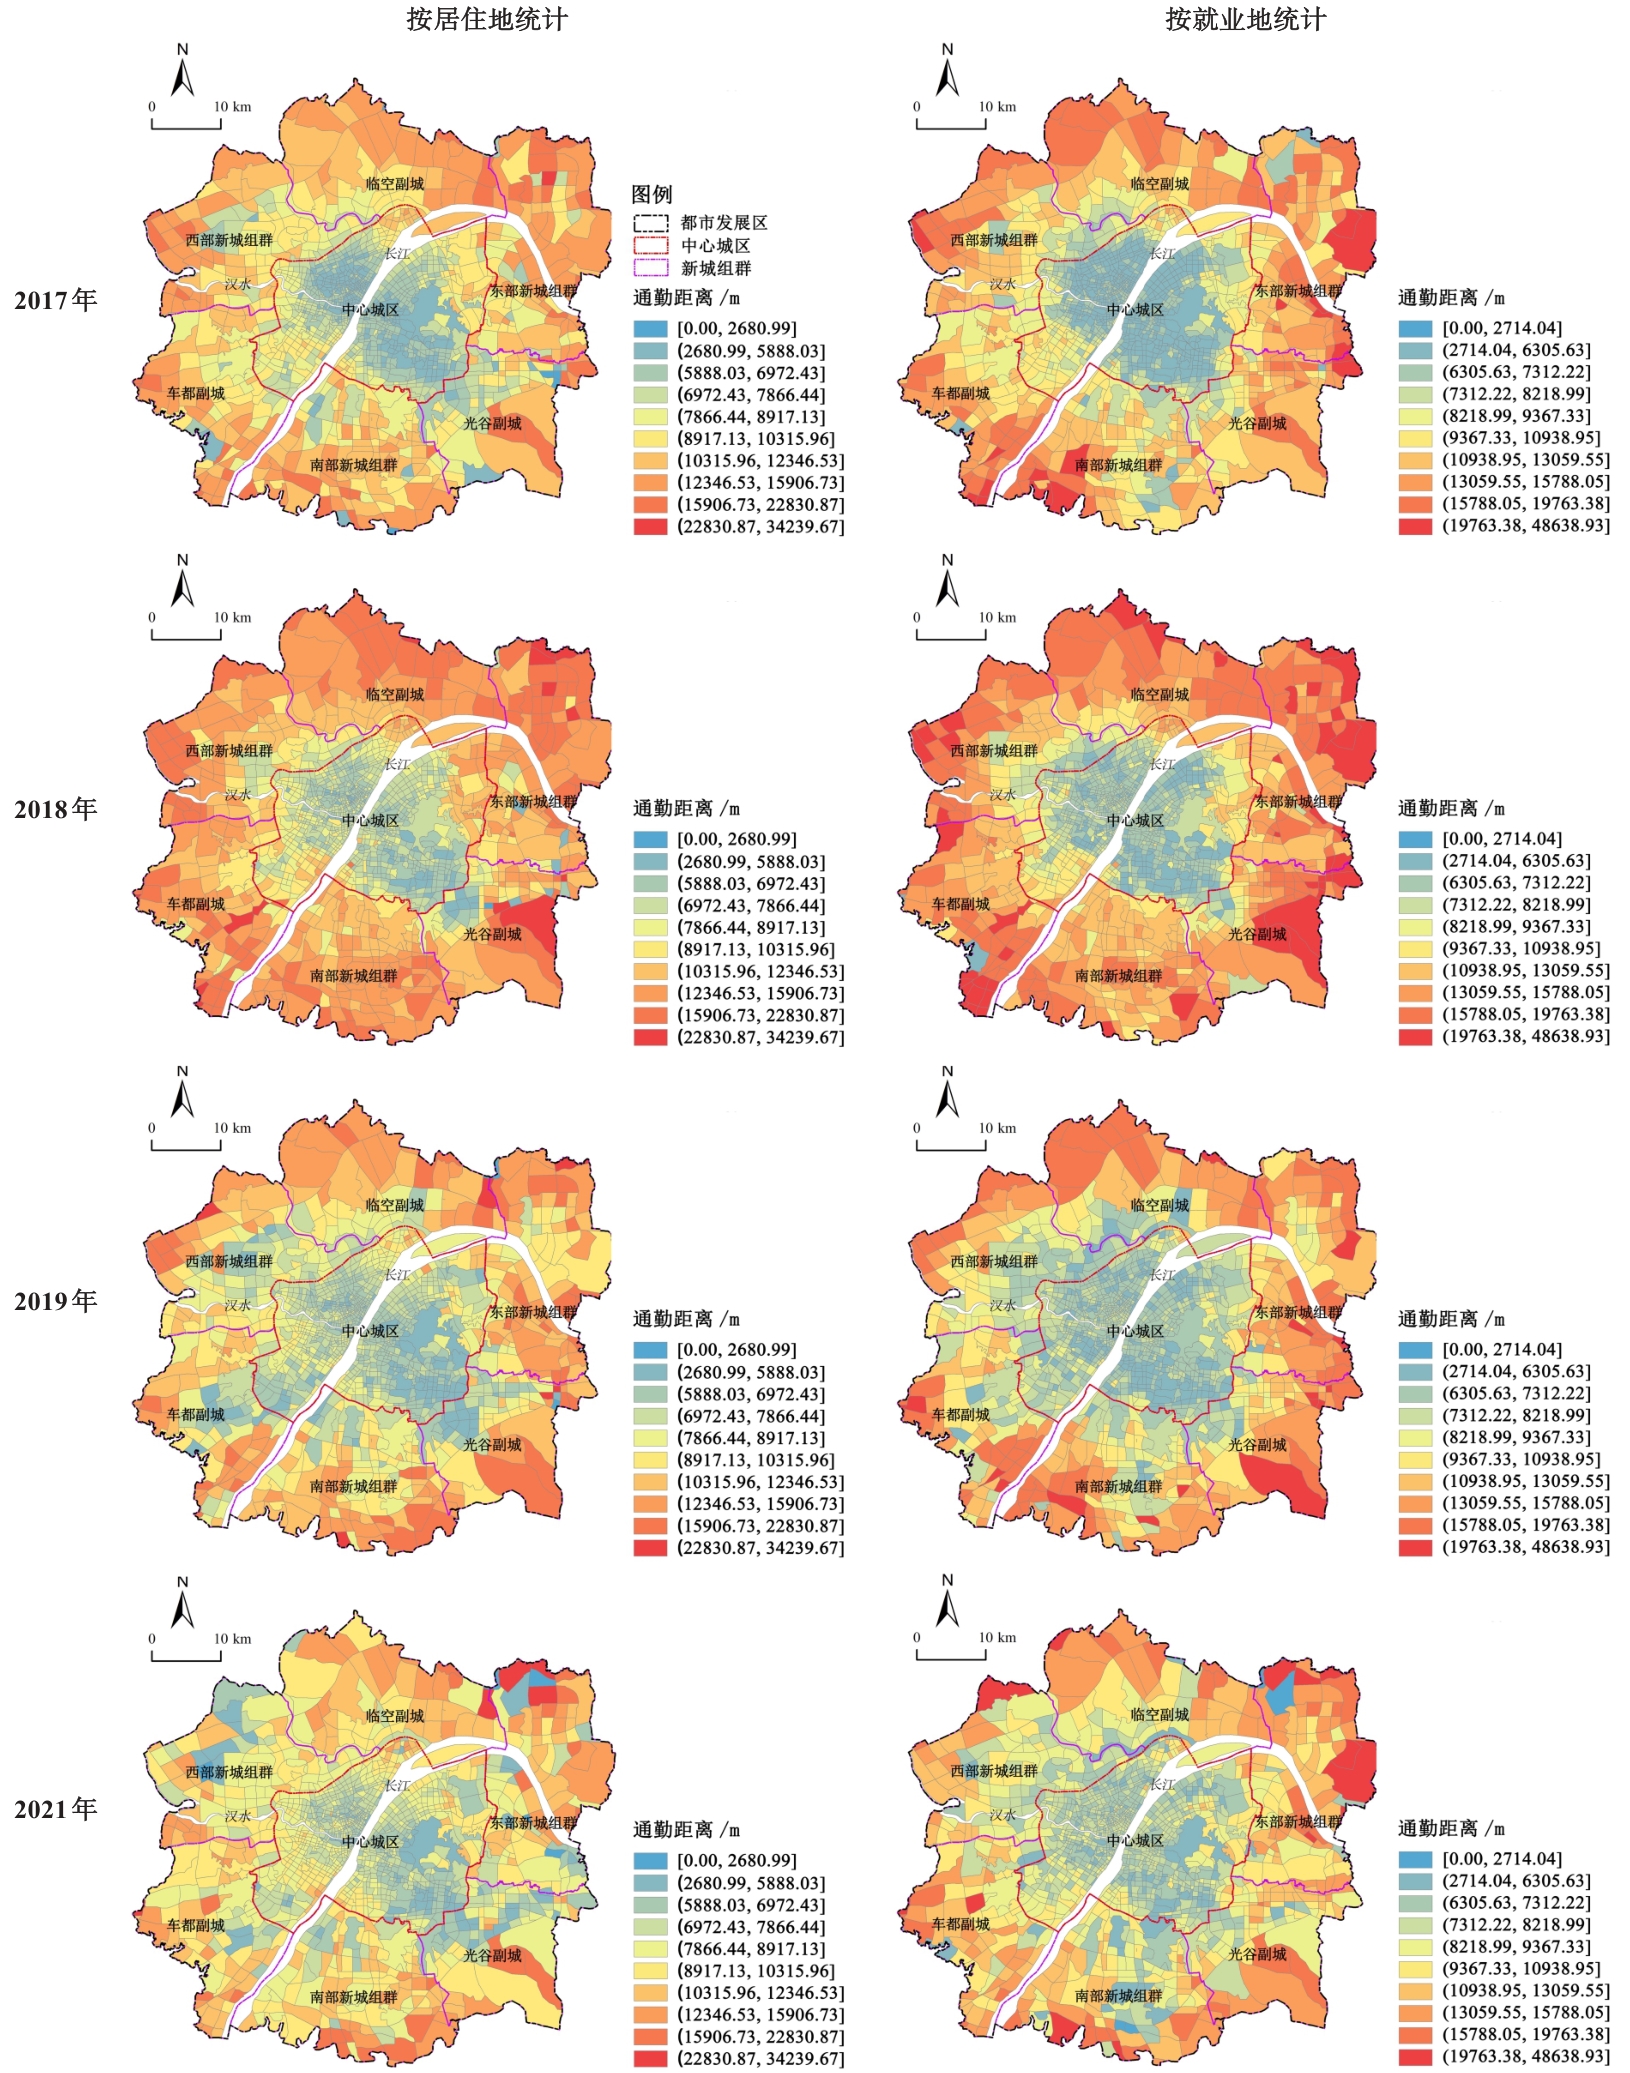
The continuous sprawl of global cities has led to increasingly severe long-distance commuting problems, resulting in a series of negative impacts such as traffic congestion, environmental stress, and declining residents' well-being. Reducing commuting distances has therefore become an urgent challenge for major metropolitan areas worldwide. Optimizing the built environment to shorten commuting distances has been recognized as one of the most effective strategies. While existing studies have primarily focused on the effects of the residential built environment on commuting distance, the influence of the built environment at work location has received relatively limited attention. To address this gap, this study took Wuhan, China, as a case study. Using long-term China Unicom cellular signaling data, it identified the spatiotemporal dynamic changes of commuting distance and employed a Spatial Panel Durbin model to explore the effects of built environments at both residential and work locations on commuting distance. The results reveal that: (1) As the city expanded, the average commuting distance of Wuhan residents increased from 8.22 km in 2017 to 8.49 km in 2021. Although approximately 40% of residents consistently commuted within 5 km, the proportion of long-distance commuters (over 10 km) has shown a continuous upward trend. (2) A distinct "core-periphery" spatial pattern of commuting distances is observed at both residential and workplace ends, with relatively shorter commuting distances in central urban areas and longer ones in suburban areas, along with notable spatial heterogeneity among different suburban clusters. (3) The built environment at both residential and work locations significantly influences commuting distance. Specifically, the number of metro stations, residential population density, the number of road intersections, and distance to the city center exhibit significant positive effects, while employment population density, the number of educational and cultural facilities, and the number of living service facilities have significant negative effects. Among these factors, the number of metro stations and employment population density emerge as the most prominent positive and negative determinants, respectively. (4) The SPDM results further demonstrate significant direct and spillover effects of built environment factors on commuting distance. The direct effects are largely consistent with the total effects, reflecting the core influence of the built environment on local residents' commuting behavior, while the spillover effects reveal spatial externalities across neighboring regions. Notably, the number of metro stations shows no significant direct effect, suggesting that under the city's transit-oriented development (TOD) model, the areas around metro stations have already achieved a relatively balanced job-housing relationship. However, it exhibits a significant positive spillover effect in adjacent areas, indicating that metro systems, while expanding residents' spatial choices of residence and workplace, also facilitate wider commuting extensions. In contrast, employment population density and distance to sub-city centers display significant negative spillover effects, implying the spatial synergy between employment agglomeration and a polycentric urban structure in promoting job-housing balance in surrounding areas and reducing commuting distance. The findings reveal the spatiotemporal evolution of commuting distance and uncover the differentiated mechanisms through which the built environments at both residential and workplace locations influence commuting distance. These results provide robust empirical evidence for formulating transportation policies and land-use optimization strategies aimed at reducing commuting distances. Moreover, the study offers valuable insights for enhancing the job-housing balance and advancing the goals of sustainable urban development.
表1 职住地建成环境对通勤距离影响的模型选择检验Table 1 Model selection tests for the impact of built environment at residential and work locations on commuting distance |
| 检验 | 居住地建成环境 | 就业地建成环境 | |||
|---|---|---|---|---|---|
| 统计量 | P值 | 统计量 | P值 | ||
| LM-spatial error | 1 328.546 | <0.001 | 969.404 | <0.001 | |
| Robust LM-spatial error | 927.094 | <0.001 | 843.433 | <0.001 | |
| LM-spatial lag | 402.926 | <0.001 | 133.424 | <0.001 | |
| Robust LM-spatial lag | 1.475 | <0.001 | 7.453 | 0.006 | |
| Wald-spatial error | 48.95 | <0.001 | 114.24 | <0.001 | |
| Wald-spatial lag | 46.85 | <0.001 | 116.03 | <0.001 | |
| LR-spatial error | 60.31 | <0.001 | 154.83 | <0.001 | |
| LR-spatial lag | 54.08 | <0.001 | 127.75 | <0.001 | |
| Hausman test | 25.12 | 0.014 3 | 104.81 | <0.001 | |
| LR test (spatial-fixed effect) | 116.71 | <0.001 | 138.77 | <0.001 | |
| LR test (time-fixed effect) | -4 317.94 | 1.000 0 | -7 181.56 | 1.000 0 | |
表2 职住地建成环境对通勤距离影响的变量设置及定义Table 2 Variables selection and description for the impact of built environment at residential and work locations on commuting distance |
| 变量 | 变量描述 | 平均值 | 标准差 | ||||||||
|---|---|---|---|---|---|---|---|---|---|---|---|
| 2017年 | 2018年 | 2019年 | 2021年 | 2017年 | 2018年 | 2019年 | 2021年 | ||||
| 密 度 | 居住人口密度 | 各TAZ内的居住人口密度/(人·km-2),由手机信令数据计算得到 | 3 766.66 | 3 697.34 | 4 081.23 | 3 171.08 | 4 460.97 | 4 363.96 | 4 714.64 | 3 653.33 | |
| 就业人口密度 | 各TAZ内的就业人口密度/(人·km-2),由手机信令数据计算得到 | 1 726.86 | 1 738.80 | 1 802.42 | 1 371.64 | 2 902.25 | 2 595.94 | 2 573.19 | 2 114.97 | ||
| 容积率 | 各TAZ内的建筑容积率,由建筑轮廓数据计算得到 | 0.53 | 0.53 | 0.53 | 0.53 | 4.66 | 4.66 | 4.75 | 4.75 | ||
| 多 样 性 | 土地利用 混合度 |
式中:S为土地利用混合度;k为土地利用类型的分类数据; 为i类土地面积占比 | 0.49 | 0.49 | 0.49 | 0.49 | 0.21 | 0.21 | 0.21 | 0.21 | |
| 设计 | 道路交叉口数 | 各TAZ内的交叉路口数量/个 | 7.26 | 7.60 | 8.03 | 14.41 | 9.10 | 9.22 | 9.95 | 18.87 | |
| 目 的 地 可 达 性 | 公司企业数 | 各TAZ内的公司企业数量/个 | 28.19 | 28.19 | 33.86 | 23.93 | 43.44 | 43.44 | 55.07 | 42.66 | |
| 餐饮设施数 | 各TAZ内的餐饮服务设施数量/个 | 32.71 | 32.71 | 51.67 | 32.31 | 50.74 | 50.74 | 81.57 | 48.59 | ||
| 公园广场数 | 各TAZ内的公园广场数量/个 | 0.27 | 0.27 | 0.29 | 0.41 | 0.75 | 0.75 | 0.80 | 0.93 | ||
| 科教文化设施数 | 各TAZ内的科教文化设施数量/个 | 14.23 | 14.23 | 18.12 | 7.89 | 28.39 | 28.39 | 31.04 | 19.44 | ||
| 购物中心数 | 各TAZ内的购物中心数量/个 | 1.92 | 1.92 | 104.37 | 0.54 | 2.74 | 2.74 | 202.50 | 1.24 | ||
| 生活服务设施数 | 各TAZ内的生活服务设施数量/个 | 14.73 | 14.73 | 58.01 | 23.62 | 26.26 | 26.26 | 88.24 | 37.40 | ||
| 距城市中心距离 | 各TAZ与城市中心的直线距离/m | 13 701.67 | 13 701.67 | 13 701.67 | 13 701.67 | 8 415.03 | 8 415.03 | 8 415.03 | 8 415.03 | ||
| 距城市次中心 距离 | 各TAZ与最近城市次中心的 直线距离/m | 8 931.62 | 8 931.62 | 8 931.62 | 8 931.62 | 7 383.50 | 7 383.50 | 7 383.50 | 7 383.50 | ||
| 到公交 站点 距离 | 地铁站点数 | 各TAZ内的地铁站点数量/个 | 0.10 | 0.12 | 0.13 | 0.13 | 0.32 | 0.35 | 0.36 | 0.36 | |
| 公交站点数 | 各TAZ内的公交站点数量/个 | 2.81 | 3.31 | 2.62 | 16.62 | 4.23 | 5.24 | 4.27 | 20.26 | ||
表3 SPDM模型结果Table 3 SPDM model results |
| 变量 | 居住地建成环境的影响(SPDMr) | 就业地建成环境的影响(SPDMw) | |||||||||
|---|---|---|---|---|---|---|---|---|---|---|---|
| Main | Wx | LR_Direct | LR_Indirect | LR_Total | Main | Wx | LR_Direct | LR_Indirect | LR_Total | ||
| 居住人口密度 | 0.095*** (0.00) | 0.024 (0.62) | 0.096*** (0.00) | 0.032 (0.54) | 0.128** (0.02) | -0.030*** (0.00) | 0.146*** (0.00) | -0.029*** (0.01) | 0.156*** (0.00) | 0.127*** (0.01) | |
| 就业人口密度 | -0.062*** (0.00) | -0.097* (0.06) | -0.063*** (0.00) | -0.104* (0.06) | -0.167*** (0.00) | 0.027** (0.02) | -0.185*** (0.00) | 0.026** (0.02) | -0.196*** (0.00) | -0.170*** (0.00) | |
| 容积率 | 0.001 (0.46) | 0.023 (0.25) | 0.001 (0.36) | 0.024 (0.29) | 0.025 (0.26) | 0.000 (0.88) | 0.009 (0.61) | 0.000 (0.78) | 0.008 (0.66) | 0.009 (0.65) | |
| 土地利用混合度 | 0.122*** (0.00) | 0.006 (0.98) | 0.123*** (0.00) | -0.014 (0.95) | 0.109 (0.59) | 0.080** (0.02) | -0.113 (0.47) | 0.080** (0.02) | -0.128 (0.45) | -0.048 (0.78) | |
| 道路交叉口数 | 0.002*** (0.01) | 0.002 (0.35) | 0.002*** (0.00) | 0.002 (0.30) | 0.004* (0.07) | 0.003*** (0.00) | 0.005*** (0.01) | 0.003*** (0.00) | 0.006*** (0.00) | 0.009*** (0.00) | |
| 公司企业数 | -0.000 (0.85) | -0.001 (0.53) | -0.000 (0.83) | -0.001 (0.52) | -0.001 (0.49) | 0.000 (0.16) | 0.000 (0.98) | 0.000 (0.14) | 0.000 (0.98) | 0.000 (0.76) | |
| 餐饮设施数 | -0.000 (0.41) | 0.002* (0.09) | -0.000 (0.47) | 0.002* (0.08) | 0.002 (0.12) | 0.000 (0.71) | 0.001 (0.47) | 0.000 (0.63) | 0.001 (0.46) | 0.001 (0.42) | |
| 公园广场数 | 0.003 (0.77) | 0.048 (0.38) | 0.003 (0.73) | 0.050 (0.41) | 0.053 (0.39) | -0.005 (0.51) | 0.229*** (0.00) | -0.004 (0.59) | 0.247*** (0.00) | 0.243*** (0.00) | |
| 科教文化机构数 | -0.001*** (0.00) | -0.003* (0.09) | -0.001*** (0.00) | -0.003* (0.09) | -0.004** (0.02) | -0.001*** (0.00) | -0.005*** (0.00) | -0.001*** (0.00) | -0.005*** (0.00) | -0.006*** (0.00) | |
| 购物中心数 | 0.000 (0.40) | 0.000 (0.55) | 0.000 (0.37) | 0.000 (0.53) | 0.000 (0.43) | 0.000 (0.64) | -0.000 (0.54) | 0.000 (0.61) | -0.000 (0.57) | -0.000 (0.64) | |
| 生活服务设施数 | -0.000 (0.92) | -0.003* (0.06) | -0.000 (0.81) | -0.003* (0.05) | -0.003* (0.05) | -0.000 (0.57) | -0.000 (0.92) | -0.000 (0.48) | -0.000 (0.93) | -0.000 (0.82) | |
| 距城市中心距离 | 0.115*** (0.00) | -0.098* (0.10) | 0.116*** (0.00) | -0.096 (0.13) | 0.020 (0.74) | 0.114*** (0.00) | 0.157*** (0.00) | 0.115*** (0.00) | 0.181*** (0.00) | 0.296*** (0.00) | |
| 距城市次中心距离 | 0.097*** (0.00) | 0.013 (0.82) | 0.095*** (0.00) | 0.024 (0.69) | 0.120** (0.04) | 0.083*** (0.00) | -0.112** (0.01) | 0.081*** (0.00) | -0.110** (0.03) | -0.029 (0.56) | |
| 轨道交通站点数 | 0.030 (0.16) | 0.209** (0.03) | 0.031 (0.13) | 0.219** (0.03) | 0.251** (0.02) | 0.016 (0.36) | 0.246*** (0.00) | 0.018 (0.31) | 0.266*** (0.00) | 0.283*** (0.00) | |
| 公交站点数 | 0.001* (0.06) | 0.001 (0.73) | 0.001* (0.07) | 0.001 (0.73) | 0.000 (0.90) | 0.001** (0.05) | -0.016*** (0.00) | 0.001* (0.06) | -0.017*** (0.00) | -0.016*** (0.00) | |
| 样本观测数量/个 | 5 956 | 5 956 | 5 956 | 5 956 | 5 956 | 5 956 | 5 956 | 5 956 | 5 956 | 5 956 | |
| R 2 | 0.443 | 0.443 | 0.443 | 0.443 | 0.443 | 0.439 | 0.439 | 0.439 | 0.439 | 0.439 | |
| 截面个体数量/个 | 1 489 | 1 489 | 1 489 | 1 489 | 1 489 | 1 489 | 1 489 | 1 489 | 1 489 | 1 489 | |
|
附表1 空间自相关检验结果Appendix Table 1 Spatial autocorrelation test |
| 年份 | 居住端通勤距离 | 就业端通勤距离 | |||||||||
|---|---|---|---|---|---|---|---|---|---|---|---|
| I | E(I) | sd(I) | z | P值* | I | E(I) | sd(I) | z | P值* | ||
| 2017 | 0.265 | -0.001 | 0.004 | 70.205 | 0.000 | 0.309 | -0.001 | 0.004 | 81.772 | 0.000 | |
| 2018 | 0.124 | -0.001 | 0.004 | 33.040 | 0.000 | 0.124 | -0.001 | 0.004 | 33.040 | 0.000 | |
| 2019 | 0.124 | -0.001 | 0.004 | 33.040 | 0.000 | 0.124 | -0.001 | 0.004 | 33.040 | 0.000 | |
| 2021 | 0.124 | -0.001 | 0.004 | 33.040 | 0.000 | 0.124 | -0.001 | 0.004 | 33.040 | 0.000 | |
|
附表2 稳健性检验结果Appendix Table 2 Results of robustness checks |
| 变量名称 | 居住地建成环境的影响(SPDMr) | 就业地建成环境的影响(SPDMw) | |||
|---|---|---|---|---|---|
| Main | Wx | Main | Wx | ||
| 居住人口密度 | 0.001(0.78) | 0.024(0.15) | -0.039***(0.00) | -0.026(0.15) | |
| 就业人口密度 | -0.045***(0.00) | -0.020(0.24) | 0.028***(0.00) | -0.028(0.12) | |
| 容积率 | 0.008(0.26) | 0.099***(0.01) | 0.015*(0.05) | 0.079**(0.04) | |
| 土地利用混合度 | 0.083***(0.00) | 0.109*(0.10) | 0.075***(0.00) | 0.125*(0.08) | |
| 道路交叉口数 | -0.000(0.91) | -0.002**(0.02) | 0.002***(0.00) | 0.002*(0.08) | |
| 公司企业数 | -0.000(0.70) | -0.000(0.69) | 0.000(0.37) | 0.000(0.63) | |
| 餐饮设施数 | 0.000(0.10) | -0.001(0.17) | 0.000*(0.06) | 0.001(0.29) | |
| 公园广场数 | 0.009(0.14) | 0.044(0.97) | -0.017***(0.00) | 0.011(0.69) | |
| 科教文化机构数 | -0.000***(0.00) | -0.001*(0.08) | -0.000***(0.00) | -0.000(0.50) | |
| 购物中心数 | 0.000(0.22) | 0.000(0.44) | 0.000(0.50) | -0.000**(0.03) | |
| 生活服务设施数 | -0.000(0.23) | -0.002***(0.00) | -0.000(0.74) | 0.002***(0.00) | |
| 距城市中心距离 | 0.077***(0.00) | -0.088***(0.00) | 0.090***(0.00) | 0.041*(0.09) | |
| 距城市次中心距离 | 0.071***(0.00) | 0.003(0.88) | 0.046***(0.00) | -0.042*(0.05) | |
| 轨道交通站点数 | 0.024***(0.00) | 0.025(0.58) | 0.015*(0.09) | 0.069(0.15) | |
| 公交站点数 | 0.003***(0.00) | 0.003*(0.08) | 0.002***(0.00) | -0.004**(0.01) | |
| 样本观测数量/个 | 5 956 | 5 956 | 5 956 | 5 956 | |
| R 2 | 0.530 | 0.530 | 0.520 | 0.520 | |
| 截面个体数量/个 | 1 489 | 1 489 | 1 489 | 1 489 | |
|
1 2023年中国主要城市通勤监测报告. https://bj.bcebos.com/v1/mapopen/cms/report/2023tongqin/index.html
2 https://daas.smartsteps.com/
|
曹新宇. 2015. 社区建成环境和交通行为研究回顾与展望:以美国为鉴. 国际城市规划,30(4):46-52.
|
|
Cao Xinyu. 2015. Examining the Relationship Between Neighborhood Built Environment and Travel Behavior: A Review from the US Perspective. Urban Planning International, 30(4): 46-52.
|
|
Cervero R. 1996. Mixed Land-Uses and Commuting: Evidence from the American Housing Survey. Transportation Research Part A: Policy and Practice, 30(5): 361-377.
|
|
陈博文,周素红,姜超. 2016. 活动视角下建成环境对广州居民通勤效率的影响. 城市规划学刊,(4):67-74.
|
|
Chen Bowen, Zhou Suhong, and Jiang Chao. 2016. The Impacts of Built Environment on Residents' Commuting Efficiency Based on Activities in Guangzhou. Urban Planning Forum, (4): 67-74.
|
|
陈博文. 2017. 建成环境对居民工作日多目的通勤行为的影响——基于广州市中心城区的实证. 城市规划学刊,(5):89-97.
|
|
Chen Bowen. 2017. Study on Impacts of Built Environment on Residents' Multi-Purpose Commuting Trips—A Case of Guangzhou Downtown. Urban Planning Forum, (5): 89-97.
|
|
Ding C, Lin Y, and Liu C. 2014. Exploring the Influence of Built Environment on Tour-Based Commuter Mode Choice: A Cross-Classified Multilevel Modeling Approach. Transportation Research Part D: Transport and Environment, 32: 230-238.
|
|
Ding C, Cao X, and Wang Y. 2018. Synergistic Effects of the Built Environment and Commuting Programs on Commute Mode Choice. Transportation Research Part A: Policy and Practice, 118: 104-118.
|
|
Ewing R and Cervero R. 2010. Travel, the Built Environment. Journal of the American Planning Association, 76(3): 265-294.
|
|
Ewing R and Cervero R. 2017. "Does Compact Development Make People Drive Less?" The Answer is Yes. Journal of the American Planning Association, 83(1): 19-25.
|
|
高瑜堃,赵鹏军. 2024. 手机信令数据在职住空间、出行行为和交通碳排放研究中的应用进展与前景. 热带地理,44(5):877-890.
|
|
Gao Yukun and Zhao Pengjun. 2024. A Review on the Application Progress and Prospect of Mobile Phone Signaling Data in Jobs-Housing Relationship, Travel Behavior and Transportation Carbon Emissions Research. Tropical Geography, 44(5): 877-890.
|
|
Geurs K T and Wee B V. 2006. Ex-Post Evaluation of Thirty Years of Compact Urban Development in the Netherlands. Urban Studies, 43(1): 139-160.
|
|
郭嘉颖,魏也华,陈雯,肖伟烨. 2022. 空间重构背景下城市多中心研究进展与规划实践. 地理科学进展,41(2):316-329.
|
|
Guo Jiaying, Wei Yehua, Chen Wen, and Xiao Weiye. 2022. Progress of Urban Polycentricity Research and Planning Practice in the Context of Spatial Restructuring. Progress in Geography, 41(2): 316-329.
|
|
郭燕,张志斌,陈龙,马晓敏,赵学伟. 2024. 居住自选择视角下城市建成环境对通勤模式选择的影响——以兰州市主城区为例. 干旱区地理,47(2):307-318.
|
|
Guo Yan, Zhang Zhibin, Chen Long, Ma Xiaomin, and Zhao Xuewei. 2024. Impact of Urban Built Environment on Commuting Mode Choices from the Residential Self-Selection Perspective. Arid Land Geography, 47(2): 307-318.
|
|
Hu L and Schneide R J. 2017. Different Ways to Get to the Same Workplace: How Does Workplace Location Relate to Commuting by Different Income Groups? Transport Policy, 59: 106-115.
|
|
黄经南,朱恺易. 2021. 基于POI数据的武汉市公共服务设施布局社会公平绩效评价. 现代城市研究,(6):24-30.
|
|
Huang Jingnan and Zhu Kaiyi. 2021. Wuhan Based on POI Data Social Equity Performance Evaluation of Public Service Facilities Layout in Wuhan Based on POI Data. Modern Urban Research, (6): 24-30.
|
|
LeSage J and Pace R K. 2009. Introduction to Spatial Econometrics.New York: Chapman and Hall/CRC.
|
|
李博,田闯,金翠,史钊源. 2020. 环渤海地区海洋经济增长质量空间溢出效应研究. 地理科学,40(8):1266-1275.
|
|
Li Bo, Tian Chuang, Jin Cui, and Shi Zhaoyuan. 2020. Spatial Spillover Effects and Influence Mechanism of Marine Economic Growth Quality in Bohai Rim Region. Scientia Geographica Sinica, 40(8): 1266-1275.
|
|
李峰清,赵民,黄建中. 2021. 论大城市空间结构的绩效与发展模式选择. 城市规划学刊,(1):18-27.
|
|
Li Fengqing, Zhao Min, and Huang Jianzhong. 2021. The Performance of Spatial Structure and the Choice of Development Model of Maga-City. Urban Planning Forum, (1): 18-27.
|
|
林勋媛,王广兴,胡月明. 2020. 基于开放大数据的广州市中心城区职住平衡特征研究. 热带地理,40(2):254-265.
|
|
Lin Xunyuan, Wang Guangxing, and Hu Yueming. 2020. Characteristics of the Jobs-Housing Balance in Central Guangzhou Based on Open Big Data. Tropical Geography, 40(2): 254-265.
|
|
刘倩,江裕林. 2023. 深圳市建成环境因素对居民通勤效率的影响——基于手机信令数据的分析. 西部人居环境学刊,38(3):47-53.
|
|
Liu Qian and Jiang Yulin.2023. The Effects of Built Environment Factors on Commuting Efficiency of Residents in Shenzhen Based on Cell Phone Data. Journal of Human Settlements in West China, 38(3): 47-53.
|
|
刘望保,陈杰. 2022. 手机信令数据支撑下广州市过剩通勤及其空间分异格局. 热带地理,42(6):965-972.
|
|
Liu Wangbao and Chen Jie. 2022. Excess Commuting and Its Spatial Differentiation Pattern in Guangzhou Supported by Cell Phone Signaling Data. Tropical Geography, 42(6): 965-972.
|
|
刘望保,李彤彤. 2023. 基于手机信令数据的广州市社区建成环境对居民通勤距离的影响研究. 世界地理研究,32(5):79-90.
|
|
Liu Wangbao and Li Tongtong. 2023. Analysis of the Impact of Community Built Environment on Residents' Commuting Distance in Guangzhou Supported by Mobile Signaling Data. World Regional Studies, 32(5): 79-90.
|
|
Long Y and Thill J C. 2015. Combining Smart Card Data and Household Travel Survey to Analyze Jobs–Housing Relationships in Beijing. Computers, Environment and Urban Systems, 53: 19-35.
|
|
Ma X, Zhang J, Ding C, and Wang Y. 2018. A Geographically and Temporally Weighted Regression Model to Explore the Spatiotemporal Influence of Built Environment on Transit Ridership. Computers, Environment and Urban Systems, 70: 113-124.
|
|
Naess P. 2014. Tempest in a Teapot: The Exaggerated Problem of Transport-Related Residential Self-Selection as a Source of Error in Empirical Studies. Journal of Transport and Land Use, 7(3): 57-79.
|
|
Næss P, Cao X Y, and Strand A. 2017. Which D's are the Important Ones? The Effects of Built Environment Characteristics on Driving Distance in Oslo, Stavanger. Journal of Transport, Land Use, 10(1): 945-964.
|
|
Nelson A C. 2017. Compact Development Reduces VMT: Evidence and Application for Planners—Comment on "Does Compact Development Make People Drive Less?". Journal of the American Planning Association, 83(1): 36-41.
|
|
潘海啸,王紫瞻. 2020. 空间单元选择及多维度要素对职住平衡成效的影响. 城市规划学刊,(2):25-31.
|
|
Pan Haixiao and Wang Zizhan. 2020. The Effects of Spatial Measurement Choice and Multidimensional Factors on Jobs-Housing Balance. Urban Planning Forum, (2): 25-31.
|
|
Stevens M R. 2016. Does Compact Development Make People Drive Less? Journal of the American Planning Association, 83(1): 7-18.
|
|
孙斌栋,潘鑫,宁越敏. 2008. 上海市就业与居住空间均衡对交通出行的影响分析. 城市规划学刊,(1):77-82.
|
|
Sun Bindong, Pan. Xin, and Ning Yuemin. 2008. Analysis on Influence of Job-Housing Balance on Commute Travel in Shanghai. Urban Planning Forum, (1): 77-82.
|
|
孙斌栋,但波. 2015. 上海城市建成环境对居民通勤方式选择的影响. 地理学报,70(10):1664-1674.
|
|
Sun Bindong and Dan Bo. 2015. Impact of Urban Built Environment on Residential Choice of Commuting Mode in Shanghai. Acta Geographica Sinica, 70(10): 1664-1674.
|
|
Sun B and Yin C. 2019. Impacts of a Multi-Scale Built Environment and Its Corresponding Moderating Effects on Commute Duration in China. Urban Studies, 57(10): 2115-2130.
|
|
孙铁山,范颖玲,齐云蕾. 2018. 北京公交就业可达性及其地区和人群差异. 地理科学进展,37(8):1066-1074.
|
|
Sun Tieshan, Fan Yingling, and Qi Yunlei. 2018. Job Accessibility by Transit and Variation among Different Population Groups and in Different Regions in Beijing. Progress in Geography, 37(8): 1066-1074.
|
|
Susilo Y O and Maat K. 2007. The Influence of Built Environment to the Trends in Commuting Journeys in the Netherlands. Transportation, 34(5): 589-609.
|
|
仝照民,安睿,刘耀林. 2021. 建成环境对居民通勤方式选择的影响——以武汉市城中村为例. 地理科学进展,40(12):2048-2060.
|
|
Tong Zhaomin, An Rui, and Liu Yaolin. 2021. Impact of the Built Environment on Residents' Commuting Mode Choices: A Case Study of Urban Village in Wuhan City. Progress in Geography, 40(12): 2048-2060.
|
|
王德,李丹,傅英姿. 2020. 基于手机信令数据的上海市不同住宅区居民就业空间研究. 地理学报,75(8):1585-1602.
|
|
Wang De, Li Dan, and Fu Yingzi. 2020. Employment Space of Residential Quarters in Shanghai: An Exploration Based on Mobile Signaling Data. Acta Geographica Sinica, 75(8): 1585-1602.
|
|
王德,韩滨鹂,张天然,游智敏,李心恬. 2024. 手机信令数据的出行测度准确性分析——基于与居民出行调查数据的比较. 地理科学进展,43(5):854-869.
|
|
Wang De, Han Binli, Zhang Tianran, You Zhimin, and Li Xintian. 2024. Accuracy Analysis of Mobile Signaling Data in Measuring Travel Indices: Based on the Comparison with Household Travel Survey. Progress in Geography, 43(5): 854-869.
|
|
Wu W and Hong J. 2017. Does Public Transit Improvement Affect Commuting Behavior in Beijing, China? A Spatial Multilevel Approach. Transportation Research Part D: Transport and Environment, 52: 471-479.
|
|
Yan X X, Zhou J, Sheng F B, and Niu Q. 2022. Influences of Built Environment at Residential, Work Locations on Commuting Distance: Evidence from Wuhan, China. ISPRS International Journal of Geo-Information, 11(2): 13.
|
|
Yang J, Shen Q, Shen J, and He C. 2011. Transport Impacts of Clustered Development in Beijing: Compact Development Versus Overconcentration. Urban Studies, 49(6): 1315-1331.
|
|
Yang H, Lu Y, Wang J J, Zheng Y L, Ruan Z H, and Peng J D. 2023. Understanding Post-Pandemic Metro Commuting Ridership by Considering the Built Environment: A Quasi-Natural Experiment in Wuhan, China. Sustainable Cities and Society, 96: 10.
|
|
尹超英,周建,林丽,邵春福,王晓全,王晟由. 2021. 城市建成环境影响下通勤时间和距离联合建模研究. 北京交通大学学报,45(3):24-29.
|
|
Yin Chaoying, Zhou Jian, Lin Li, Shao Chunfu, Wang Xiaoquan, and Wang Shengyou. 2021. Joint Modeling Research of Commuting Time and Distance Considering the Impacts of Urban Built Environment. Journal of Beijing Jiaotong University, 45(3): 24-29.
|
|
Zhang L, Nasri A, Hong J H, and Shen Q. 2012. How Built Environment Affects Travel Behavior: A Comparative Analysis of the Connections between Land Use and Vehicle Miles Traveled in US Cities. Journal of Transport and Land Use, 5(3): 40-52.
|
|
Zhang M. 2004. The Role of Land Use in Travel Mode Choice: Evidence from Boston and Hong Kong. Journal of the American Planning Association, 70(3): 344-360.
|
|
Zhao P. 2013. The Impact of the Built Environment on Individual Workers' Commuting Behavior in Beijing. International Journal of Sustainable Transportation, 7(5): 389-415.
|
|
Zheng Z, Zhou S, and Deng X. 2021. Exploring Both Home-Based and Work-Based Jobs-Housing Balance by Distance Decay Effect. Journal of Transport Geography, 93: 103043.
|
|
Zhou M, Wang D, and Guan X. 2022. Co-Evolution of the Built Environment and Travel Behaviour in Shenzhen, China. Transportation Research Part D: Transport and Environment, 107: 103291.
|
|
周素红,邓丽芳. 2010. 基于T-GIS的广州市居民日常活动时空关系. 地理学报,65(12):1454-1463.
|
|
Zhou Suhong and Deng Lifang. 2010. Spatio-Temporal Pattern of Residents' Daily Activities Based on T-GIS: A Case Study in Guangzhou, China. Acta Geographica Sinica, 65(12): 1454-1463.
|
/
| 〈 |
|
〉 |