
Comparing and Analyzing Different Spatial Interpolation Methods for Soil-Moisture Estimation in Karst Areas
Received date: 2019-01-05
Request revised date: 2019-07-12
Online published: 2019-11-08
Copyright
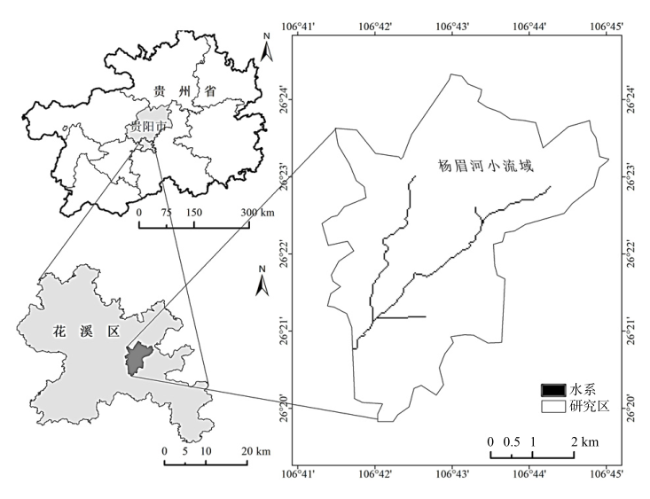
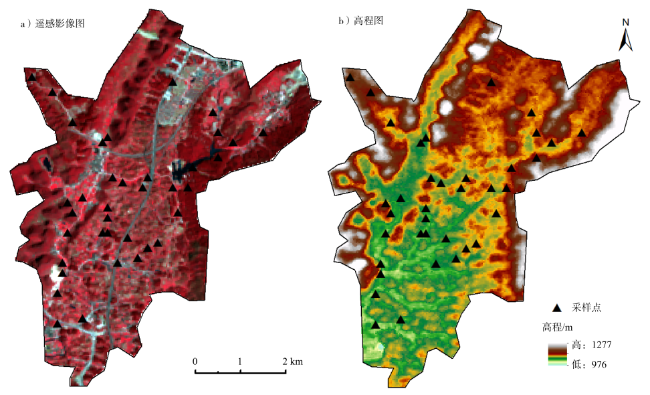
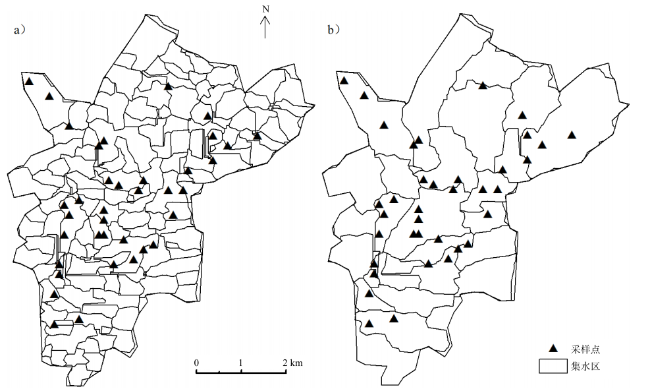
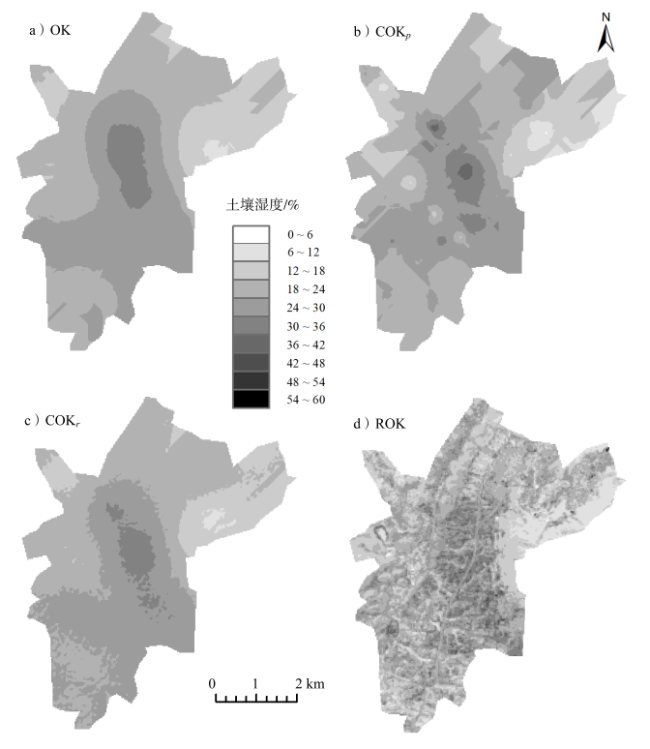
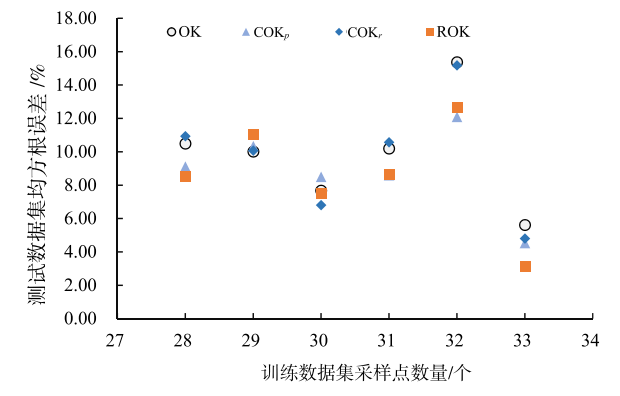
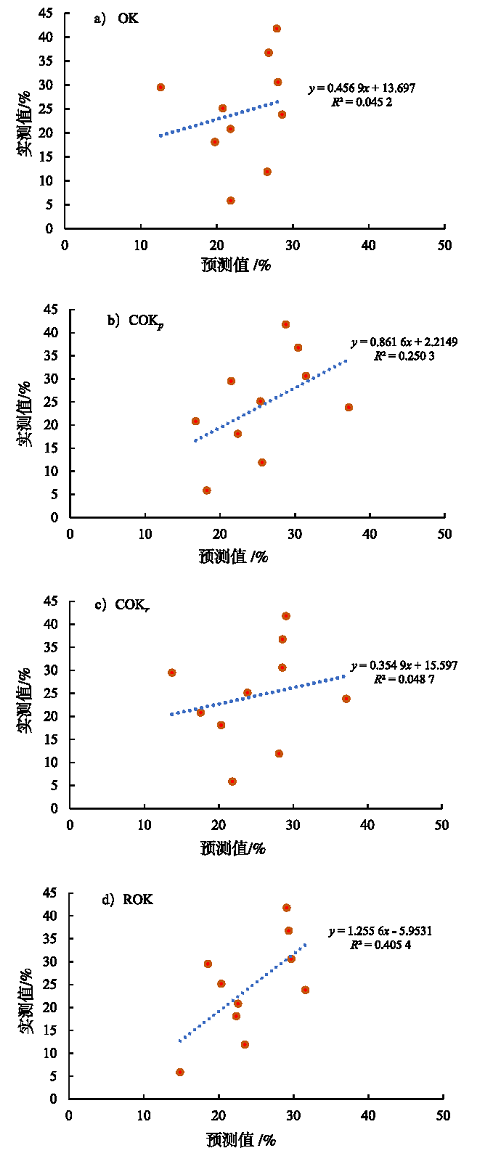
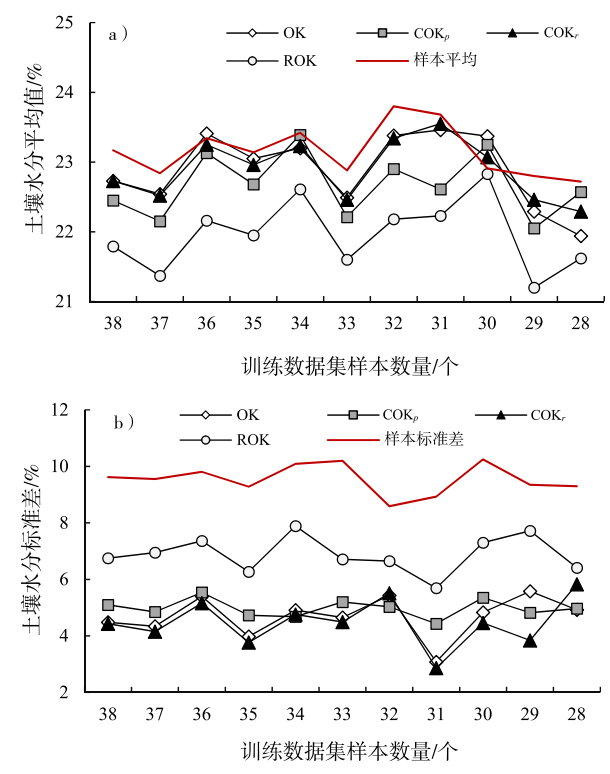
Most precipitation seeps underground and is difficult to capture because of the poor water-holding capacity of soils in karst areas and dual aspects of the hydrogeological structure formed by karstification. Therefore, soil-moisture estimation is critical for karst ecological restoration in karst area and for agricultural development. Using the Yangmei River basin as the research area, environmental factors, such as Normalized Differential Vegetation Index, Wetness Index (WI), altitude, slope, and relative height, were extracted from remote-sensing imagery and Digital-Elevation-Model data. On the basis of correlation analysis, WI was chosen as an auxiliary variable. Spatial soil-moisture interpolation by four methods, namely ordinary kriging, cokriging with WI vector point as auxiliary, cokriging with WI raster, and kriging combined with regression, were applied to soil-moisture sampling and WI raster data. Root Mean Square Error of predicted and measured values and unary linear regression between predicted and measured values were used to estimate the accuracy of different interpolation methods. Results showed the following: 1) From correlation analysis between soil moisture and other environmental factors, we found a significant negative correlation between WI, which is associated with near surface humidity condition, and soil moisture (P=0.01) but no significant correlation between other environmental factors and soil moisture was found. According to the outcome of stepwise regression, WI was chosen and other environmental factors were removed. 2) Kriging combined with regression had the smallest error of estimation in soil moisture in the study area; cokriging had a larger error, and common kriging had the largest error. When interpolating soil-moisture samples by cokriging, using WI vector-point data was more efficient than WI raster data as the auxiliary variable. 3) The soil-moisture surface generated by ordinary kriging was the smoothest, but kriging combined with regression reflected the soil-moisture spatial pattern for the study area to the greatest extent. However, in general, the spatial variation of soil-moisture interpolation results generated by the four methods was all lower than the actual condition as observed. 4) When fewer soil-moisture sample points were used for interpolation, errors of average value and spatial variation results of the four interpolation methods were larger. However, no matter what number of soil-moisture sample points were used, average values of soil-moisture interpolation results from kriging combined with regression were lower than those of ordinary kriging and cokriging, and spatial variations of soil-moisture interpolation results were higher than those of ordinary kriging and cokriging. In conclusion, the accuracy of kriging combined with regression is better than ordinary kriging and cokriging applied in soil-moisture interpolation in karst areas, which were consistent with the result of other research comparing the accuracy of different interpolation methods. To improve the accuracy of the soil-moisture interpolation results, we would need more soil-moisture sample points and higher resolution remote-sensing imagery to extract more-detailed information on environmental factors, particularly those more significantly correlated with soil moisture.
Zhiyan Sun , Qiuwen Zhou , Siqi Zhang , Xiaocha Wei , Longsheng Ma . Comparing and Analyzing Different Spatial Interpolation Methods for Soil-Moisture Estimation in Karst Areas[J]. Tropical Geography, 2019 , 39(5) : 770 -779 . DOI: 10.13284/j.cnki.rddl.003169

表1 38个采样点土壤水分数据及各地表参数的描述统计结果Tab.1 Descriptive statistics of soil moisture content and land surface parameters of these 38 sampling points |
| 统计值 | 平均值 | 标准差 | 极差 | 最大值 | 最小值 |
|---|---|---|---|---|---|
| 土壤水分 | 23.17 | 9.748 | 39.24 | 44.06 | 4.82 |
| 湿度指数 | -404.94 | 268.236 | 876.06 | 91.05 | -785.01 |
| 归一化植被指数 | 0.49 | 0.133 | 0.54 | 0.75 | 0.21 |
| 坡向 | 191.85 | 114.367 | 358.15 | 358.15 | 0.00 |
| 坡度 | 7.32 | 5.831 | 24.74 | 25.07 | 0.34 |
| 海拔高度 | 1 066.11 | 26.533 | 93.00 | 1 125.00 | 1 032.00 |
表2 各类土地覆盖类型采样点数量及土壤水分的描述统计结果Tab.2 Numbers of sampling points and descriptive statistics of soil moisture content and land surface parameters of sampling points in different land cover types |
| 土地利用类型 | 采样点数量/个 | 平均值/% | 最大值/% | 最小值/% | 标准差/% | 坡度/(°) | 海拔高度/m |
|---|---|---|---|---|---|---|---|
| 林地 | 11 | 12.81 | 25.14 | 4.82 | 5.8 | 6.87 | 1 081.73 |
| 灌丛 | 7 | 29.51 | 44.06 | 21.34 | 7.56 | 10.85 | 1 059.14 |
| 草地 | 8 | 31.78 | 41.76 | 21.7 | 6.38 | 7.01 | 1 059.63 |
| 耕地 | 5 | 19.764 | 26.14 | 9.84 | 6.31 | 7.8 | 1 049.8 |
表3 土壤水分与地表参数的Pearson相关分析结果Tab.3 Pearson correlation analysis between soil moisture and surface parameters |
| 地表参数 | 相关系数 | P |
|---|---|---|
| WI | -0.551* | <0.001 |
| NDVI | -0.191 | 0.251 |
| 坡向/(°) | -0.100 | 0.550 |
| 坡度/(°) | -0.049 | 0.769 |
| 海拔高度/m | -0.266 | 0.106 |
| hr100 | 0.266 | 0.107 |
| hr500 | 0.175 | 0.293 |
注:*表示P<0.05;hr100、hr500分别表示采样点在由汇流累积量为100和500个像元的河网提取的集水区内的相对高度。 |
表4 训练数据集的样本数量为28~37时采用的回归模型Tab.4 Regression models used when numbers of sampling points in training set data was 28~37 respectively |
| 训练数据集采样点数量 | 回归模型 | 相关系数 | P |
|---|---|---|---|
| 38 | y=15.056-0.02x | 0.551* | <0.001 |
| 37 | y=14.067-0.021x | 0.595* | <0.001 |
| 36 | y=14.947-0.021x | 0.556* | <0.001 |
| 35 | y=15.238-0.019x | 0.541* | 0.001 |
| 34 | y=14.238-0.025x | 0.630* | <0.001 |
| 33 | y=14.969-0.02x | 0.551* | 0.001 |
| 32 | y=17.587-0.015x | 0.460* | 0.008 |
| 31 | y=15.631-0.018x | 0.501* | 0.004 |
| 30 | y=14.781-0.022x | 0.573* | 0.001 |
| 29 | y=14.514-0.02x | 0.553* | 0.002 |
| 28 | y=16.098-0.017x | 0.525* | 0.004 |
注:x、y分别表示自变量WI与因变量土壤水分;*表示P<0.05。 |
表5 不同空间插值方法结果统计Tab.5 Statistic of results generated by different spatial interpolation methods % |
| 插值方法 | OK | COKp | COKr | ROK |
|---|---|---|---|---|
| 插值结果土壤水分平均值 | 22.73 | 22.45 | 22.73 | 21.79 |
| 插值结果土壤水分标准差 | 4.48 | 5.10 | 4.43 | 6.75 |
| 采样点平均土壤水分 | 23.17 | 23.17 | 23.17 | 23.17 |
表6 验证点预测值标准差对比实测值标准差Tab.6 Standard deviation of predicted value compared with standard deviation of measured value on verification points |
| 采样点数量/个 | 预测值标准差/% | 实测值 标准差/% | ||||
|---|---|---|---|---|---|---|
| 训练数据集 | 测试数据集 | OK | COKp | COKr | ROK | |
| 33 | 5 | 6.67 | 7.51 | 5.76 | 5.42 | 3.70 |
| 32 | 6 | 5.56 | 5.72 | 5.08 | 6.48 | 14.65 |
| 31 | 7 | 2.82 | 6.47 | 2.40 | 6.68 | 12.89 |
| 30 | 8 | 2.65 | 5.26 | 2.81 | 4.60 | 7.12 |
| 29 | 9 | 6.72 | 8.07 | 3.39 | 9.70 | 10.99 |
| 28 | 10 | 5.08 | 6.34 | 6.79 | 5.53 | 10.91 |
| 平均值 | 4.92 | 6.56 | 4.37 | 6.40 | 10.04 | |
| 1 |
|
| 2 |
|
| 3 |
姜勇, 李琪, 张晓珂, 梁文举 . 2006. 利用辅助变量对污染土壤锌分布的克里格估值. 应用生态学报, 17(1):97-101.
[
|
| 4 |
|
| 5 |
|
| 6 |
雷志栋, 胡和平, 杨诗秀 . 1999. 土壤水研究进展与评述. 水科学进展, 10(3):311-318.
[
|
| 7 |
李海滨, 林忠辉, 刘苏峡 . 2001. Kriging方法在区域土壤水分估值中的应用. 地理研究, 20(4):446-452.
[
|
| 8 |
李菊 . 2009. 贵阳市花溪区植被景观格局对地形地貌的响应及其独特性研究. 贵阳:贵州大学.
[
|
| 9 |
刘姣姣, 齐雁冰, 陈洋, 张亮亮, 秦倩茹, 于晓杰 . 2017. 陕西省土壤温度和水分状况估算. 土壤通报, 48(2):335-342.
[
|
| 10 |
罗娅, 刘莉, 王青, 秦琴, 杨抒 . 2017. 应用30 m ASTER GDEM数据估算贵州县域地表河网密度的适应性. 贵州师范大学学报(自然科学版), 35(6):9-15,29.
[
|
| 11 |
|
| 12 |
唐杨, 吉力力·阿不都外力, 刘东伟, 米热班·阿不里米提 . 2011. 基于微地形和土地覆被的土壤水分空间变异性——以玛纳斯河流域绿洲为例. 干旱区研究, 28(2):222-228.
[
|
| 13 |
王晓峰, 张园, 冯晓明, 刘丽丽, 张照营 . 2017. 基于多元回归的黄土沟壑区小流域土壤水分空间模拟. 土壤通报, 48(4):822-829.
[
|
| 14 |
王志强, 刘宝元, 张岩 . 2008. 不同植被类型对厚层黄土剖面水分含量的影响. 地理学报, 63(7):703-713.
[
|
| 15 |
|
| 16 |
肖洪浪, 李锦秀, 赵良菊, 程国栋 . 2007. 土壤水异质性研究进展与热点. 地球科学进展, 22(9):954-959.
[
|
| 17 |
杨明德, 梁虹 . 2000. 峰丛洼地形成动力过程与水资源开发利用. 中国岩溶, 19(1):44-51.
[
|
| 18 |
姚雪玲, 傅伯杰, 吕一河, 孙飞翔, 郭秀江 . 2013. 基于GIS和统计模型的黄土丘陵沟壑区土壤水分插值方法. 水土保持学, 27(6):93-96,102.
[
|
| 19 |
张添佑, 王玲, 王辉, 彭丽, 罗冲 . 2017. 玛纳斯河流域盐渍化灌区生态环境遥感监测研究. 生态学报, 37(9):3009-3018.
[
|
| 20 |
赵国平, 史社强, 李军保 . 2017. 毛乌素沙地采煤塌陷区土壤水分空间变异研究. 水土保持学报, 31(6):90-93,219.
[
|
| 21 |
|
| 22 |
周秋文, 罗雅雪, 张思琪, 岳彩雯 . 2017. 喀斯特地区土壤可蚀性因子空间估算研究进展. 贵州师范大学学报(自然科学版), 35(6):16-21.
[
|
/
| 〈 |
|
〉 |