
Profiles and Mechanisms of Return Migration in Post-Reform Urban China:A Case Study of Four Cities
Received date: 2019-03-28
Request revised date: 2019-07-14
Online published: 2020-02-24
Copyright
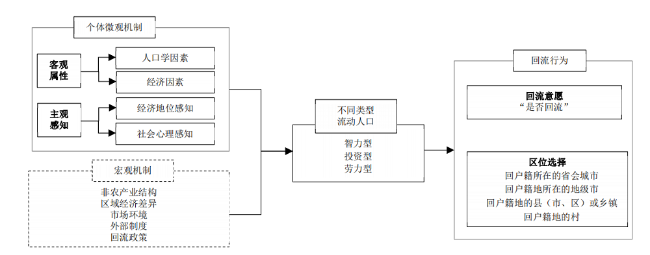
With the deepening of urbanization, new-generation migrants are returning, leading to backflow population. Few studies have explored this emerging phenomenon in urban China. However, majority of the researchers have focused on return behavior based on the “pull-push forces” theory defined by national and urban macro-factors. Less attention has been paid to the individual factors that cause migrants’ return, e.g., social ties and capital, perceived discrimination and exclusion, social integration, and place attachment. To fill this gap, this study examines the determinants of the new-generation migrants’ return intentions and location choices based on the following two micro-level aspects: “objective attributes” and “subjective perceptions.” Using the data collected from the 2014 National Floating Population Dynamic Monitoring Survey and binary and multiple nominal logistic regression models, this study focused on three types of new-generation migrants (born after 1980): skilled migrants, business migrants, and labor migrants in four cities (Beijing, Shenzhen, Chengdu, and Zhongshan). The results can be given as follows. 1) New-generation migrants in urban China exhibited a strong intention to return, and their location choices differed based on their types. Further, 40% of migrants returned to their household region. Labor migrants exhibited the strongest intention (43.7%), followed by business migrants (36.0%) and skilled migrants (27.9%). Proportionately more skilled migrants planned to return to provincial capitals or prefectural cities when compared with the other two cohorts. 2) Binary logistic models identified return determinants; new-generation migrants’ returning intentions were influenced by both the “objective attributes” (demographical and economic condition) and “subjective perceptions” (economic position perception and sociopsychological perception). Males exhibited a greater probability of returning when compared with that exhibited by females. Age, education level, monthly income, and years of leaving hometowns were negatively related with the migrants’ return intentions. Long working hours per day contributed to their return. No evidence has shown that the marital status, number of children under the age of 18, or contract form were significantly related. As for the subjective factors, migrants with high family-related mental burdens and strong native cultural identification were increasingly likely to return. Strong social acculturation caused new-generation migrants to settle down in their destination cities. Importantly, there was no direct link between the migrants’ return intentions and perception of economic position. 3) Regarding determinants in local choices, education level was the most significant factor associated with migrants’ backflow to provincial capitals. Sociopsychological perceptions strongly influenced their backflow to prefectural cities. Demographic factors, such as gender, age, and years of leaving hometowns, exhibited a close relation with returning to counties or townships. Notably, migrants with high monthly incomes exhibited a greater probability of returning to urban settlements when compared with rural areas. This study confirmed that individual factors, particularly sociopsychological perceptions, have an important effect on the new-generation migrants’ return behaviors in urban China. Therefore, we initially call for the government to articulate the significance of social acculturation and integration, targeting the new-generation migrants to avoid “reverse culture shock” in backflow settlements, notably in prefectural cities. Second, the improvement of public services, such as medical care, pension, and children enrollment opportunities, as well as favorable policies and practices should be considered in urban development and planning and established to relieve the migrants’ family burden.
Hanbei Cheng , Yuqi Liu , Feicui Gou , Hongshen Chen , Zhigang Li . Profiles and Mechanisms of Return Migration in Post-Reform Urban China:A Case Study of Four Cities[J]. Tropical Geography, 2020 , 40(1) : 63 -73 . DOI: 10.13284/j.cnki.rddl.003166

表1 样本分布Tab.1 Samplings of new generation migrants in Beijing, Shenzhen, Chengdu and Zhongshan |
| 流动人口类型 | 北京 | 深圳 | 成都 | 中山 | 合计 | |||||||||
|---|---|---|---|---|---|---|---|---|---|---|---|---|---|---|
| 数量/人 | 占比/% | 数量/人 | 占比/% | 数量/人 | 占比/% | 数量/人 | 占比/% | 数量/人 | 占比/% | |||||
| 智力型 | 187 | 19.8 | 155 | 17.4 | 95 | 14.5 | 90 | 11.8 | 527 | 16.2 | ||||
| 投资型 | 105 | 11.1 | 180 | 20.2 | 86 | 13.2 | 121 | 15.9 | 492 | 15.1 | ||||
| 劳力型 | 654 | 69.1 | 557 | 62.4 | 472 | 72.3 | 552 | 72.3 | 2 235 | 68.7 | ||||
| 合计 | 946 | 100 | 892 | 100 | 653 | 100 | 763 | 100 | 3 254 | 100 | ||||
表2 变量定义及特征描述Tab.2 Definition and statistical description of variables in new generation migrants among four cities |
| 变量名称 | 变量定义 | 统计 | 全体样本 | 智力型 | 投资型 | 劳力型 | ||
|---|---|---|---|---|---|---|---|---|
| 客观属性 | 人 口 学 因 素 | 性别 | 男 | 占比/% | 57.74 | 60.15 | 58.74 | 56.96 |
| 女 | 占比/% | 42.26 | 39.85 | 41.26 | 43.04 | |||
| 年龄 | 调查时实际年龄值/岁 | 均值 | 28.98 | 29.08 | 29.49 | 28.84 | ||
| 标准差 | 3.10 | 2.90 | 2.94 | 3.09 | ||||
| 受教育程度 | 初中及以下 | 占比/% | 41.70 | 16.70 | 49.19 | 45.95 | ||
| 高中及专科 | 47.02 | 48.58 | 44.92 | 47.11 | ||||
| 本科以上 | 11.28 | 34.72 | 5.89 | 6.94 | ||||
| 婚姻状况 | 未婚 | 占比/% | 25.90 | 26.90 | 13.60 | 28.40 | ||
| 曾结过婚(已婚、离异及丧偶) | 74.10 | 73.10 | 86.40 | 71.60 | ||||
| <18岁子女数 | 未成年子女数量 | 均值 | 0.85 | 0.67 | 1.18 | 0.82 | ||
| 标准差 | 0.77 | 0.68 | 0.80 | 0.76 | ||||
| 经 济 因 素 | 个人收入 | 个人实际月收入/千元 | 均值 | 4.40 | 5.47 | 5.64 | 3.87 | |
| 标准差 | 3.97 | 3.59 | 6.10 | 3.28 | ||||
| 日工作时长 | 小时 | 均值 | 9.02 | 8.37 | 9.98 | 8.96 | ||
| 标准差 | 1.65 | 1.07 | 2.17 | 1.54 | ||||
| 合同形式 | 签订正式合同(含有固定期限和无固定期限) | 占比/% | 59.20 | 87.50 | 9.10 | 63.60 | ||
| 未签订及其他(如个体户、无单位或劳务协议等) | 40.80 | 12.50 | 90.90 | 36.40 | ||||
| 在外务工时间 | 在外务工实际年限/a(第一次离开户籍地半年以上 至调查时间) | 均值 | 7.47 | 7.98 | 8.19 | 7.19 | ||
| 标准差 | 4.57 | 4.17 | 4.61 | 4.62 | ||||
| 主观感知 | 经济地位感知 | 城乡收入 差异感知 | 经济收入与您老家的亲戚、朋友和同事比?项目打分,由低至高1~10 | 均值 | 5.81 | 6.19 | 5.78 | 5.72 |
| 标准差 | 1.72 | 1.64 | 1.67 | 1.73 | ||||
| 社 会 心 理 感 知 | 城市社会适应 | 觉得自己或家人与本地人相处情况? 来往很少=1,不融洽=2,一般=3,比较融洽=4,很融洽=5 | 均值 | 3.84 | 3.97 | 3.88 | 3.79 | |
| 标准差 | 1.00 | 1.01 | 1.00 | 0.99 | ||||
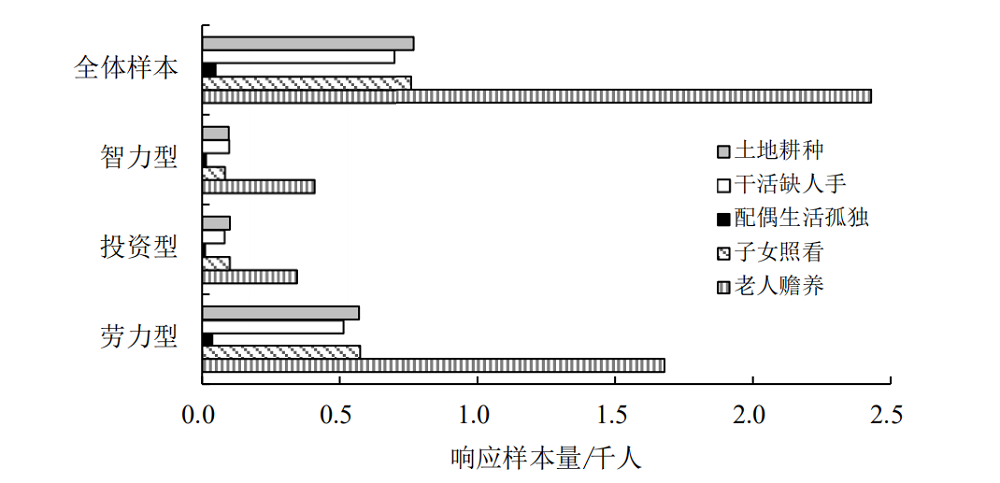
| 家庭“心理 成本”指数 | 目前您在老家操心的事情:老人赡养、子女照看、 配偶生活孤独、干活缺人手、土地耕种和其他各项 记为1分,6项得分总和,得分范围0~6 | 均值 | 2.45 | 2.32 | 2.28 | 2.51 | ||
| 标准差 | 1.09 | 0.99 | 1.05 | 1.11 | ||||
| 家乡生活 方式认同 | 是否愿意保持家乡生活方式,如饮食习惯等,非常 不愿意—非常愿意:1~5 | 均值 | 3.44 | 3.39 | 3.56 | 3.42 | ||
| 标准差 | 0.82 | 0.80 | 0.81 | 0.82 | ||||
表 3 不同类型新生代流动人口的回流意愿及区位选择Tab.3 The comparison of returning intentions and location choices of new generation migrants |
| 回流行为 | 项目 | 全体样本 | 智力型 | 投资型 | 劳力型 |
|---|---|---|---|---|---|
| 回流意愿(N=3 254) | 回流 | 40.0 | 27.9 | 36.0 | 43.7 |
| 不回流 | 60.0 | 72.1 | 64.0 | 56.3 | |
| 区位选择(N=1 301) | 回流至户籍地附近的城市(镇) | 40.6 | 59.9 | 32.8 | 39.1 |
| 户籍地所在的省会城市(非现流入地) | 2.5 | 6.1 | 2.3 | 1.9 | |
| 户籍地所在的地级市(非现流入地) | 8.3 | 15.0 | 6.2 | 7.7 | |
| 户籍地的县(市、区)或乡镇 | 29.8 | 38.8 | 24.3 | 29.5 | |
| 回流至户籍地乡村 | 59.4 | 40.1 | 67.2 | 60.9 |
表4 新生代流动人口的回流意愿的模型结果Tab.4 Binary logistic regression results of returning intentions in new generation migrants |
| 因变量(回流=1,不回流=0) | 模型一:全体样本 | 模型二:智力型 | 模型三:投资型 | 模型四:劳力型 | 模型五:稳健性检验 | ||||||||||||
|---|---|---|---|---|---|---|---|---|---|---|---|---|---|---|---|---|---|
| 估计值 | 标准误 | 估计值 | 标准误 | 估计值 | 标准误 | 估计值 | 标准误 | 估计值 | 标准误 | ||||||||
客 观 属 性 | 人口学因素 | 性别(参照组=女) | 0.307*** | 0.079 | 0.820*** | 0.232 | 0.379* | 0.216 | 0.220** | 0.094 | -0.047 | 0.134 | |||||
| 年龄 | -0.046*** | 0.015 | -0.061 | 0.046 | -0.142*** | 0.041 | -0.022 | 0.018 | -0.014** | 0.025 | |||||||
| 受教育程度(参照组:初中及以下) | 高中及专科 | -0.552*** | 0.086 | -0.150 | 0.296 | -0.608*** | 0.226 | -0.565*** | 0.1 | -0.604*** | 0.147 | ||||||
| 本科以上 | -1.173*** | 0.166 | -0.566 | 0.366 | -2.091*** | 0.684 | -1.144*** | 0.221 | -0.562** | 0.282 | |||||||
| 婚姻状况(参照组=未婚) | 0.129 | 0.121 | 0.176 | 0.317 | 0.177 | 0.394 | 0.081 | 0.143 | -0.273 | 0.201 | |||||||
| 18岁以下子女数 | 0.012 | 0.074 | -0.008 | 0.216 | 0.123 | 0.18 | -0.010 | 0.09 | -0.076 | 0.132 | |||||||
| 经济因素 | 个人收入 | -0.033** | 0.013 | -0.123*** | 0.046 | -0.012 | 0.019 | -0.045** | 0.021 | -0.036 | 0.031 | ||||||
| 日工作时长 | 0.042* | 0.025 | 0.057 | 0.105 | 0.031 | 0.049 | 0.051* | 0.031 | 0.052 | 0.044 | |||||||
| 合同形式(参照组=未签订及其他) | 签订正式 劳动合同 | 0.089 | 0.093 | 0.410 | 0.34 | 0.577 | 0.386 | 0.017 | 0.101 | 0.284 | 0.155 | ||||||
| 在外务工时间 | -0.018* | 0.009 | -0.010 | 0.029 | 0.019 | 0.025 | -0.024** | 0.011 | -0.062*** | 0.017 | |||||||
| 主 观 感 知 | 经济地位感知 | 城乡收入差异感知 | -0.023 | 0.023 | 0.100 | 0.068 | -0.126* | 0.066 | -0.025 | 0.027 | -0.021 | 0.038 | |||||
| 社会心理感知 | 城市社会适应 | -0.146*** | 0.041 | -0.033 | 0.107 | -0.321*** | 0.111 | -0.118** | 0.049 | -0.264*** | 0.063 | ||||||
| 家庭“心理成本”指数 | 0.292*** | 0.037 | 0.335*** | 0.107 | 0.120 | 0.099 | 0.312*** | 0.043 | 0.107** | 0.060 | |||||||
| 家乡生活方式认同 | 0.225*** | 0.048 | 0.286** | 0.135 | 0.379*** | 0.132 | 0.188*** | 0.057 | 0.265*** | 0.082 | |||||||
| 流入地城市等级 (参照组= 北京) | 深圳 | 0.237** | 0.105 | 0.614** | 0.286 | -0.353 | 0.279 | 0.285** | 0.128 | 0.279* | 0.181 | ||||||
| 成都 | -0.922*** | 0.122 | -0.433 | 0.353 | -1.222*** | 0.369 | -1.015*** | 0.142 | -0.090 | 0.205 | |||||||
| 中山 | -0.289** | 0.114 | -0.100 | 0.364 | -0.749** | 0.325 | -0.252* | 0.132 | 0.127** | 0.200 | |||||||
| 移民类别(参照组= 智力型) | 投资型 | 0.018 | 0.164 | — | — | — | -0.320 | 0.324 | |||||||||
| 劳力型 | 0.338*** | 0.12 | — | — | — | 0.275 | 0.218 | ||||||||||
| 常数项 | -0.033 | 0.559 | -2.084 | 1.856 | 3.787*** | 1.445 | -0.254 | 0.644 | -1.897** | 0.942 | |||||||
| 似然比 | 3 930.957*** | 551.690*** | 563.619*** | 2 767.208*** | 1 737.980*** | ||||||||||||
| 考克斯-斯奈尔R2 | 0.129 | 0.128 | 0.149 | 0.124 | 0.039 | ||||||||||||
| 内戈尔科R2 | 0.174 | 0.184 | 0.204 | 0.167 | 0.088 | ||||||||||||
| 解释比/% | 66.7 | 73.4 | 69.1 | 65.3 | 91.7 | ||||||||||||
| 样本数量/个 | 3 254 | 527 | 492 | 2 235 | 3 254 | ||||||||||||
注:*、**和***分别代表P<0.1、P<0.05、P<0.01。 |
表5 新生代流动人口的回流区位选择的模型结果Tab.5 Multiple Nominal Logistic regression results of location choices in new generation migrants |
| 模型六:全体样本 | 模型七:智力型 | 模型八:投资型 | 模型九:劳力型 | ||||||||||||||
|---|---|---|---|---|---|---|---|---|---|---|---|---|---|---|---|---|---|
| 参照组:回流至户籍地的村 | 省会 城市 | 地级市 | 县(市、 区)或 乡镇 | 省会 城市 | 地级市 | 县(市、 区)或 乡镇 | 省会城市 和地级市 | 县(市、 区)或 乡镇 | 省会 城市 | 地级市 | 县(市、 区)或 乡镇 | ||||||
| 系数 | 系数 | 系数 | 系数 | 系数 | 系数 | 系数 | 系数 | 系数 | 系数 | 系数 | |||||||
| 客 观 属 性 | 人口学因素 | 性别(参照组=女) | -0.231 | -0.359 | -0.284** | -0.323 | 0.044 | -0.596 | -0.145 | -0.593 | 0.067 | -0.660** | -0.236 | ||||
| 年龄 | -0.060 | 0.007 | -0.054** | -0.253 | 0.022 | 0.092 | -0.030 | -0.114 | -0.026 | 0.015 | -0.061** | ||||||
| 受教育程度(参照组:初中及以下) | 高中及专科 | 1.214** | 0.543** | 0.341** | -0.794 | -0.693 | 0.447 | 1.086 | 0.821* | 1.473** | 0.660** | 0.281* | |||||
| 本科以上 | 3.368*** | 0.848* | 0.650* | 1.757 | 0.512 | 0.831 | -12.860 | 1.422 | 3.851*** | 0.602 | 0.602 | ||||||
| 婚姻状况(参照组=未婚) | 1.066* | -0.230 | -0.080 | 0.268 | -0.295 | -0.180 | 0.173 | -1.400* | 1.572* | -0.117 | -0.098 | ||||||
| <18岁子女数 | -0.023 | -0.287 | -0.005 | 0.673 | 0.583 | -0.336 | -0.175 | 0.451 | 0.003 | -0.657** | 0.027 | ||||||
| 经济因素 | 个人收入 | 0.099** | 0.108*** | 0.079*** | 0.276* | 0.169 | 0.115 | 0.065 | 0.063 | 0.197** | 0.217*** | 0.096** | |||||
| 日工作时长 | 0.184 | 0.112 | 0.064 | -1.493 | 0.354 | 0.434* | 0.193 | 0.009 | 0.466*** | 0.077 | 0.063 | ||||||
| 合同形式(参照组= 未签订及其他) | 签订正式 劳动合同 | 0.300 | 0.298 | 0.120 | -0.275 | 0.753 | 1.112 | -0.181 | 0.199 | 1.101* | 0.277 | 0.060 | |||||
| 在外务工时间 | -0.043 | -0.014 | 0.043*** | -0.046 | -0.136* | 0.009 | 0.061 | 0.009 | -0.155** | -0.015 | 0.051*** | ||||||
| 主 观 感 知 | 经济地位感知 | 城乡收入差异感知 | -0.177 | -0.067 | -0.008 | -0.227 | -0.168 | -0.177 | 0.396* | 0.088 | -0.409*** | -0.145* | 0.003 | ||||
| 社会心理感知 | 城市社会适应 | -0.112 | 0.213* | -0.023 | 0.443 | 0.699** | 0.340 | 0.179 | -0.463** | -0.314 | 0.132 | -0.009 | |||||
| 家庭“心理成本”指数 | -0.064 | -0.240** | -0.129** | 0.086 | -0.248 | -0.400** | -0.647* | -0.020 | 0.130 | -0.225* | -0.098 | ||||||
| 家乡生活方式认同 | -0.258 | -0.400*** | -0.128 | -0.347 | 0.085 | 0.281 | -0.185 | -0.877*** | -0.206 | -0.529*** | -0.083 | ||||||
| 流入地城市等级(参照组=北京) | 深圳 | -1.092** | 0.222 | -0.372** | 1.017 | 0.084 | -0.498 | -0.753 | -0.283 | -1.433** | 0.332 | -0.341* | |||||
| 成都 | 0.357 | 0.719** | 0.519** | 1.227 | 0.512 | -0.042 | 0.585 | 2.050** | 0.451 | 1.018** | 0.478** | ||||||
| 中山 | -2.664** | -0.287 | -0.807*** | 1.453 | -1.361 | -0.697 | -1.937 | -1.046 | -16.185 | 0.154 | -0.837*** | ||||||
| 移民类别(参照组=智力型) | 投资型 | -0.893 | -1.158** | -0.939*** | — | — | — | — | — | — | — | — | |||||
| 劳力型 | -0.862* | -0.775** | -0.484** | — | — | — | — | — | — | — | — | ||||||
| 常数项 | -1.324 | -1.179 | 1.309 | 15.346 | -6.354 | -7.382* | -4.797 | 6.755** | -5.666 | -1.084 | 0.586 | ||||||
| 似然比 | 2 305.134*** | 349.574*** | 212.427*** | 1 658.927*** | |||||||||||||
| 考克斯-斯奈尔R2 | 0.151 | 0.320 | 0.416 | 0.159 | |||||||||||||
| 内戈尔科R2 | 0.177 | 0.353 | 0.505 | 0.188 | |||||||||||||
| 样本数量/个 | 1 301 | 147 | 177 | 977 | |||||||||||||
注:1)*、**、***分别代表P<0.1、P<0.05、P<0.01;2)由于投资型新生代流动人口选择回流至户籍地所在的省会城市的样本量较少(N=4),为了避免估计偏误,在模型八中将省会城市和地级市样本合并进行模型估计。 |
| [1] |
|
| [2] |
|
| [3] |
|
| [4] |
陈宏胜, 王兴平, 刘晔, 李志刚 . 2017. “理性”与“感性”之间:上海流动人口迁居意愿研究. 现代城市研究,( 7):100-106.
[
|
| [5] |
|
| [6] |
|
| [7] |
|
| [8] |
高更和, 曾文凤, 刘明月 . 2017. 省际流动农民工回流区位及影响因素——以河南省12个村为例. 经济地理, 37(6):151-155.
[
|
| [9] |
国家卫生和计划生育委员会流动人口司. 2018. 中国流动人口发展报告2018. 北京:中国人口出版社.
[ National Health and Family Planning Commission of P R China. 2018. Report on China’s Migrant Population Development. Beijing: China Population Publishing House. ]
|
| [10] |
|
| [11] |
胡枫, 史宇鹏 . 2013. 农民工回流的选择性与非农就业:来自湖北的证据. 人口学刊, 35(2):71-80.
[
|
| [12] |
|
| [13] |
|
| [14] |
|
| [15] |
|
| [16] |
梁海艳, 李灿松 . 2015. 为何流动人口徘徊于农村与城市?——基于我国中西部地区六省数据的分析. 人口与发展, 21(1):32-40.
[
|
| [17] |
刘晔, 沈建法, 刘于琪 . 2013. 西方高端人才跨国流动研究述评. 人文地理, 28(2):7-12.
[
|
| [18] |
刘云刚, 燕婷婷 . 2013. 地方城市的人口回流与移民战略——基于深圳-驻马店的调查研究. 地理研究, 32(7):1280-1290.
[
|
| [19] |
李志刚 . 2012. 中国大都市新移民的住房模式与影响机制. 地理学报, 67(2):189-200.
[
|
| [20] |
|
| [21] |
|
| [22] |
祁新华, 朱宇, 周燕萍 . 2012. 乡村劳动力迁移的“双拉力”模型及其就地城镇化效应——基于中国东南沿海三个地区的实证研究. 地理科学, 32(1):25-30.
[
|
| [23] |
任远, 施闻 . 2015. 农村劳动力外出就业视角下的城镇化发展趋势. 同济大学学报(社会科学版), 26(2):48-56.
[
|
| [24] |
沈建法 . 2019. 中国人口迁移,流动人口与城市化-现实,理论与对策. 地理研究, 38(1):33-44.
[
|
| [25] |
石智雷, 薛文玲 . 2015. 中国农民工的长期保障与回流决策. 中国人口·资源与环境, 25(3):143-152.
[
|
| [26] |
王利伟, 冯长春, 许顺才 . 2014. 传统农区外出劳动力回流意愿与规划响应——基于河南周口市问卷调查数据. 地理科学进展, 33(7):990-999.
[
|
| [27] |
|
| [28] |
吴文恒, 张敬飒, 徐凯颖, 屈英豪, 朱虹颖 . 2016. 城镇购房衡量的农业转移人口流向特征与形成机制. 地理学报, 71(10):1680-1695.
[
|
| [29] |
王子成, 赵忠 . 2013. 农民工迁移模式的动态选择:外出、回流还是再迁移. 管理世界,( 1):78-88.
[
|
| [30] |
夏柱智, 贺雪峰 . 2017. 半工半耕与中国渐进城镇化模式. 中国社会科学,( 12):117-137.
[
|
| [31] |
殷江滨, 李郇 . 2012. 外出务工经历对回流后劳动力非农就业的影响——基于广东省云浮市的实证研究. 中国人口·资源与环境, 22(9):108-115.
[
|
| [32] |
殷江滨 . 2015. 劳动力回流的驱动因素与就业行为研究进展. 地理科学进展, 34(9):1084-1095.
[
|
| [33] |
杨菊华 . 2018. 中国流动人口的城市逐梦. 北京:经济科学出版社.
[
|
| [34] |
杨忍, 徐茜, 张琳, 陈燕纯 . 2018. 珠三角外围地区农村回流劳动力的就业选择及影响因素. 地理研究, 37(11):183-195.
[
|
| [35] |
杨云彦, 石智雷 . 2012. 中国农村地区的家庭禀赋与外出务工劳动力回流. 人口研究, 36(4):3-17.
[
|
| [36] |
周大鸣, 杨小柳 . 2014. 从农民工到城市新移民:一个概念、一种思路. 中山大学学报(社会科学版),( 5):144-154.
[
|
| [37] |
张丽琼, 朱宇, 林李月 . 2016. 家庭因素对农民工回流意愿的影响. 人口与社会, 32(3):58-66.
[
|
| [38] |
张甜, 朱宇, 林李月 . 2017. 就地城镇化背景下回流农民工居住区位选择——以河南省永城市为例. 经济地理, 37(4):84-91.
[
|
| [39] |
朱宇, 余立, 林李月, 董洁霞 . 2012. 两代流动人口在城镇定居意愿的代际延续和变化——基于福建省的调查. 人文地理, 27(3):1-6,43.
[
|
| [40] |
|
/
| 〈 |
|
〉 |