
Spatial Distribution and Format difference of Large-Scale Retail Business Facilities: A Case Study of Guangzhou Based on POI Data
Received date: 2019-04-19
Request revised date: 2019-07-04
Online published: 2020-02-24
Copyright
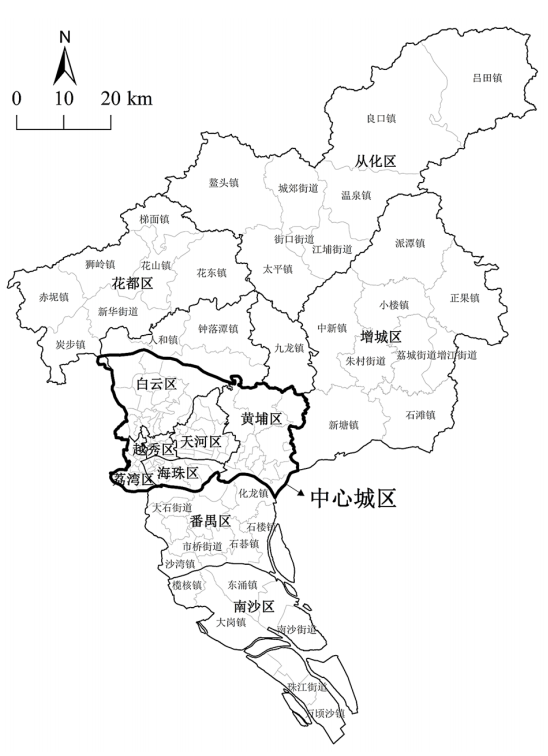
A study on the spatial distribution and the format difference of large-scale retail business facilities is always essential to the optimization of urban business resources, and using POI (Point of Interest) data instead of traditional survey data increases the preciseness and reliability of the results of such a study. Therefore, taking Guangzhou as an example, based on large-scale retail business facilities POI data and using spatial econometric methods, this paper analyzes spatial distribution characteristics and the influencing factors of the overall distribution and the different format distribution of large-scale retail business facilities to improve relative studies of large-scale retail business facilities and to promote the targeted planning of large-scale retail business facilities further. The results of the case study are as follows: 1) Regarding the spatial distribution characteristics, generally, large-scale retail business facilities in Guangzhou form a multi-central agglomeration, and the degree of agglomeration decreases from the downtown area to the periphery. In addition, large-scale retail business facilities are distributed along the main roads, connecting important business areas to each other. Moreover, they are obviously adjacent to the metro stations in the city center but are not so obvious in the whole city because the city metro system is incomplete. There are differences in the distribution of the three different retail formats. Large-scale shopping malls are distributed mainly in the city center and in the sub-centers of the city and are more adjacent to the metro stations than the other two formats are. The distribution of large-scale supermarkets diffuses from the downtown area to the periphery. Large-scale specialty stores are distributed mainly in the periphery of the downtown area and are more adjacent to the main roads than the other two formats are. 2) Regarding the influencing factors, population, economic development, and rent have a significant effect on the overall distribution and the distribution of the three retail formats. The factors influencing the different formats also have differences. Distance to the city center has a positive impact on both the distribution of large-scale supermarkets and large-scale specialty stores, meaning that their distribution prefers farther location from the city center. Rent has a positive effect on the overall distribution and the distribution of large-scale shopping malls. Road density and proximity to life centers have a positive influence on the distribution of large-scale supermarkets, while proximity to industrial parks and specialized wholesale markets has a positive effect on the distribution of large-scale specialty stores. According to these results, the planning of large-scale retail business facilities should make efforts to meet the different demands of the different retail formats. The efforts include building more large-scale shopping malls in the periphery area with a growing population and rich land resource, building more large-scale supermarkets in the neighborhood of new life centers, and building more specialty stores near relative industrial parks and specialized wholesale markets properly. Through these efforts, the planning of large-scale retail business facilities can be promoted in a more detailed and more effective way.
Lina Zhou , Lixun Li . Spatial Distribution and Format difference of Large-Scale Retail Business Facilities: A Case Study of Guangzhou Based on POI Data[J]. Tropical Geography, 2020 , 40(1) : 88 -100 . DOI: 10.13284/j.cnki.rddl.003164

Y=βX+Φ,Φ=λWΦ+ε
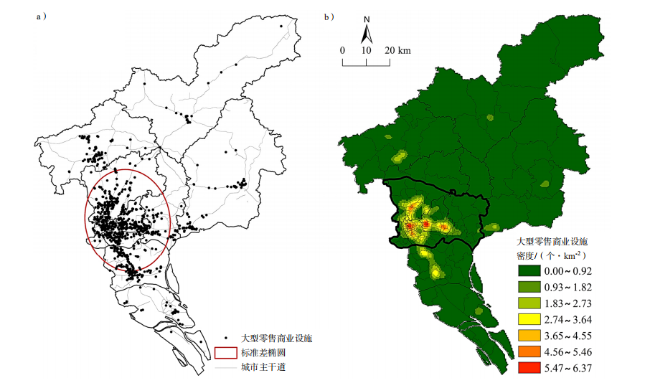
图3 广州市大型零售商业设施POI热点(a)、核密度分析(b)Fig.3 The distribution (a) and kernel density (b) of large-scale retail business facilities in Guangzhou |
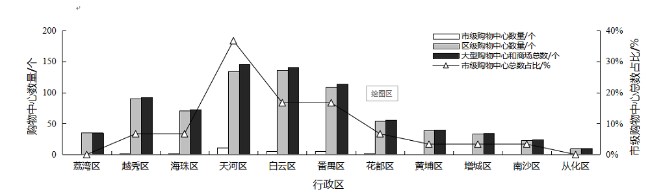
表1 广州市大型零售商业设施分区分类型数量统计Tab.1 Distribution of three kinds of large-scale retail business facilities in Guangzhou |
| 区名 | 大型零售 商业设施 | 大型购物中 心和商场 | 大型综合 超市 | 大型专业店 |
|---|---|---|---|---|
| 荔湾区 | 48 | 35 | 2 | 11 |
| 越秀区 | 109 | 92 | 13 | 4 |
| 海珠区 | 125 | 73 | 19 | 33 |
| 天河区 | 234 | 145 | 26 | 63 |
| 白云区 | 259 | 141 | 28 | 90 |
| 番禺区 | 195 | 114 | 20 | 61 |
| 花都区 | 99 | 56 | 13 | 30 |
| 黄埔区 | 65 | 40 | 6 | 19 |
| 增城区 | 81 | 34 | 11 | 36 |
| 南沙区 | 32 | 24 | 4 | 4 |
| 从化区 | 27 | 10 | 3 | 14 |
| 中心城区 | 840 | 530 | 91 | 219 |
| 全市 | 1 274 | 764 | 145 | 365 |
表2 大型零售商业设施总体与3种业态的交通空间分布指向性分析Tab.2 Traffic direction analysis of spatial distribution of large-scale retail business facilities |
| 指向性 | 区域 | 指标 | 大型零售商业设施总体 | 大型购物中心和商场 | 大型综合超市 | 大型专业店 |
|---|---|---|---|---|---|---|
| 道路交通 指向性 (100 m 缓冲区) | 全市 | 缓冲区内设施数量占比/% | 74.07 | 73.09 | 61.54 | 81.10 |
| 设施到干道最邻近距离/m | 94.41 | 91.63 | 144.95 | 80.57 | ||
| 中心城区 | 缓冲区内设施数量占比/% | 76.79 | 77.17 | 63.74 | 81.28 | |
| 设施到干道最邻近距离/m | 84.83 | 80.98 | 125.86 | 77.09 | ||
| 轨道交通 指向性 (700 m 缓冲区) | 全市 | 缓冲区内设施数量占比/% | 48.29 | 53.22 | 43.56 | 38.46 |
| 设施到站点最邻近距离/m | 1 002.68 | 968.98 | 1 137.54 | 1 028.03 | ||
| 中心城区 | 缓冲区内设施数量占比/% | 60.79 | 65.79 | 56.96 | 56.96 | |
| 设施到站点最邻近距离/m | 748.39 | 740.06 | 654.20 | 833.81 |
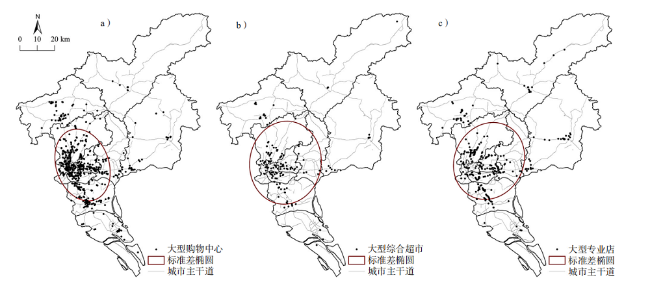
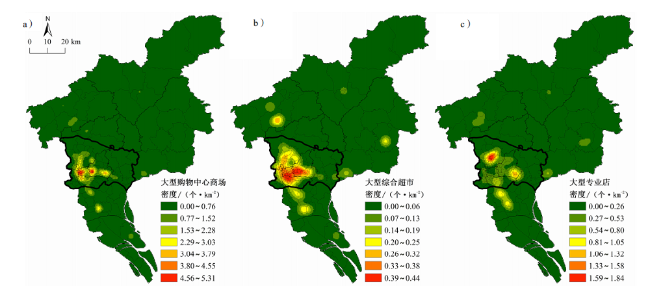
图4 广州市大型购物中心和商场(a)、大型综合超市(b)、大型专业店(c)的POI热点Fig.4 Distribution of large-scale shopping centers (a), supermarkets (b) and specialty stores (c) in Guangzhou |
图 5 广州市大型购物中心和商场(a)、大型综合超市(b)、大型专业店(c)的核密度分布Fig.5 The kernel density of large-scale shopping centers (a), supermarkets (b) and specialty stores (c) in Guangzhou |
表3 广州市大型综合超市分品牌分区域数量统计Tab.3 The brands and distribution of large-scale supermarkets in Guangzhou |
| 区名 | 总计 | 麦德龙 | 沃尔玛 | 家乐福 | 永旺 | 卜蜂莲花 | 世纪华联 | 百佳 | 好又多 | 华润万家 | 广百超市 | 大润发 | 其他 |
|---|---|---|---|---|---|---|---|---|---|---|---|---|---|
| 荔湾区 | 2 | 0 | 0 | 0 | 0 | 1 | 0 | 0 | 0 | 1 | 0 | 0 | 0 |
| 越秀区 | 13 | 0 | 2 | 1 | 2 | 0 | 1 | 4 | 0 | 2 | 1 | 0 | 0 |
| 海珠区 | 19 | 0 | 4 | 1 | 0 | 0 | 0 | 7 | 1 | 3 | 0 | 0 | 3 |
| 天河区 | 26 | 1 | 2 | 1 | 7 | 1 | 1 | 4 | 0 | 4 | 3 | 0 | 2 |
| 白云区 | 28 | 2 | 5 | 1 | 3 | 2 | 4 | 1 | 3 | 1 | 0 | 0 | 6 |
| 番禺区 | 20 | 1 | 2 | 1 | 3 | 0 | 1 | 2 | 1 | 2 | 1 | 1 | 5 |
| 花都区 | 13 | 1 | 0 | 1 | 1 | 0 | 2 | 0 | 1 | 1 | 1 | 1 | 4 |
| 黄埔区 | 6 | 0 | 1 | 0 | 0 | 0 | 1 | 1 | 2 | 0 | 0 | 0 | 1 |
| 增城区 | 11 | 0 | 0 | 0 | 0 | 1 | 1 | 1 | 1 | 1 | 2 | 2 | 2 |
| 南沙区 | 4 | 0 | 0 | 0 | 1 | 0 | 0 | 0 | 1 | 0 | 0 | 2 | 0 |
| 从化区 | 3 | 0 | 1 | 0 | 0 | 0 | 0 | 0 | 1 | 0 | 1 | 0 | 0 |
| 总计 | 145 | 5 | 17 | 6 | 17 | 5 | 11 | 20 | 11 | 15 | 9 | 6 | 23 |
注:因内地TESCO已统一更名为华润万家,因此将其并入华润万家统计;同理吉之岛并入永旺统计。 |
表4 影响因素的变量体系构建及其说明Tab.4 Variables affecting spatial distribution of large-scale retail business facilities in Guangzhou |
| 变量代码 | 变量名称 | 变量意义及选取原因 | |
|---|---|---|---|
| A 人口因素 | A1 | 人口规模 | 人口规模与零售商业设施潜在的消费者规模具有密切联系。 |
| B 经济因素 | B1 | 国内生产总值 | 经济发展水平在一定程度上影响居民可支配收入和消费性支出水平,进而影响居民商业消费。 |
| C 交通因素 | C1 | 路网密度 | 路网密度是衡量区域交通通达性的一项重要指标,在通达性便利的区域往往零售商业设施集聚度高(王珏晗 等,2018)。 |
| C2 | 地铁站密度 | 快速轨道交通对提高区域交通通达性具有重要作用,拥有轨道站点的区域交通便利性更高,对人口和商业活动的集聚有促进作用(Bollinger et al., 1997)。 | |
| D 区位因素 | D1 | 距市中心的距离* | 距离城市中心越近,该区域在城市空间结构中所处的等级往往越高,具有较好的服务设施配套和商业氛围(Christoph et al., 2008)。 |
| E 租金因素 | E1 | 平均商铺租金水平 | 不同等级、不同类别零售商业设施的布局选择受其不同盈利能力和不同承租能力的影响和制约(王祥利,2011)。 |
注:鉴于广州市城市发展的双核空间结构,此表中提及的市中心有2处,分别为广州市越秀区与天河区核心商务区的几何中心;D1代表的“距市中心的距离”为各镇街几何中心到最近市中心的距离。 |
表5 广州市大型零售商业设施空间分布的影响因素回归结果Tab.5 Regression result of influencing factors of spatial distribution of large-scale retail business facilities in Guangzhou |
| 变量代码 | 大型零售商业设施 | ||
|---|---|---|---|
| OLS | SLM | SEM | |
| A1 | 0.788*** | 0.725*** | 0.706*** |
| B1 | 0.169** | 0.165** | 0.218*** |
| C1 | 0.165 | 0.112 | 0.140 |
| C2 | -0.083 | 0.046 | 0.134 |
| D1 | 0.132 | 0.135 | 0.148 |
| E1 | 0.255** | 0. 253** | 0.247** |
| R2 | 0.464 | 0.480 | 0.487 |
| AIC | 377.917 | 375.413 | 373.714 |
| SC | 399.443 | 400.014 | 395.240 |
| LogL | -181.958 | -179.706 | -179.857 |
注:*、**、***分别代表在10%、5%、1%的水平上显著。 |
表6 广州市分业态大型零售商业设施空间分布的影响因素回归结果Tab.6 Regression result of influencing factors of spatial distribution of large-scale retail business facilities in different formats in Guangzhou |
| 变量 代码 | OLS | ||
|---|---|---|---|
| 大型购物中心和商场 | 大型综合超市 | 大型专业店 | |
| A1 | 0.702*** | 0.338*** | 0.466*** |
| B1 | 0.206*** | 0.075* | -0.001 |
| C1 | 0.106 | 0.269*** | 0.220 |
| C2 | -0.176 | 0.170 | -0.053 |
| D1 | -0.019 | 0.228*** | 0.443*** |
| E1 | 0.177* | 0.077 | —1) |
| R2 | 0.497 | 0.334 | 0.280 |
| AIC | 337.343 | 229.425 | 362.828 |
| SC | 358.869 | 250.951 | 384.354 |
| LogL | -161.671 | -107.712 | -174.414 |
注:1)由于大型专业店中数量占比较大的家居建材类和汽车销售类的专业店很多直接在相关产业园或专业市场内部或附近圈地作铺,租金成本水平较低,而在房天下和58同城中发布的此类租金信息较少,导致此租金数据具有一定的局限性,因此不将租金因素列入大型专业店的回归分析中。上文将租金因素列入总体大型零售商业设施的回归分析中,也仅用其来表示广州市各镇街商铺租金水平分布的大致情况。2)*、**、***分别代表在10%、5%、1%的水平上显著。 |
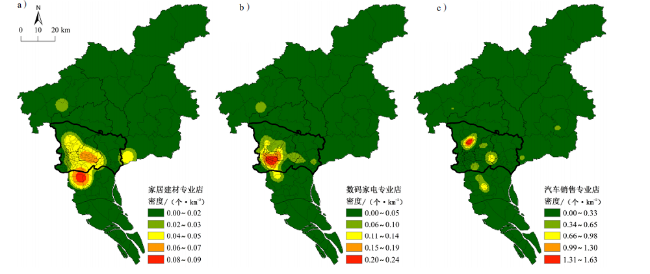
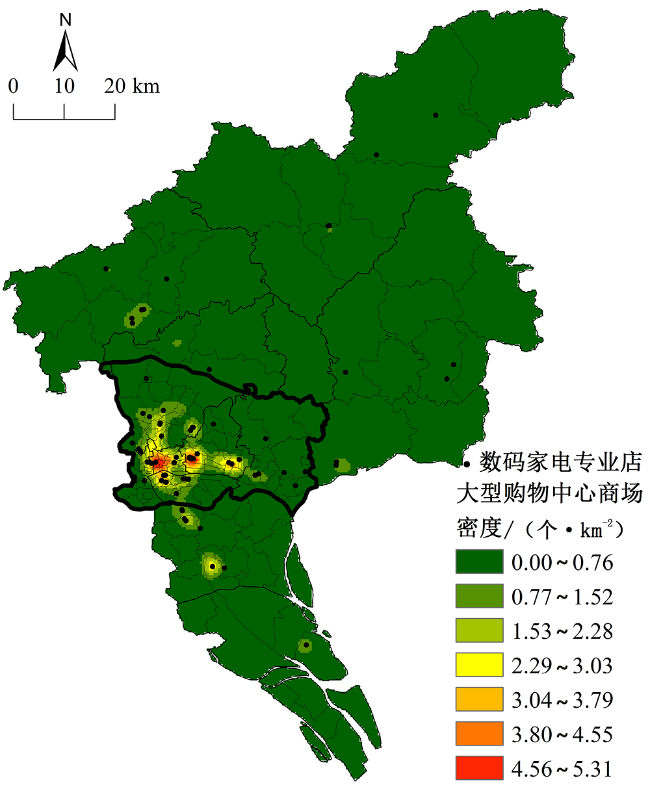
图9 大型数码家电专业店与大型购物中心的分布关系Fig.9 Distribution relationship between large-scale home appliance stores and shopping centers |
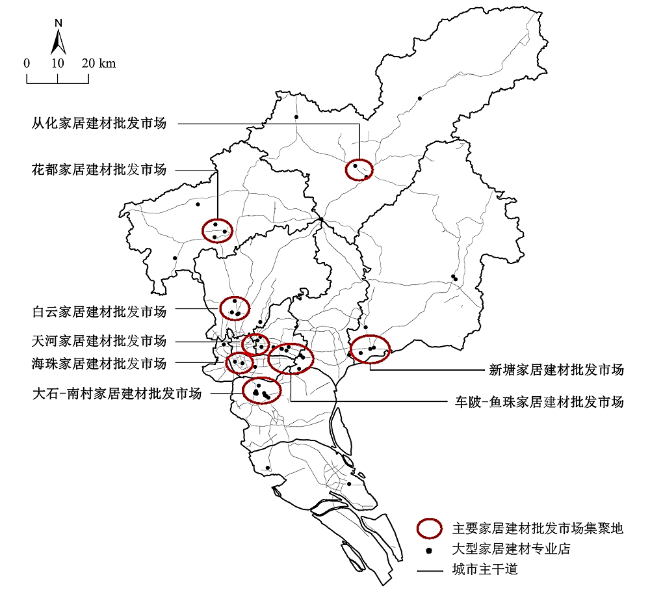
图10 大型家居建材专业店与家居建材专业市场集聚地的分布关系资料来源:百度地图POI数据以及《华南地区家具业发展趋势》(刘娜,2005)。 Fig.10 Distribution relationship between large-scale furniture stores and furniture specialized markets |
特别感谢中山大学地理科学与规划学院符天蓝博士后对本文所提出的意见和帮助!
| [1] |
|
| [2] |
|
| [3] |
|
| [4] |
[
|
| [5] |
|
| [6] |
|
| [7] |
柴彦威, 翁桂兰, 沈洁 . 2008. 基于居民购物消费行为的上海城市商业空间结构研究. 地理研究, 17(4):897-906.
[
|
| [8] |
陈蔚珊, 柳林, 梁育填 . 2016. 基于POI数据的广州零售商业中心热点识别与业态集聚特征分析. 地理研究, 35(4):703-716.
[
|
| [9] |
|
| [10] |
|
| [11] |
广州市统计局. 2019. 2018广州市统计年鉴. 北京:中国统计出版社.
[ Guangzhou Municipal Bureau of Statistics. 2019. 2018 Guangzhou Statistical Yearbook. Beijing: China Statistics Press. ]
|
| [12] |
|
| [13] |
|
| [14] |
|
| [15] |
胡庆武, 王明, 李清泉 . 2014. 利用位置签到数据探索城市热点与商圈. 测绘学报, 43(3):314-321.
[
|
| [16] |
|
| [17] |
林耿, 阎小培 . 2003. 广州市商业功能区空间结构研究. 人文地理, 18(3):37-41.
[
|
| [18] |
刘娜 . 2005. 华南地区家具业发展趋势. 长沙:中南林业科技大学.
[
|
| [19] |
马晓龙 . 2007. 西安市大型零售商业空间结构与市场格局研究. 城市规划, 31(2):55-61.
[
|
| [20] |
毛蒋兴, 闫小培 . 2004. 城市交通干道对土地利用的廊道效应研究——以广州大道为例. 地理与地理信息科学, 20(5):58-61.
[
|
| [21] |
|
| [22] |
宁越敏, 黄胜利 . 2005. 上海市区商业中心的等级体系及其变迁特征. 地域研究与开发, 24(2):15-19.
[
|
| [23] |
饶传坤, 蔡异翔 . 2016. 杭州市大型零售商业设施的空间扩展特征. 经济地理, 36(2):117-124.
[
|
| [24] |
|
| [25] |
王法辉 . 2009. 基于GIS的数量方法与应用.姜世国,滕骏华. 译. 北京:商务印书馆.
[
|
| [26] |
王慧, 黄玖菊, 李永玲, 阎欣, 许旺土 . 2013. 厦门城市空间出行便利性及小汽车依赖度分析. 地理学报, 68(4):477-490.
[
|
| [27] |
王珏晗, 周春山 . 2018. 广州市商业型健身房空间分布及其影响因素. 热带地理, 38(1):120-130.
[
|
| [28] |
王祥利 . 2011. 长沙市商业网点布局研究. 长沙:湖南大学.
[
|
| [29] |
许学强, 周素红, 林耿 . 2002. 广州市大型零售商店布局分析. 城市规划, 26(7):23-28.
[
|
| [30] |
杨林川, 张衔春, 洪世键, 林浩韬, 成庚 . 2016. 公共服务设施步行可达性对住宅价格的影响——基于累积机会的可达性度量方法. 南方经济, 34(1):57– 70.
[
|
| [31] |
杨吾扬 . 1994. 北京市零售商业与服务业中心和网点的过去、现在和未来. 地理学报, 49(1):9-17.
[
|
| [32] |
张小英, 巫细波 . 2016. 广州购物中心时空演变及对城市商业空间结构的影响研究. 地理科学, 36(2):231-238.
[
|
| [33] |
张燕 . 2010. 广州汽车产业集群发展的实证研究. 广州:暨南大学.
[
|
| [34] |
周素红, 郝新华, 柳林 . 2014. 多中心化下的城市商业中心空间吸引衰减率验证:深圳市浮动车GPS时空数据挖掘. 地理学报, 69(12):1810-1820.
[
|
| [35] |
周素红, 林耿, 闫小培 . 2008. 广州市消费者行为与商业业态空间及居住空间分析. 地理学报, 63(4):395-404.
[
|
| [36] |
朱枫, 宋小冬 . 2003. 基于GIS的大型百货零售商业设施布局分析——以浦东新区为例. 武汉大学学报(工学版), 36(3):46-52.
[
|
/
| 〈 |
|
〉 |