
The Residential Differentiation of Residents’ Overweight: A Case Study of Guangzhou
Received date: 2019-07-01
Revised date: 2020-01-16
Online published: 2020-06-30
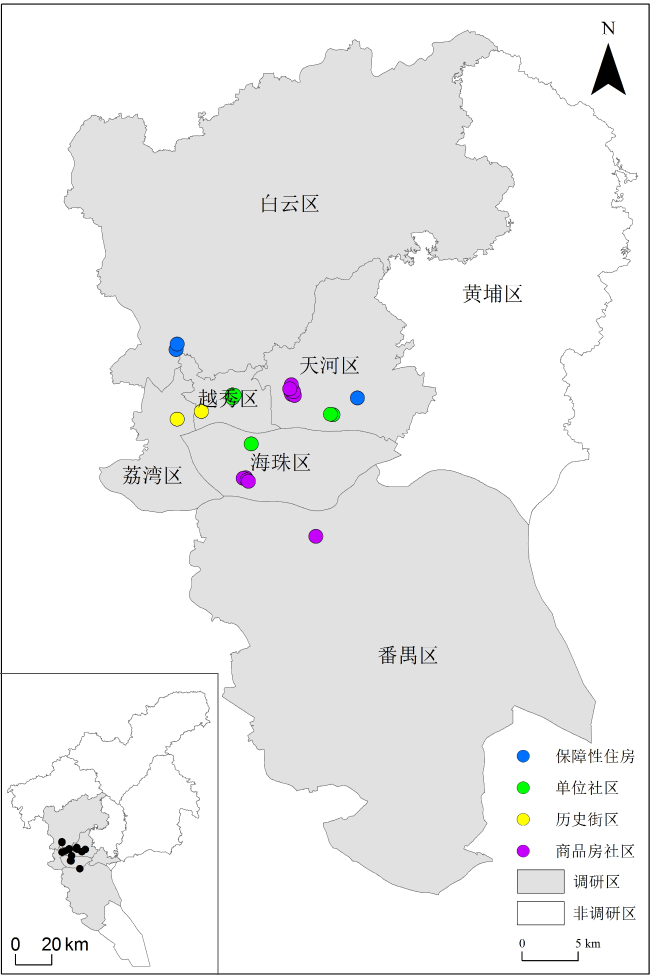
The rapid increase in the overweight rate among Chinese residents is accompanied by a complex overweight differentiation characteristic. However, little is known about the causes of the differentiation at a community level. Thirty years of housing system reform has led to China's housing pattern evolving into a variety of types. It will be of theoretical and practical value to study the mechanism of the influence of residential type on the rate of residents’ overweight under the specific policy and social background of China. Based on 962 questionnaires from 25 typical communities in Guangzhou (categorized into four residential types), we used chi-square analysis and a binary logistic regression model to analyze the residents’ overweight differentiation characteristic and its mechanism on a community level. The results showed that the overweight rate of residents and its differentiation characteristic varied between residential types. Demographic features and community environment were the core variables that explain the above-mentioned differentiation by residential type. 1) The incidence of overweight in the order of highest to lowest was as follows: historical district, indemnificatory housing, unit community, and commercial housing community. Commercial housing communities attract young people with high education, high income, a generally better health awareness and community resources availability leading to the lowest overweight rate. Due to long-term housing isolation, poor marketability and earlier construction, unit communities and historical districts drew residents with low education and income, in addition to which historical districts had a large proportion of the elderly. Consequently, both residential types had a higher overweight rate. Indemnificatory housing tended to support low-income groups, and usually had a poor community environment so although residents had a higher education level, there was less opportunity to use physical activity resources, therefore this residential type had a higher overweight rate. 2) Age and marital status were important influencing factors of overweight for all residential types which indicates that this is of concern for both the elderly and married population. With regard to other aspects of demographic and socioeconomic attributes, as well as leisure-time physical activity levels, overweight differentiation among the residential types had varied characteristics and mechanisms. An increase in income provided individuals with more access to social resources including physical activity facilities and food facilities, resulting in an overweight differentiation for both indemnificatory housing and unit communities. Moreover, in respect of indemnificatory housing, non-agricultural residents from other cities had higher income levels than other hukou types, so they tended toward higher physical activity and diet resource acquisition ability or a higher intensity physical activity (physical work) which reduced the overweight level. Education levels affected the leisure-time physical activities and other health behaviors of people in historical districts, leading to an overweight differentiation. Commercial housing communities consisted of higher income residents whose unhealthy work practices contributed to an overweight differentiation at the community level. This study revealed the characteristics and mechanism of overweight differentiation in Chinese residential patterns and proposes a number of community optimization measures to alleviate overweight, which may help improve the health of residents living in these communities and promote the implementation of the “healthy China” strategy. Further research might be needed to establish the mechanism of overweight differentiation in terms of gender and leisure-time physical activity.
Zhanqiang Zhu , Xiaofang Tao , Suhong Zhou . The Residential Differentiation of Residents’ Overweight: A Case Study of Guangzhou[J]. Tropical Geography, 2020 , 40(3) : 487 -497 . DOI: 10.13284/j.cnki.rddl.003222
表1 变量选取及其说明Table 1 Variable selection and its description |
| 变量类型 | 变量名称 | 变量赋值 | 说明 | |
|---|---|---|---|---|
| 因变量 | 超重 | 0=不超重;1=超重 | BMI≥24 kg/m2为超重,BMI=体重(kg)/身高(m)2 | |
| 自 变 量 | 人口与 社会 经济 属性 | 性别 | 0=女性;1=男性 | — |
| 年龄/岁 | 实际年龄 | 2016年(调研时间)的实际年龄 | ||
| 婚姻状况 | 0=未婚;1=已婚 | 已婚包括已婚、离异或丧偶(离异或丧偶人数极少, 故在回归分析归入已婚) | ||
| 户口 | 0=本市非农户口;1=本市农业户口;2=外地非农户口;3=外地农业户口 | — | ||
| 受教育水平 | 0=低等学历; 1=中等学历; 2=高等学历 | 低等学历:未受教育、小学、初中; 中等学历:高中、中专/中技/职高; 高等学历:大专、大学、研究生以上 | ||
| 收入水平/(元·月-1) | 0=中下收入; 1=中等收入; 2=中上收入; 3=高收入 | 采用家庭人均月收入(家庭月收入/人口数)衡量收入水平。根据广州小康线及国家统计局的划分标准,划分如下,中下收入:≤2 500元/月;中等收入:2 500~3 600元/月;中上收入:3 600~5 000元/月;高收入:≥5 000元/月。 | ||
| 体力 活动 水平 | 健身频率 | 0=不固定,偶尔去;1=小于每周3次; 2=每周3~6次;3=每天一次及以上 | 受访者一天或一周进行任意锻炼的次数 | |
| 健身强度(健身时间)/min | — | — | ||
| 一周重体力健身时间 | 平均每天重体力健身时间× 一周健身天数 | 进行有氧健身、跑步、快速骑车、游泳及足球篮球类活动等,且持续时间超过10 min | ||
| 一周中度体力健身时间 | 平均每天中度体力健身时间× 一周健身天数 | 进行快速行走、跳交谊舞、打保龄球、乒乓球、羽毛球活动等,且持续时间超过10 min | ||
| 一周散步健身时间 | 平均每天散步健身时间× 一周健身天数 | 以休息游憩为目的的散步,且持续时间超过10 min | ||
| 控 制 变 量 | 商品房 社区 环境 | 房价/(元·m-2) | 社区房价 | 通过检索安居客、链家网站,获取2016年各社区的平均房价 |
| 绿化率/% | 社区内及1 km缓冲区绿地面积/ (社区+缓冲区面积) | 通过对2016年的卫星遥感影像进行目视解译,获取包括小区内和小区1 km缓冲半径内的街道绿地、公园绿地等所有开放可达绿地面积,同时获取小区和缓冲区面积之和,计算绿化率 | ||
| 健身场所数量/个 | 小区及小区周边1 km缓冲区 健身场所数量 | 采用百度的“道道通”兴趣点(POI)数据产品获得商品房社区1km缓冲区内的健身场所数量。包括羽毛球场、网球场、篮球场、乒乓球场、健身房、会所、游泳场及其他健身设施个数 | ||
表2 被调查者人口及社会经济属性Table 2 Demographic and socioeconomic attributes of respondents |
| 人口属性 | 保障性住房 | 单位社区 | 历史街区 | 商品房社区 | 总体水平 | 广州平均水平 | 广州平均水平备注 | |
|---|---|---|---|---|---|---|---|---|
| 样本数量/人 | 246 | 247 | 166 | 303 | 962 | — | — | |
| 性别 | 男性/% | 51.22 | 48.99 | 50.60 | 50.17 | 50.21 | 51.24 | 全年龄 |
| 女性/% | 48.78 | 51.01 | 49.40 | 49.83 | 49.79 | 48.76 | ||
| 平均年龄/岁 | 38.59 | 42.23 | 43.48 | 40.01 | 40.81 | — | — | |
| 婚姻 状况 | 未婚/% | 20.73 | 24.70 | 20.48 | 21.78 | 22.03 | 25.35 | 15岁 以上 |
| 已婚/% | 79.27 | 74.49 | 78.92 | 77.89 | 77.55 | 72.50 | ||
| 离异或丧偶/% | 0 | 0.81 | 0.60 | 0.33 | 0.42 | 2.15 | ||
| 户口 | 本市非农/% | 76.83 | 65.18 | 84.34 | 76.24 | 74.95 | 2016年末广州常住人口1 404.35万人, 户籍人口870.49万人。 | |
| 本市农业/% | 0.41 | 6.88 | 1.21 | 3.30 | 3.12 | |||
| 外地非农/% | 10.57 | 16.19 | 8.43 | 14.52 | 12.89 | |||
| 外地农业/% | 12.20 | 11.74 | 6.02 | 5.94 | 9.04 | |||
| 受教育 水平 | 低等学历/% | 10.98 | 19.84 | 20.48 | 7.59 | 13.83 | 50.63 | 6岁以上 |
| 中等学历/% | 35.77 | 40.89 | 42.77 | 33.99 | 37.73 | 25.71 | ||
| 高等学历/% | 53.25 | 39.27 | 36.75 | 58.42 | 48.44 | 23.66 | ||
| 收入 水平 | 中下收入/% | 39.84 | 34.25 | 28.31 | 12.21 | 27.03 | 城市居民:4 245.08元/月 农村居民:1 787.42元/月 | |
| 中等收入/% | 6.50 | 7.73 | 3.01 | 2.97 | 5.61 | |||
| 中上收入/% | 42.28 | 31.49 | 39.16 | 25.08 | 32.95 | |||
| 高收入/% | 11.38 | 26.52 | 29.52 | 59.74 | 34.41 | |||
|
表3 被调查者超重比率Table 3 Overweight rate of respondents |
| 居住类型 | 样本数量/人 | 超重率/% |
|---|---|---|
| 总体 | 962 | 29.83 |
| 保障性住房 | 246 | 35.77 |
| 单位社区 | 247 | 30.36 |
| 历史街区 | 166 | 40.36 |
| 商品房社区 | 303 | 18.81 |
表4 被调查者健身水平Table 4 Leisure-time physical activity level of respondents |
| 健身水平 | 保障性住房 | 单位社区 | 历史街区 | 商品房社区 | 总体水平 | |
|---|---|---|---|---|---|---|
| 健身频率/% | ≥1次/d | 14.23 | 10.93 | 7.83 | 10.56 | 11.12 |
| 3~6次/周 | 7.32 | 29.15 | 22.29 | 13.86 | 17.57 | |
| <3次/周 | 0.81 | 8.91 | 27.11 | 16.50 | 12.37 | |
| 不固定,偶尔去 | 77.64 | 51.01 | 42.77 | 59.08 | 58.94 | |
| 健身强度/min | 一周重体力健身时间 | 11.90 | 45.43 | 32.47 | 44.90 | 34.45 |
| 一周中度体力健身时间 | 39.31 | 31.64 | 12.98 | 44.23 | 34.35 | |
| 一周散步健身时间 | 85.05 | 71.28 | 83.28 | 74.11 | 77.76 | |
表5 二元逻辑回归结果Table 5 Binary logistic regression results |
| 自变量(参考变量) | 模型1 总样本 | 模型2 保障性住房 | 模型3 单位社区 | 模型4 历史街区 | 模型5 商品房社区 | ||||||
|---|---|---|---|---|---|---|---|---|---|---|---|
| B | S.E. | B | S.E. | B | S.E. | B | S.E. | B | S.E. | ||
| 性别(女性) | 男性 | 0.36* | 0.16 | 1.20*** | 0.33 | 0.21 | 0.39 | -0.22 | 0.37 | -0.13 | 0.43 |
| 年龄 | 0.03** | 0.01 | 0.05* | 0.02 | 0.10*** | 0.02 | 0.02 | 0.03 | 0.04 | 0.03 | |
| 婚姻状况 (未婚) | 已婚 | 0.67** | 0.25 | 0.03 | 0.55 | 0.70 | 0.73 | 0.30 | 0.57 | 2.65* | 1.10 |
| 户口 (本市非农) | 本市农业 | -0.34 | 0.47 | — | 0.76 | 0.73 | -0.82 | 1.57 | -1.54 | 1.19 | |
| 外地非农 | -0.43+ | 0.24 | -1.02+ | 0.60 | -0.48 | 0.49 | 0.40 | 0.65 | -0.03 | 0.55 | |
| 外地农业 | -0.02 | 0.28 | -0.37 | 0.63 | -0.24 | 0.58 | 0.64 | 0.83 | 0.15 | 0.74 | |
| 受教育水平 (低等学历) | 中等学历 | -0.66** | 0.25 | -0.78 | 0.67 | -0.45 | 0.52 | -2.04** | 0.71 | -0.16 | 0.75 |
| 高等学历 | -0.63* | 0.30 | -0.49 | 0.79 | 0.63 | 0.63 | -2.21* | 0.86 | -1.04 | 0.90 | |
| 收入水平 (中下收入) | 中等收入 | -0.13 | 0.34 | -0.92 | 0.70 | 1.40 | 0.67 | 0.29 | 1.06 | 1.16 | 1.24 |
| 中上收入 | -0.28 | 0.19 | -0.12 | 0.35 | -0.99* | 0.50 | 0.47 | 0.44 | 1.56+ | 0.79 | |
| 高收入 | -0.78*** | 0.21 | -1.97** | 0.84 | -1.12** | 0.51 | -0.27 | 0.50 | 1.41* | 0.80 | |
| 健身频率 (不固定偶尔去) | ≥1次/d | 0.05 | 0.29 | -1.22+ | 0.70 | -0.34 | 0.65 | 1.01 | 0.91 | 1.37+ | 0.84 |
| 3~6次/周 | 0.41* | 0.21 | 0.32 | 0.60 | -0.14 | 0.48 | 1.02* | 0.51 | 1.65** | 0.71 | |
| <3次/周 | 0.06 | 0.25 | — | -0.85 | 0.75 | 0.88+ | 0.47 | 1.33** | 0.63 | ||
| 健身强度 | 一周重体力健身时间 | 0.02 | 0.09 | 0.20 | 0.51 | -0.24 | 0.25 | 0.02 | 0.16 | -0.70 | 0.31 |
| 一周中度体力健身时间 | -0.05 | 0.08 | -0.41 | 0.22 | 0.32+ | 0.19 | -0.05 | 0.20 | -0.19 | 0.24 | |
| 一周散步健身时间 | -0.15 | 0.09 | -0.02 | 0.25 | -0.18 | 0.20 | -0.31 | 0.24 | -0.06* | 0.22 | |
| 社区环境控制变量 | 房价/元/m2 | -0.15 | 0.49 | ||||||||
| 绿化率/% | 0.78* | 0.88 | |||||||||
| 健身场所数量/个 | 0.71+ | 1.01 | |||||||||
| 常量 | -1.92*** | 0.50 | -1.90 | 1.49 | -8.13*** | 2.12 | 1.33 | 1.42 | -6.87** | 1.98 | |
| R 2 | 16.60%*** | 24.10%*** | 40.00%*** | 20.40%*** | 35.30%*** | ||||||
|
表6 不同居住类型居民的超重特征(变量达到显著或极显著)Table 6 Overweight characteristics in different residential types (significant or extremely significant variables only) |
| 居住类型 | 性别 | 年龄 | 婚姻状况 | 户口 | 受教育水平 | 收入水平 | 健身水平 |
|---|---|---|---|---|---|---|---|
| 总样本 | 男性超重概率高于女性 | 随年龄增加超 重概率提高 | 已婚超重概 率高于未婚 | 本市非农超重概 率高于外地非农 | 低等学历超重概 率高于中高学历 | 中下收入超重概率 高于高收入 | 每周3~6次的超重概率高于不规律健身 |
| 保障性 住房 | 男性超重概率高于女性 | 随年龄增加超 重概率提高 | — | 本市非农超重概 率高于外地非农 | — | 中下收入超重概率 高于高收入 | 不规律健身超重概率高于每天一次及以上 |
| 单位 社区 | — | 随年龄增加超 重概率提高 | — | — | — | 中下收入超重概率 高于中高收入 | 中度体力健身不会降低超重概率 |
| 历史 街区 | — | — | — | — | 低等学历超重概 率高于中高学历 | — | 每周6次以内的规律健身超重概率高于不规律健身 |
| 商品房 社区 | — | — | 已婚超重概 率高于未婚 | — | — | 中上和高收入超重 概率高于中下收入 | 所有类型的规律健身概率均高于不规律健身; 散步健身可降低超重概率 |
|
Black J L, Macinko J, Dixon L B and Fryer J G E. 2010. Neighborhoods and Obesity in New York City. Health & Place, 16(3): 489-499.
|
|
Boardman J D, Onge J M S, Rogers R G and Denney J T. 2005. Race Differentials in Obesity: The Impact of Place. Journal of Health and Social Behavior, 46(3): 229-243.
|
|
柴彦威,塔娜,毛子丹.2011.单位视角下的中国城市空间重构.现代城市研究,26(3):5-9. [Chai Yanwei, Ta Na and Mao Zidan. 2011. Urban Spatial Reconstruction in Cities in China: From the Perspective of Danwei. Modern Urban Research, 26(3): 5-9. ]
|
|
陈蜒,张志斌.2015.兰州市商品住房价格空间分布格局及其影响因素.干旱区资源与环境,29(12):44-50. [Chen Yan and Zhang Zhibin. 2015. The Spatial Distribution Patterns and Influential Factors of Commodity Housing Prices in Lanzhou City. Journal of Arid Land Resources and Environment, 29(12): 44-50. ]
|
|
Cleland V, Ball K, Hume C, Timperio A, King A C and Crawford D. 2010. Individual, Social and Environmental Correlates of Physical Activity among Women Living in Socioeconomically Disadvantaged Neighbourhoods. Social Science & Medicine, 70(12): 2011-2018.
|
|
Coombes E, Jones A P and Hillsdon M. 2010. The Relationship of Physical Activity and Overweight to Objectively Measured Green Space Accessibility and Use. Social Science & Medicine, 70(6): 816.
|
|
戴其文,姚意旗,张晓奇,韦海宁.2019.环境对城市房价影响研究述评与展望.资源科学,41(4):627-642. [Dai Qiwen, Yao Yiqi, Zhang Xiaoqi and Wei Haining. 2019. Review and Prospect of Research on the Influence of the Environment on Spatial Disparity of Urban Housing Prices. Resources Science, 41(4): 627-642. ]
|
|
Deeg D J H and Thomése G C F. 2005. Discrepancies between Personal Income and Neighbourhood Status: Effects on Physical and Mental Health. European Journal of Ageing, 2(2): 98-108.
|
|
Ekkel E D and De Vries S. 2017. Nearby Green Space and Human Health: Evaluating Accessibility Metrics. Landscape and Urban Planning, 157: 214-220.
|
|
广东省体育局.2017.2016年广东省国民体质监测公报.(2017-12-07)[2019-12-20].http://www.tyj.gd.gov.cn/4294332/5323 796.html.[Guangdong Provincial Sports Bureau. 2017. Bulletin on National Physical Fitness Monitoring of Guangdong Province, 2016. (2017-12-07) [2019-12-20]. http://www.tyj.gd.gov.cn/4294332/5323796.html. ]
|
|
国家卫生计生委.2015.中国居民营养与健康状况调查报告(2015).(2015-06-30)[2019-06-30].http://www.nhc.gov.cn/jkj/s5879/201506/4505528e65f3460fb88685081ff158a2.shtml. [National Health and Family Planning Commission. 2015. Nutrition and Health Status Survey Report of Chinese Residents2015). (2015-06-30) [2019-06-30]. http://www.nhc.gov.cn/jkj/s5879/201506/4505528e65f3460fb88685081ff158a2.shtml. ]
|
|
Gordon-Larsen P. 2006. Inequality in the Built Environment Underlies Key Health Disparities in Physical Activity and Obesity. Pediatrics, 117(2): 417-424.
|
|
顾朝林. 2002.城市社会学.南京:东南大学出版社.[Gu Chaolin. 2002. Urban Sociology. Nanjing: Southeast University Press. ]
|
|
Haan M, Kaplan G A and Camacho T. 1987. Poverty and Health: Prospective Evidence from the Alameda. American Journal of Epidemiology, 125(6): 989-998.
|
|
胡祥炬,林曙光,钟文玲,林修全.2013.福建省5个国家疾病监测点成人超重肥胖的影响因素分析.中华疾病控制杂志,17(1):20-23.[Hu Xiangju, Lin Shuguang, Zhong Wenling and Lin Xiuquan. 2013. Influential Factors Research on Overweight and Obesity at 5 DSP Points in Fujian Province. Chinese Journal of Disease Control & Prevention, 17(1): 20-23. ]
|
|
IPAQ Group . 2002. International Physical Activity Questionnaire. (2019-06-22) [2020-03-01]. http://www.sdp.univ.fvg.it/sites/default/files/IPAQ_English_self-admin_long.pdf.
|
|
Jeffery R W and Utter J. 2003. The Changing Environment and Population Obesity in the United States. Obesity Research, 11(10S): 12S-22S.
|
|
李方波,李英华,孙思伟,聂雪琼,卢永,黎慕,程玉兰.2012.我国5省市18~60岁城乡居民超重肥胖现状调查及影响因素分析.中国健康教育,28(5):367-371.[Li Fangbo, Li Yinghua, Sun Siwei, Nie Xueqiong, Lu Yong, Li Mu and Cheng Yulan. 2012. Study on the Prevalance Status of Body Overweight and Obesity and their Influencing Factors among the Urban and Rural Adult Citizens Aged 18 to 60 in 5 Provinces in China. Chinese Journal of Health Education, 28(5): 367-371. ]
|
|
李国庆.2007.社区类型与邻里关系特质——以北京为例.江苏行政学院学报,(2):59-65.[Li Guoqing. 2007. Types of Community and Relationship of Neighbors—Taking Beijing as an Example. Journal of Jiangsu Administration Institute, (2): 59-65. ]
|
|
李媛,靳雅男,田园,张银娥,杨艺,赵建华.2019.宁夏地区成年居民超重、肥胖、中心性肥胖流行现状及影响因素.中国公共卫生,35(10):1360-1362.[Li Yuan, Jin Yanan, Tian Yuan, Zhang Yin'e, Yang Yi and Zhao Jianhua. 2019. Prevalence and Influencing Factors of Overweight, Obesity and Central Obesity among Adult Residents in Ningxia Hui Autonomous Region. Chinese Journal of Public Health, 35(10): 1360-1362. ]
|
|
Lopez R P. 2007. Neighborhood Risk Factors for Obesity. Obesity, 15(8): 2111-2119.
|
|
鲁斐栋,谭少华.2015.建成环境对体力活动的影响研究:进展与思考.国际城市规划,30(2):62-70.[Lu Feidong and Tan Shaohua. 2015. Built Environmentʼs Influence on Physical Activity: Review and Thought. Urban Planning International, 30(2): 62-70. ]
|
|
Lu Y, Sarkar C and Xiao Y. 2018. The Effect of Street-Level Greenery on Walking Behavior: Evidence from Hong Kong. Social Science & Medicine, 208: 41-49.
|
|
马立芳,郭红卫,何霭娜,付珩,徐洁,周建军.2007.成人超重和肥胖的危害及影响因素分析.环境与职业医学,24(4):375-378.[Ma Lifang, Guo Hongwei, He Aina, Fu Heng, Xu Jie and Zhou Jianjun. 2007. Analysis of the Hazards and Correlative Factors of Overweight and Obesity in Community Adults. Journal of Environmental and Occupational Medicine, 24(4): 375-378. ]
|
|
马文君,许燕君,李剑森,徐浩锋,聂少萍,陈泽池,邓惠鸿,李海康.2004.广东省2002年成人超重、肥胖流行病学特征分析.中华流行病学杂志,25(12):33-36.[Ma Wenjun, Xu Yanjun, Li Jiansen, Xu Haofeng, Nie Shaoping, Chen Zechi, Deng Huihong and Li Haikang. 2004. Study on the Epidemiological Characteristics of Overweight and Obesity among Population Aged Eighteen and Over in Guangzhou Province in 2002. Chinese Journal of Epidemiology, 25(12): 33-36. ]
|
|
倪国华,张璟,郑风田.2013.中国肥胖流行的现状与趋势.中国食物与营养,19(10):70-74.[Ni Guohua, Zhang Jing and Zheng Fengtian. 2013. Status and Trends of Chinese Obesity Epidemic. Food and Nutrition in China, 19(10): 70-74. ]
|
|
Proper K I, Cerin E, Brown W J and Owen N. 2007. Sitting Time and Socio-Economic Differences in Overweight and Obesity. International Journal of Obesity, 31(1): 169-176.
|
|
邱淑敏,王欢,江崇民.2013.运动健身能量消耗简易测量方法的效度研究.体育科学,33(6):69-76.[Qiu Shumin, Wang Huan and Jiang Chongmin. 2013. Validity of the SWA Sensor to Predict Energy Expenditure of Sports and Fitness. China Sport Science, 33(6): 69-76. ]
|
|
Roberto C A, Swinburn B, Hawkes C, Huang T T, Costa S A, Ashe M, Zwicker L, Cawley J H and Brownell K D. 2015. Patchy Progress on Obesity Prevention: Emerging Examples, Entrenched Barriers, and New Thinking. The Lancet, 385(9985): 2400-2409.
|
|
单凤霞,郭修金.2019.生态文明:城市休闲体育发展的必然选择.体育学研究,2(1):60-68.[Shan Fengxia and Guo Xiujin. 2019. Ecological Civilization: An Inevitable Choice for the Development of City Leisure Sports. Journal of Sports Research, 2(1): 60-68. ]
|
|
Shores K A and West S T. 2008. The Relationship Between Built Park Environments and Physical Activity in Four Park Locations. Journal of Public Health Management and Practice, 14(3): e9-e16.
|
|
Singh D K and Tuli L. 2010. Obesity and Its Mechanisms‒Who to Blame after Marriage? Medical Hypotheses, 75(5): 472-473.
|
|
Smith D M and Cummins S. 2009. Obese Cities: How Our Environment Shapes Overweight. Geography Compass, 3(1): 518-535.
|
|
Sun B, Yan H and Zhang T. 2017. Built Environmental Impacts on Individual Mode Choice and BMI: Evidence from China. Journal of Transport Geography, 63: 11-21.
|
|
孙峰华,王兴中.2002.中国城市生活空间及社区可持续发展研究现状与趋势.地理科学进展,(5):491-499. [Sun Fenghua and Wang Xingzhong. 2002. The Status Quo and Trends of the Study on City Life-Space and Community Sustainable Development in China. Progress in Geography, (5): 491-499. ]
|
|
王凯珍.2005.中国城市不同类型社区居民体育活动现状的调查研究.北京体育大学学报,28(8):1009-1013. [Wang Kaizhen. 2005. Investigation Research on the Current Situation of Physical Activities among Residents in Varieties of Community of Cities in China. Journal of Beijing Sport University, 28(8): 1009-1013. ]
|
|
卫生部.2010.营养改善工作管理办法.(2010-07-16)[2019-12-25].http://www.chc.org.cn/news/detail.php?id=61116. [Ministry of Health. 2010. Chinese Center for Disease Control and Prevention Measures for the Management of Nutrition Improvement Work. (2010-07-16) [2019-12-25]. http://www.chc.org.cn/news/detail.php?id=61116. ]
|
|
Wu J, He Q, Chen Y, Lin J and Wang S. 2018. Dismantling the Fence for Social Justice? Evidence Based on the Inequity of Urban Green Space Accessibility in The Central Urban Area of Beijing. Environment and Planning B: Urban Analytics and City Science, 1-19. DOI: 10.1177/2399808318793139.
|
|
吴启焰,吴小慧,Chen Guo,Daniel Hammel J,刘咏梅,刘丹.2013.基于小尺度五普数据的南京旧城区社会空间分异研究.地理科学,33(10):1196-1205. [Wu Qiyan, Wu Xiaohui, Chen Guo, Daniel Hammel J, Liu Yongmei and Liu Dan. 2013. Social-Spatial Differentiation and Residential Segregation of Old City of Nanjing, China: Evidence from the Community-Level Census Data in 2000. Scientia Geographica Sinica, 33(10): 1196-1205. ]
|
|
武阳丰,马冠生,胡永华,李艳平,李贤,崔朝辉,陈春明,孔灵芝.2005.中国居民的超重和肥胖流行现状.中华预防医学杂志,(5):22-26. [Wu Yangsheng, Ma Guansheng, Hu Yonghua, Li Yanping, Li Xian, Cui Zhaohui, Chen Chunming and Kong Lingzhi. 2005. The Current Prevalence Status of Body Overweight and Obesity in China Data from the China National Nutrition and Health Survey. Chinese Journal of Preventive Medicine, (5): 22-26. ]
|
|
熊荣,袁丽凤,杨进刚,王杨,伯坚,赵延延,刘力生,李卫.2018.自行车拥有状况与体力活动、静坐时间及超重或肥胖的关系研究.中国循环杂志,33(3):251-255. [Xiong Rong, Yuan Lifeng, Yang Jingang, Wang Yang, Bo Jian, Zhao Yanyan, Liu Lisheng and Li Wei. 2018. Correlation Study Between Bicycle Ownership Status and Physical Activity, Time of Sitting, Overweight or Obesity. Chinese Circulation Journal, 33(3): 251-255. ]
|
|
薛白,逄增昌,鲍国春,高维国,南海荣,汪韶洁,任杰,张磊,乔青.2008.青岛市居民超重与肥胖状况及影响因素分析.中国公共卫生,24(5):585-586. [Xue Bai, Pang Zengchang, Bao Guochun, Gao Weiguo, Nan Hairong , Wang Shaojie, Ren Jie, Zhang Lei and Qiao Qing. 2008. Analysis on Situation and Risk Factors of Overweight and Obesity of Residents in Qingdao City. Chinese Journal of Public Health, 24(5): 585-586. ]
|
|
袁媛.2011.社会空间重构背景下的贫困空间固化研究现代.城市研究,26(3):14-18. [Yuan Yuan. 2011. Research on Stabilization of Spatiality of Urban Poverty against the Background of Social-Spatial Reconstruction. Modern Urban Research, 26(3): 14-18. ]
|
|
张鸿雁.2002.论当代中国城市社区分异与变迁的现状及发展趋势.规划师,(8):5-8. [Zhang Hongyan. 2002. On the Status Quo and the Development Tendency of Community Differentiation and Transformation in Contemporary Chinese Cities. Planners, (8): 5-8. ]
|
|
张艺宏,王梅,孙君志,李宁,裴钰.2016.2014年中国城乡居民超重肥胖流行现状——基于22省(市、区)国家国民体质监测点的形态数据.成都体育学院学报,42(5):93-100. [Zhang Yihong, Wang Mei, Sun Junning, Li Ning and Pei Yu. 2016. Prevalence of Overweight and Obesity among Urban and Rural Residents in 2014. Journal of Chengdu Sport University, 42(5): 93-100. ]
|
|
周春山,陈素素,罗彦.2005.广州市建成区住房空间结构及其成因.地理研究,24(1):77-88. [Zhou Chunshan, Chen Susu and Luo Yan. 2005. The Housing Spatial Structures in Guangzhou Urban Builtup Area and Their Causes Analysis. Geographical Research, 24(1): 77-88. ]
|
|
周长根,洪巧新.2019.健身走和慢跑对超重肥胖男大学生减肥效果评价.中国学校卫生,40(2):213-215. [Zhou Changgen and Hong Qiaoxin. 2019. Effects of Fitness Walking and Jogging on Weight Loss of Overweight and Obese College Students. Chin. J. Sch. Health, 40(2): 213-215. ]
|
/
| 〈 |
|
〉 |