
The Gap between the Well-Being of Urban and Rural Residents in the Yangtze River Economic Belt
Received date: 2020-11-01
Revised date: 2020-12-29
Online published: 2021-04-20
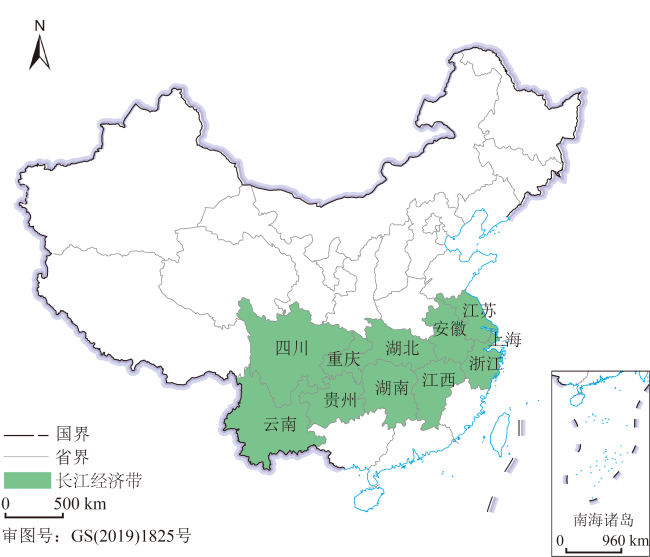
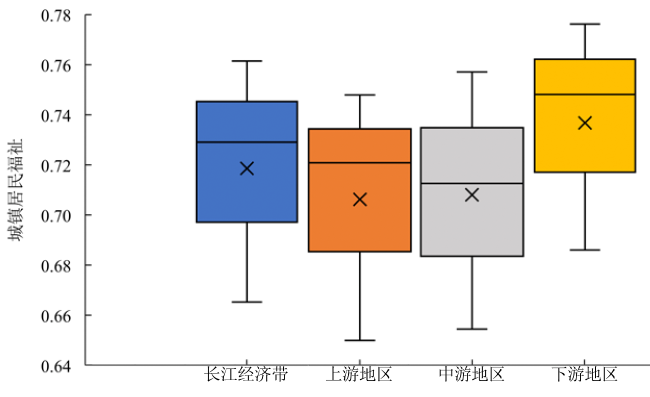
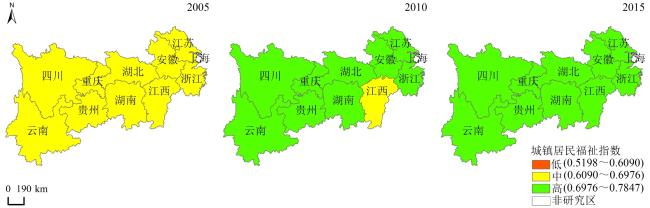
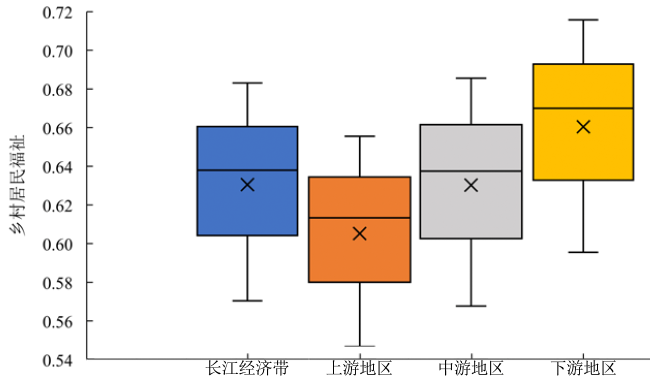
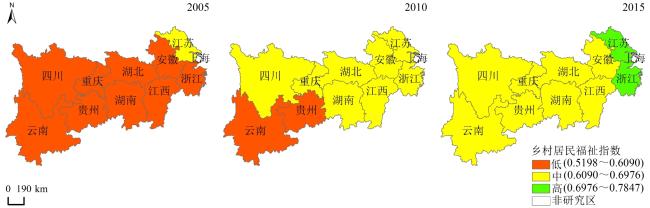
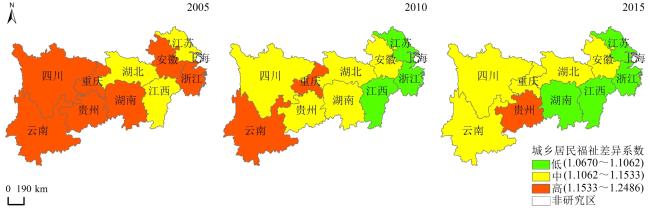
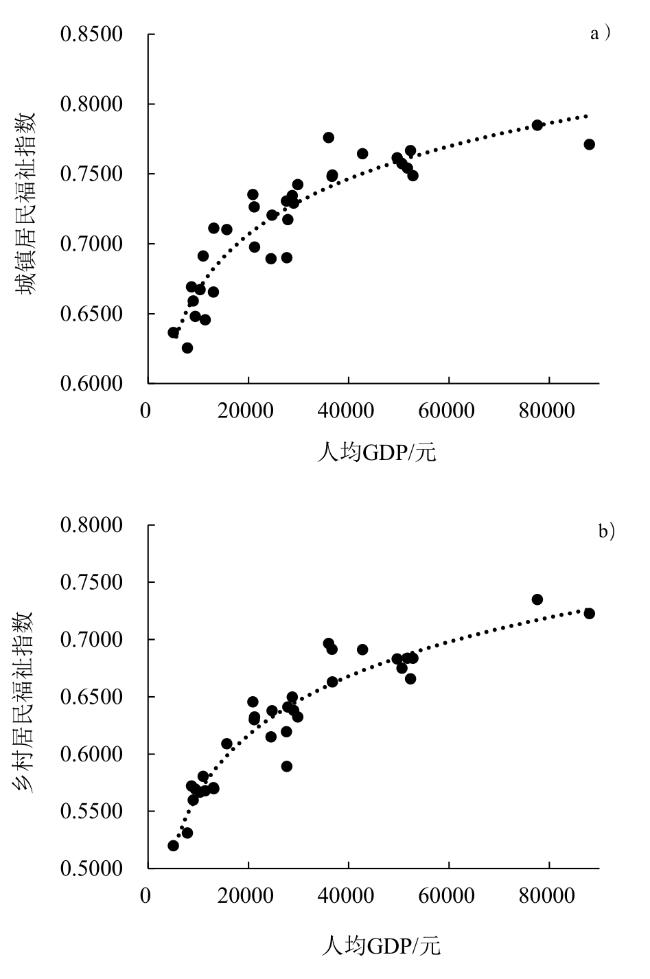
The integrated development of urban and rural areas has become an important development strategy in China in the new era. Its ultimate goal is to jointly improve the well-being of urban and rural residents and reduce the gap in well-being that exists between them. Drawing from the 2019 Human Development Index evaluation framework from a comprehensive subjective and objective perspective, this study constructed an objective development index, a subjective well-being index, and a well-being difference coefficient between urban and rural residents. Taking the Yangtze River Economic Belt as the research area, this study explored the dynamic development process and spatial differentiation characteristics of urban and rural residents' well-being and revealed the influencing factors and mechanisms behind them. It is expected to help understand the process of urban–rural integrated development from the perspective of well-being as well as provide guidance for promoting the integrated development of urban and rural areas in the Yangtze River Economic Belt. The main conclusions reached were as follows: 1) The well-being of urban and rural residents in the Yangtze River Economic Belt gradually increased, from 0.665 3 and 0.570 4 in 2005 to 0.761 5 and 0.683 0, respectively, in 2015. The upper, middle, and lower reaches of this region showed a gradient change from low to high, while the overall spatial difference decreased. 2) The well-being level of urban residents was slightly higher than that of rural residents, and the gap gradually narrowed from 1.166 3 in 2005 to 1.114 8 in 2015. The well-being gap of urban and rural residents in the upper, middle, and lower reaches showed a high to low gradient change; Among them, the gap in the lower reaches has narrowed relatively greatly. 3) The well-being levels of urban and rural residents and the gap between them were greatly affected by economic factors, and the pulling effect of economic growth on the well-being of rural residents was more obvious than that of urban residents, while the spatial distribution of urban and rural residents' well-being was generally positively correlated with the economic pattern. At the same time, it was found that the level of well-being was also related to factors such as urban and rural infrastructure, cultural construction, social management, basic housing security, and ecological environment. Therefore, the well-being level of regions with high economic levels was not necessarily high. 4) The gap in economic, social public services, and security levels between urban and rural areas, as well as the gap in income, health, and social status of urban and rural residents, are the main reasons why this gap between the two types of residents has always existed. The implementation of China's new socialist countryside and beautiful countryside construction, targeted poverty alleviation strategies, urban-rural integration development strategies, and a series of "supporting farmers" and "benefits" policies have effectively promoted the improvement of the well-being of rural residents and narrowed the gap between that of their urban counterparts.
Yanhua He , Cong Liu , Guohua Zhou , Yan Chen . The Gap between the Well-Being of Urban and Rural Residents in the Yangtze River Economic Belt[J]. Tropical Geography, 2021 , 41(2) : 327 -339 . DOI: 10.13284/j.cnki.rddl.003322
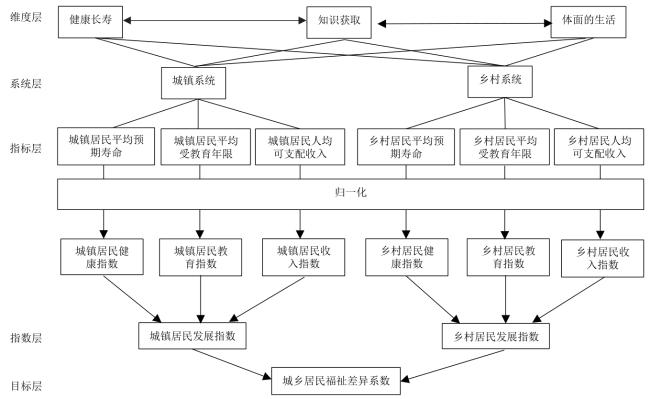
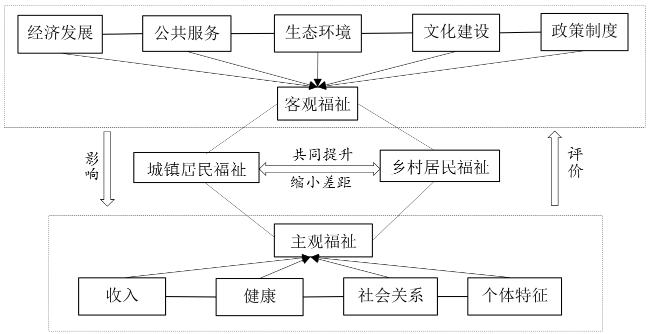
图2 城乡居民客观发展指数建构框架 Fig.2 Framework for calculating the objective development index of urban and rural residents |
表1 平均预期寿命、平均受教育年限及人均可支配收入指标的最大值和最小值Table 1 Maximum and minimum values of average life expectancy, average years of education and per capita disposable income |
| 维度层 | 指标层 | 最小值 | 最大值 |
|---|---|---|---|
| 健康长寿 | 平均预期寿命/岁 | 20 | 85 |
| 知识获取 | 平均受教育年限/a | 0 | 15 |
| 体面的生活 | 人均可支配收入/元 | 352.4 | 264 300 |
表2 2005—2015年各省城镇居民福祉指数Table 2 The well-being index of urban residents in each province during 2005-2015 |
| 地区 | 2005年 | 2005—2010年增减变化 | 2010年 | 2010—2015年增减变化 | 2015年 | 2005—2015年增减变化 |
|---|---|---|---|---|---|---|
| 江苏 | 0.689 3 | 0.059 4 | 0.748 7 | 0.022 4 | 0.771 1 | 0.081 8 |
| 浙江 | 0.689 9 | 0.064 1 | 0.754 0 | 0.030 6 | 0.784 7 | 0.094 8 |
| 安徽 | 0.669 1 | 0.065 9 | 0.735 1 | 0.040 9 | 0.776 0 | 0.106 8 |
| 江西 | 0.648 0 | 0.049 6 | 0.697 6 | 0.050 5 | 0.748 1 | 0.100 1 |
| 湖北 | 0.645 4 | 0.071 8 | 0.717 2 | 0.040 0 | 0.757 1 | 0.111 7 |
| 湖南 | 0.667 1 | 0.053 3 | 0.720 4 | 0.043 9 | 0.764 3 | 0.097 2 |
| 重庆 | 0.691 2 | 0.039 1 | 0.730 4 | 0.036 1 | 0.766 5 | 0.075 2 |
| 四川 | 0.659 0 | 0.067 3 | 0.726 3 | 0.022 8 | 0.749 1 | 0.090 1 |
| 贵州 | 0.636 3 | 0.074 7 | 0.711 0 | 0.031 3 | 0.742 3 | 0.106 0 |
| 云南 | 0.625 4 | 0.084 6 | 0.710 1 | 0.024 3 | 0.734 4 | 0.108 9 |
| 下游 | 0.686 0 | 0.062 2 | 0.748 2 | 0.028 0 | 0.776 2 | 0.090 2 |
| 中游 | 0.654 4 | 0.058 2 | 0.712 6 | 0.044 5 | 0.757 1 | 0.102 7 |
| 上游 | 0.649 9 | 0.070 9 | 0.720 8 | 0.027 1 | 0.748 0 | 0.098 0 |
| 各省标准差 | 0.023 4 | -0.005 8 | 0.017 6 | -0.001 7 | 0.015 9 | -0.007 5 |
| 各省极差 | 0.065 8 | -0.009 4 | 0.056 4 | -0.006 1 | 0.050 3 | -0.015 5 |
| 长江经济带整体水平 | 0.665 3 | 0.063 8 | 0.729 1 | 0.032 4 | 0.761 5 | 0.096 2 |
表3 2005—2015年各省乡村居民福祉指数Table 3 The well-being index of rural residents in each province during 2005-2015 |
| 地区 | 2005年 | 2005-2010年增减变化 | 2010年 | 2010-2015年增减变化 | 2015年 | 2005-2015年增减变化 |
|---|---|---|---|---|---|---|
| 江苏 | 0.614 9 | 0.068 7 | 0.683 6 | 0.039 0 | 0.722 6 | 0.107 7 |
| 浙江 | 0.589 2 | 0.094 4 | 0.683 6 | 0.051 2 | 0.734 7 | 0.145 6 |
| 安徽 | 0.571 8 | 0.073 5 | 0.645 3 | 0.051 1 | 0.696 4 | 0.124 6 |
| 江西 | 0.569 2 | 0.063 1 | 0.632 4 | 0.059 1 | 0.691 4 | 0.122 2 |
| 湖北 | 0.567 6 | 0.073 2 | 0.640 9 | 0.034 0 | 0.674 8 | 0.107 2 |
| 湖南 | 0.566 6 | 0.071 1 | 0.637 7 | 0.053 2 | 0.690 9 | 0.124 3 |
| 重庆 | 0.580 5 | 0.038 8 | 0.619 3 | 0.046 4 | 0.665 7 | 0.085 2 |
| 四川 | 0.559 7 | 0.070 1 | 0.629 8 | 0.032 9 | 0.662 7 | 0.103 0 |
| 贵州 | 0.519 8 | 0.049 7 | 0.569 4 | 0.063 0 | 0.632 4 | 0.112 6 |
| 云南 | 0.531 0 | 0.078 0 | 0.609 0 | 0.040 7 | 0.649 6 | 0.118 7 |
| 下游 | 0.595 5 | 0.074 5 | 0.670 0 | 0.045 7 | 0.715 7 | 0.120 2 |
| 中游 | 0.567 7 | 0.069 9 | 0.637 6 | 0.048 0 | 0.685 6 | 0.117 9 |
| 上游 | 0.546 7 | 0.066 6 | 0.613 3 | 0.042 2 | 0.655 5 | 0.108 8 |
| 各省标准差 | 0.027 0 | 0.006 5 | 0.033 5 | -0.001 9 | 0.031 6 | 0.004 6 |
| 各省极差 | 0.095 1 | 0.019 1 | 0.114 2 | -0.011 9 | 0.102 3 | 0.007 2 |
| 长江经济带整体水平 | 0.570 4 | 0.067 6 | 0.638 0 | 0.045 0 | 0.683 0 | 0.112 6 |
表4 2005—2015年各省城乡居民福祉差异系数(D)Table 4 The coefficient of difference in well-being of urban and rural residentscoefficient in each province during 2005-2015 |
| 地区 | 2005年 | 2005—2010年增减变化 | 2010年 | 2010—2015年增减变化 | 2015年 | 2005—2015年增减变化 |
|---|---|---|---|---|---|---|
| 江苏 | 1.120 9 | -0.025 8 | 1.095 1 | -0.028 1 | 1.067 0 | -0.053 9 |
| 浙江 | 1.171 0 | -0.067 9 | 1.103 1 | -0.035 1 | 1.068 0 | -0.103 0 |
| 安徽 | 1.170 2 | -0.031 1 | 1.139 1 | -0.024 9 | 1.114 2 | -0.056 0 |
| 江西 | 1.138 4 | -0.035 2 | 1.103 2 | -0.021 2 | 1.082 0 | -0.056 4 |
| 湖北 | 1.137 0 | -0.017 9 | 1.119 0 | 0.002 9 | 1.121 9 | -0.015 0 |
| 湖南 | 1.177 4 | -0.047 7 | 1.129 7 | -0.023 5 | 1.106 2 | -0.071 2 |
| 重庆 | 1.190 8 | -0.011 3 | 1.179 4 | -0.028 0 | 1.151 4 | -0.039 4 |
| 四川 | 1.177 5 | -0.024 2 | 1.153 3 | -0.022 9 | 1.130 4 | -0.047 1 |
| 贵州 | 1.224 2 | 0.024 4 | 1.248 6 | -0.074 9 | 1.173 8 | -0.050 4 |
| 云南 | 1.177 9 | -0.011 9 | 1.166 0 | -0.035 6 | 1.130 4 | -0.047 5 |
| 下游 | 1.152 0 | -0.035 4 | 1.116 6 | -0.032 2 | 1.084 5 | -0.067 5 |
| 中游 | 1.152 9 | -0.035 1 | 1.117 8 | -0.013 4 | 1.104 3 | -0.048 5 |
| 上游 | 1.188 8 | -0.013 5 | 1.175 3 | -0.034 3 | 1.141 0 | -0.047 8 |
| 各省标准差 | 0.029 9 | 0.016 5 | 0.046 4 | -0.011 4 | 0.034 9 | 0.005 1 |
| 各省极差 | 0.103 3 | 0.050 3 | 0.153 5 | -0.046 8 | 0.106 8 | 0.003 5 |
| 长江经济带整体水平 | 1.166 3 | -0.023 6 | 1.142 7 | -0.027 9 | 1.114 8 | -0.051 5 |
表5 2015年各省城乡居民福祉与各项满意度相关系数Table 5 The correlation between urban and rural residents' well-being and various satisfaction levels of each province in 2015 |
| 分项满意度 | 与城镇居民福祉的pearson相关系数 | 与乡村居民福祉的pearson相关系数 |
|---|---|---|
| 公共教育服务 | 0.45 | 0.19 |
| 医疗公共卫生 | 0.25 | 0.34 |
| 基本住房保障 | 0.47 | 0.4 |
| 社会管理 | 0.55 | 0.51 |
| 社会保障 | 0.42 | 0.41 |
| 公共文化与体育设施 | 0.69 | 0.52 |
| 基础设施 | 0.74 | 0.58 |
|

1 数据来源及相关说明见http://cgss.ruc.edu.cn/。
|
白描,吴国宝. 2017. 农民主观福祉现状及其影响因素分析——基于5省10县农户调查资料. 中国农村观察,(1):41-51.
Bai Miao and Wu Guobao.2017.An Analysis on Rural Residents' Subjective Well-Being and the Determinants: An Empirical Survey Based on Rural Household Data from Ten Counties in Five Provinces.China Rural Survey, (1): 41-51.
|
|
|
|
|
|
|
|
戴柳燕,周国华,何兰. 2019. 乡村吸引力的概念及其形成机制. 经济地理,39(8):177-184.
|
|
戴柳燕,周国华,唐承丽,贺艳华,谭先第. 2018. 基于地理学视角的乡村生活质量研究进展及展望. 人文地理,33(5):12-18.
|
|
|
|
|
|
|
|
付占辉,梅林,刘艳军,郑茹敏. 2019. 东北三省城乡收入差距空间格局及其分异机制研究. 地理科学,39(9):1473-1483.
|
|
傅辰昊,周素红,闫小培,古杰. 2015. 中国城乡居民生活水平差距的时空变化及其影响因素. 世界地理研究,24(4):67-77.
|
|
冯伟林,李树茁,李聪. 2013. 生态系统服务与人类福祉——文献综述与分析框架. 资源科学,35(7):1482-1489.
|
|
苟晓霞. 2011. 我国平均预期寿命变动的实证分析. 统计与决策,(22):104-106.
|
|
何仁伟. 2018. 城乡融合与乡村振兴:理论探讨、机理阐释与实现路径.地理研究,37(11):2127-2140.
|
|
贺艳华,周国华,唐承丽,谭雪兰,陈征,范曙光. 2017. 城市群地区城乡一体化空间组织理论初探. 地理研究,36(2):241-252.
|
|
贺艳华,邬建国,周国华,周兵兵. 2020. 论乡村可持续性与乡村可持续性科学. 地理学报,75(4):736-752.
|
|
|
|
黄甘霖,姜亚琼,刘志锋,聂梅,刘阳,李经纬,鲍宇阳,王玉海,邬建国. 2016. 人类福祉研究进展——基于可持续科学视角.生态学报,36(23):7519-7527.
|
|
韩增林,李彬,张坤领. 2015. 中国城乡基本公共服务均等化及其空间格局分析. 地理研究,34(11):2035-2048.
|
|
|
|
刘彦随. 2018. 中国新时代城乡融合与乡村振兴. 地理学报,73(4):637-650.
|
|
|
|
|
|
邱红,李晶华,于丽莎,于涤,侯筑林. 2018. 人口平均预期寿命及疾病影响因素分析. 人口学刊,40(6):31-39.
|
|
|
|
申津羽,韩笑,侯一蕾,温亚利. 2014. 贫困山区的农户主观福祉影响因素研究——以湖南省湘西州为例. 资源科学,36(10):2174-2182.
|
|
宋洪远,马永良. 2004. 使用人类发展指数对中国城乡差距的一种估计. 经济研究,(11):4-15.
Song Hongyuan and Ma Yongliang. 2004. Measuring Rual-Urban Disparity in China by Human Development Index Method. Economic Research Journal, (11): 4-15.
|
|
唐承丽,贺艳华,周国华,曾山山,肖路遥. 2014. 基于生活质量导向的乡村聚落空间优化研究. 地理学报,69(10):1459-1472.
|
|
United Nations Environmental Program. 2005. Millennium Ecosystem Assessment Ecosystems and Human Well-Being: A Framework for Assessment. Washington D C: Island Press.
|
|
United Nations Development Programme. 2019. Human Development Report 2019: Beyond Income, Beyond Averages, Beyond Today: Inequalities in Human Development in the 21st Century.New York: UNDP.
|
|
王圣云. 2011. 多维转向与福祉地理学研究框架重构.地理科学进展,30(6):739-745.
|
|
王圣云,罗玉婷,韩亚杰,李晶. 2018. 中国人类福祉地区差距演变及其影响因素——基于人类发展指数(HDI)的分析.地理科学进展,37(8):1150-1158.
|
|
温勇,尹勤. 2006. 人口统计学. 南京:东南大学出版社. [Wen Yong and Yi Qin. 2006. Demography.Nanjing: Southeast University Press. ]
|
|
许彩玲,李建建. 2019. 城乡融合发展的科学内涵与实现路径——基于马克思主义城乡关系理论的思考.经济学家,(1):96-103.
|
|
谢守红,周芳冰,吴天灵,傅春梅. 2020. 长江三角洲城乡融合发展评价与空间格局演化.城市发展研究,27(3):28-32.
|
|
张军以,苏维词,王腊春,李学梅. 2019. 西南喀斯特地区城乡融合发展乡村振兴路径研究.农业工程学报,35(22):1-8.
|
|
曾文,张小林,向梨丽,李红波,朱彬. 2014. 江苏省县域城市生活质量的空间格局及其经济学解析. 经济地理,34(7):28-35.
|
|
周国华,刘畅,唐承丽,贺艳华,吴佳敏,何兰. 2018. 湖南乡村生活质量的空间格局及其影响因素.地理研究,37(12):2475-2489.
|
/
| 〈 |
|
〉 |