
Spatial Evolution and Influencing Factors of the Manufacturing Industry on Metropolitan Areas: A Case Study of Changsha
Received date: 2021-12-17
Revised date: 2022-01-27
Online published: 2022-05-26
Manufacturing is an important engine of China's economy, driving urban economic growth and spatial transformation. Therefore, the spatial evolution of manufacturing is a research hotspot for academics. This study takes the Changsha metropolitan area as an example, based on the micro-data on manufacturing enterprises from 1978 to 2020. Using the standard deviational ellipse, kernel density analysis method, and explored negative binomial regression model, the spatial evolution characteristics and influencing factors of the manufacturing industry in the Changsha metropolitan area from the point-and-surface perspective are explored. The main conclusions are as follows. From 1978 to 2020, the number of manufacturing enterprises in the Changsha metropolitan area show an overall increasing trend, with labor-intensive and capital-intensive manufacturing gradually upgrading to a technology-intensive form. In terms of spatial distribution, all manufacturing industries show an apparent movement of suburbanization in spatial distribution. Development zones are progressively becoming the primary spatial carrier for manufacturing reorganization and concentration. The manufacturing industry mainly expands along the "northwest-southeast" direction, showing a "point-axis" development pattern. In the process of spatial evolution, the Changsha manufacturing space has experienced a cyclical change from agglomeration to dispersion and then to accumulation. The evolution pattern has changed from mosaic filling to outward diffusion. Influenced by the characteristics of the industry, different types of manufacturing industries show apparent differences in spatial distribution. Labor-intensive enterprises are mostly micro-enterprises with flexible site layout, mainly contact diffusion and hierarchical diffusion, and the spatial characteristics of "central concentration and decentralized layout." The large-scale demand for land and employees in capital-intensive manufacturing industries-mainly large enterprises-restricts their concentration in urban centers. Meanwhile, preferential policies, such as "policy rent" in the development parks in peripheral suburbs, attract enterprises to move in, prompting capital-intensive manufacturing industries to show the spatial characteristics of "large-scale diffusion and small-scale concentration." Technology-intensive manufacturing industries are mostly small and medium-sized enterprises, which are attracted by national development zones and have strong vocational orientations. In the spatial evolution process of the manufacturing industry, factors such as socioeconomics, production cost, and governmental behavior have significant influence. Different factors play different roles in different industries. Labor-intensive enterprises are mainly affected by socioeconomics, production costs, and government behavior. Technology-intensive enterprises pay more attention to regional economic benefits, innovation environment, and policy support, while socio-economic factors, production cost, built-up environment, governmental actions, and innovation capacity all have important impacts on them. Capital-intensive enterprises are highlighted by the role of the population base, transportation accessibility, land cost, and industrial park policies. Capital-intensive enterprises are highly dependent on population, production cost, transportation accessibility, and the number of industrial zones. It can be found that the spatial evolution of all three types of manufacturing industries is significantly influenced by governmental actions; among which, the level of fixed asset investment and number of industrial parks reflect the planning guidance and policy orientation of Changsha's municipal government on manufacturing development. In addition, the degree of opening up to the outside world negatively affects the layout of all three types of manufacturing enterprises, indicating that the large influx of foreign capital tends to form industrial monopolies. This study provides a reference for optimizing the layout and high-quality development of urban manufacturing space.
Chen Luo , Bohong Zheng , Linlin Liu . Spatial Evolution and Influencing Factors of the Manufacturing Industry on Metropolitan Areas: A Case Study of Changsha[J]. Tropical Geography, 2022 , 42(5) : 773 -787 . DOI: 10.13284/j.cnki.rddl.003484
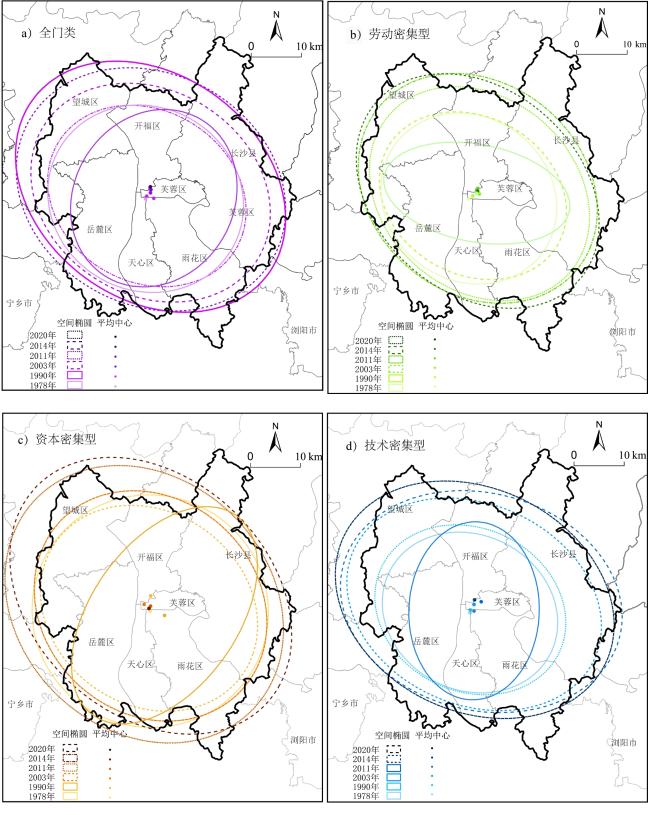
图3 长沙大都市区制造业空间演变的标准差椭圆变化(1978―2020年)Fig.3 Standard deviation ellipse of the spatial distribution of manufacturing in Changsha metropolitan area from 1978 to 2020 |
表1 长沙都市区制造业SDE结果分析Table 1 Result of SDE in manufacturing industries in Changsha metropolitan area |
| 行业 | 年份 | 椭圆中心坐标 | X轴/km | Y轴/km | 方位角θ/(°) | 面积/km2 |
|---|---|---|---|---|---|---|
| 全门类制造业 | 1978 | 28°11′13″ N,112°59′49″ E | 15.92 | 18.33 | 57.896 | 916.44 |
| 1990 | 28°11′13″ N,112°58′48″ E | 19.90 | 18.30 | 102.411 | 1 143.94 | |
| 2003 | 28°11′31″ N,112°58′59″ E | 20.66 | 17.10 | 109.606 | 1 109.79 | |
| 2011 | 28°11′49″ N,112°59′24″ E | 25.14 | 20.39 | 111.373 | 1 610.12 | |
| 2014 | 28°12′11″ N,112°59′28″ E | 27.93 | 23.05 | 108.525 | 2 022.18 | |
| 2020 | 28°12′29″ N,112°59′24″ E | 29.22 | 22.34 | 116.955 | 2 050.69 | |
| 劳动密集型 | 1978 | 28°12′00″ N,112°59′24″ E | 18.66 | 9.65 | 99.563 | 565.78 |
| 1990 | 28°11′24″ N,112°58′23″ E | 18.11 | 16.18 | 108.649 | 920.52 | |
| 2003 | 28°11′42″ N,112°58′55″ E | 19.40 | 15.59 | 110.198 | 950.28 | |
| 2011 | 28°11′56″ N,112°59′42″ E | 23.73 | 19.01 | 118.451 | 1 416.98 | |
| 2014 | 28°12′29″ N,112°59′31″ E | 25.38 | 20.84 | 115.601 | 1 661.69 | |
| 2020 | 28°12′11″ N,112°59′28″ E | 26.74 | 20.11 | 123.063 | 1 688.87 | |
| 资本密集型 | 1978 | 28°10′41″ N,113°01′01″ E | 14.59 | 24.57 | 43.766 | 1 126.23 |
| 1990 | 28°11′10″ N,112°59′24″ E | 23.67 | 23.21 | 92.536 | 1 725.89 | |
| 2003 | 28°11′20″ N,112°59′13″ E | 22.90 | 19.26 | 112.164 | 1 385.58 | |
| 2011 | 28°11′42″ N,112°59′24″ E | 24.78 | 21.38 | 114.656 | 1 664.57 | |
| 2014 | 28°11′56″ N,112°58′37″ E | 30.22 | 25.14 | 118.460 | 2 386.18 | |
| 2020 | 28°12′47″ N,112°59′28″ E | 31.61 | 23.68 | 122.576 | 2 351.64 | |
| 技术密集型 | 1978 | 28°11′13″ N,112°59′13″ E | 13.01 | 17.79 | 4.584 | 727.24 |
| 1990 | 28°11′2″ N,112°58′44″ E | 18.04 | 15.47 | 106.135 | 876.71 | |
| 2003 | 28°11′20″ N,112°58′48″ E | 19.68 | 16.26 | 106.723 | 1 005.19 | |
| 2011 | 28°11′56″ N,112°59′17″ E | 26.38 | 20.03 | 107.712 | 1 659.50 | |
| 2014 | 28°12′11″ N,113°00′07″ E | 28.50 | 21.70 | 100.710 | 1 942.51 | |
| 2020 | 28°12′25″ N,112°59′20″ E | 29.04 | 22.23 | 109.004 | 2 027.89 |
表2 长沙都市区制造业企业区位选择影响因素的各指标变量选择及描述Table 2 Each index variable description of influencing manufacturing enterprise location choices |
| 变量类型 | 变量名称 | 变量代码 | 变量说明 | |
|---|---|---|---|---|
| 因变量 | 企业选址 | 全门类制造业 | Manufacturing | 制造业企业数量/个 |
| 劳动密集型 | Labor | 劳动密集型制造业企业数量/个 | ||
| 资本密集型 | Capital | 资本密集型制造业企业数量/个 | ||
| 技术密集型 | Technology | 技术密集型制造业企业数量/个 | ||
| 自变量 | 社会经济 | 经济基础 | PGDP | 人均国内生产总值/(万元·人-1) |
| 人口数量 | Population | 年末总人口/百万 | ||
| 工业水平 | Industry | 工业总产值/千亿元 | ||
| 生产成本 | 土地成本 | Land | 地区工业用地出让平均价格/(百元·m-2) | |
| 劳动力成本 | Wage | 区域职工平均工资/万元 | ||
| 建成环境 | 道路基础设施 | Mileage | 公路总里程数/1 000 km | |
| 城市环境 | Green | 城市绿地率/% | ||
| 政府行为 | 供给导向 | Investment | 固定资产投资水平/千亿元 | |
| 对外开放水平 | Open | 制造业外商直接投资金额/亿美元 | ||
| 工业园区数 | Park | 省级以上工业园区数量/个 | ||
| 创新能力 | 专利研发 | Patent | 专利申请数量/万件 | |
表3 负二项回归结果(2000―2020年)Table 3 Results of negative binomial regression analysis from 2000 to 2020 |
| 自变量 | 模型A:全门类制造业 | 模型B:劳动密集型 | 模型C:技术密集型 | 模型D:资本密集型 |
|---|---|---|---|---|
| PGDP | 0.023 1** (3.01) | 0.026 1***(4.38) | 0.032 6***(4.90) | 0.012 1(1.54) |
| Population | 0.600 7***(7.65) | 0.543 8***(7.98) | 0.578 4***(7.54) | 0.651 2***(6.14) |
| Industry | 0.010 6*(1.73) | 0.009 1(1.60) | 0.010 1**(2.06) | 0.009 1(1.35) |
| Land | -0.008 2* (-1.88) | -0.008 7**(-2.12) | -0.004 2(-0.89) | -0.012 7**(-2.47) |
| Wage | -0.094 8**(-2.36) | -0.092 1***(-2.77) | -0.097 0***(-3.34) | -0.123 5***(-3.30) |
| Mileage | 0.019 5**(2.06) | 0.003 9(0.41) | 0.017 5**(2.44) | 0.042 2***(3.82) |
| Green | 0.001 6(0.68) | 0.002 2(0.92) | 0.001 0(0.51) | 0.003 2(1.26) |
| Investment | 0.021 0(0.87) | 0.041 3*(1.92) | 0.007 8(0.44) | 0.036 3*(1.72) |
| Open | -0.006 2**(-3.28) | -0.008 7***(-4.95) | -0.004 8***(-3.62) | -0.007 6***(-3.78) |
| Park | 0.040 6***(5.17) | 0.040 5***(5.06) | 0.045 7***(5.71) | 0.039 1***(4.51) |
| Patent | 0.031 5(1.34) | 0.028 3(1.63) | 0.044 1**(2.51) | 0.040 7*(1.90) |
| 常数 | 5.079 7***(11.73) | 4.355 1***(11.28) | 4.168 7***(9.88) | 3.507 7***(6.10) |
| R 2 | 0.33 | 0.37 | 0.38 | 0.37 |
| N | 21 | 21 | 21 | 21 |
|

1 https://www.tianyancha.com/
2 http://www.gsxt.gov.cn/
3 https://lbs.amap.com/
4 http://tjj.changsha.gov.cn/tjxx/tjsj/tjnj/
5 http://www.changsha.gov.cn/szf/ztzl/sjfb/tjgb/
骆 晨:论文选题,论文设计,提出论文研究方法,绘制分析图,论文撰写与修改;
郑伯红:指导研究过程,提出修改意见,提升论文质量;
刘琳琳:收集和整理数据,绘制分析图,提出修改意见。
|
Arauzo-Carod J M and Viladecans-Marsal E. 2009. Industrial Location at the Intra-Metropolitan Level: The Role of Agglomeration Economies. Regional Studies, 43(4): 545-558.
|
|
Aritenang A F. 2021. The Contribution of Foreign Investment and Industrial Concentration to Firm Competitiveness in Jakarta Megacity. Cities, 113: 103152.
|
|
Baldwin R E and Okubo T. 2006. Heterogeneous Firms, Agglomeration and Economic Geography: Spatial Selection and Sorting. Journal of Economic Geography, 6(3): 323-346.
|
|
Brouwer A E, Mariotti I and Van Ommeren J N. 2004. The Firm Relocation Decision: An Empirical Investigation. Annals of Regional Science, 38(2): 335-347.
|
|
陈强. 2010. 高级计量经济学及Stata应用. 北京:高等教育出版社. [Chen Qiang. 2010. Advanced Econometrics and Stata Applications. Beijing: Higher Education Press.]
|
|
崔喆,沈丽珍,刘子慎. 2020. 南京市新街口CBD服务业空间集聚及演变特征——基于微观企业数据. 地理科学进展,39(11):1832-1844. [Cui Zhe, Shen Lizhen and Liu Zishen. 2020. Spatial Agglomeration Characteristics of Service Industry in Xinjiekou CBD of Nanjing City and Change: Based on Micro Enterprise Data. Progress in Geography, 39(11): 1832-1844.]
|
|
长沙市统计局. 2018. 改革开放40年长沙工业经济转型升级成效显著. (2018-09-18) [2022-04-30]. http://www.changsha.gov.cn/szf/ztzl/sjfb/tjfx/201809/t20180918_8254375.html. [The Burau of Statistics of Changsha. 2018. 40 Years of Reform and Opening Up Changsha Industrial Economy Transformation and Upgrading of Remarkable Results. (2018-09-18) [2022-04-30]. http://www.changsha.gov.cn/szf/ztzl/sjfb/tjfx/201809/t20180918_8254375.html.]
|
|
Florida R, Gulden T and Mellander C. 2008. The Rise of the Mega-Region. Cambridge Journal of Regions Economy and Society, 1(3): 459-476.
|
|
樊秀峰,康晓琴. 2013. 陕西省制造业产业集聚度测算及其影响因素实证分析. 经济地理,33(9):115-119. [Fan Xiufeng and Kang Xiaoqin. 2013. Agglomeration Level Measurement of Manufacturing in Shanxi Province and Its Influencing Factors Empirical Analysis. Economic Geography, 33(9): 115-119.]
|
|
高辰,申玉铭. 2018. 北京市制造业空间格局及演变分析. 地域研究与开发,37(5):30-36. [Gao Chen and Shen Yuming. 2018. Spatial Pattern and Evolution of Manufacturing Industry in Beijing City. Areal Research and Development, 37(5): 30-36.]
|
|
高金龙,袁丰,陈雯. 2017. 转型期城市制造业空间重构过程与机理——以南京市为例. 地理研究,36(6):1014-1028. [Gao Jinlong, Yuan Feng and Chen Wen. 2017. Economic Transition and Restructuring of Manufacturing Spaces in Urban China: The Evidence from Nanjing. Geographical Research, 36(6): 1014-1028.]
|
|
国家统计局. 2017. 国民经济行业分类(GB/T 4754-2017). 北京:中华人民共和国国家质量监督检验检疫总局;中国国家标准化管理委员会. [Bureau China State Statistical. 2017. Industrial Classification for National Economic Activities of the People's Republic of China (GB/T4754-2017). Beijing: General Administration of Quality Supervision, Inspection and Quarantine of the People's Republic of China; Standardization Administration.]
|
|
Hise G. 2001. Nature's Workshop Industry and Urban Expansion in Southern California, 1900-1950. Journal of Historical Geography, 27(1): 74-92.
|
|
蒋海兵,李业锦. 2021. 京津冀地区制造业空间格局演化及其驱动因素. 地理科学进展,40(5):721-735. [Jiang Haibing and Li Yejin. 2021. Change of Spatial Structure of Manufacturing Industry in the Beijing-Tianjin-Hebei Region and Its Driving Factors. Progress in Geography, 40(5): 721-735.]
|
|
蒋丽. 2014. 广州制造业空间布局及其形成原因. 热带地理,34(6):850-858. [Jiang Li. 2014. Spatial Distribution and Driving Force of Manufacturing in Guangzhou. Tropical Geography, 34(6): 850-858.]
|
|
Kang Jiangjiang, Xu Wei, Yu Li and Ning Yueming. 2020. Localization, Urbanization and Globalization: Dynamic Manufacturing Specialization in the YRD Mega-City Conglomeration. Cities, 99: 102641.
|
|
Kaygalak I and Reid N. 2016. The Geographical Evolution of Manufacturing and Industrial Policies in Turkey. Applied Geography, 70: 37-48.
|
|
Kichko S. 2019. Competition, Land Prices and City Size. Journal of Economic Geography, 20(6): 1313-1329.
|
|
Krugman P. 1993. First Nature, Second Nature, and Metropolitan Location. Journal of Regional Science, 3740(33): 129-144.
|
|
Lewis R D. 2001. A City Transformed: Manufacturing Districts and Suburban Growth In Montreal, 1850-1929. Journal of Historical Geography, 27(1): 20-35.
|
|
梁育填,樊杰,柳林,张有坤,陈小良. 2013. 优化开发区域制造业企业迁移的因素及其区域影响——以广东东莞市为例. 地理研究,32(3):497-506. [Liang Yutian, Fan Jie, Liu Lin, Zhang Youkun and Chen Xiaoliang. 2013. The Influencing Factors of Manufacturing Firm Migration and Its Impact on Development-Optimized Region: A Case Study of Dongguan City of Guangdong Province in China. Geographical Research, 32(3): 497-506.]
|
|
林柄全,谷人旭,王俊松. 2020. 集聚经济与基于价值链的企业区位选择——重新发现内部集聚经济. 经济地理,40(4):56-64,74. [Lin Bingquang, Gu Renxu and Wang Junsong. 2020. Agglomeration Economies and Location Choices Through the Value Chain: Rediscover the Internal Agglomeration Economies. Economic Geography, 40(4): 56-64, 74.]
|
|
刘汉初,樊杰,张海朋,王甫园. 2020. 珠三角城市群制造业集疏与产业空间格局变动. 地理科学进展,39(2):195-206. [Liu Hanchu, Fan Jie, Zhang Haipeng and Wang Fuyuan. 2020. Dynamics of Manufacturing Industry and Change of Its Spatial Pattern in the Pearl River Delta Urban Agglomeration. Progress in Geography, 39(2): 195-206.]
|
|
刘路云,郑伯红. 2015. 基于工业用地扩展的长沙城市空间演变与优化. 地域研究与开发,34(4):54-59. [Liu Luyun and Zheng Bohong. 2015. Evolution and Optimization of Changsha City Space Based on Industrial Land Expansion. Areal Research and Development, 34(4): 54-59.]
|
|
骆晨,郑伯红,刘琳琳. 2021. 制度对城市都市区制造业空间演变的影响——以长沙市为例. 地理科学进展,40(7):1167-1180. [Luo Chen, Zheng Bohong and Liu Linlin. 2021. The Influence of Institution on the Spatial Evolution of Manufacturing Industry in Metropolitan Areas: A Case Study of Changsha City. Progress in Geography, 40(7): 1167-1180.]
|
|
Muller E K. 2001. Industrial Suburbs and the Growth of Metropolitan Pittsburgh, 1870-1920. Journal of Historical Geography, 27(1): 58-73.
|
|
Ozawa T. 2003. Pax Americana-Led Macro-Clustering and Flying-Geese-Style Catch-Up in East Asia: Mechanisms of Regionalized Endogenous Growth. Journal of Asian Economics, 13(6): 699-713.
|
|
Sun Chuanzhun, Sun Chao, Yang Zhenshan, Zhang Jikang and Deng Yu. 2016. Urban Land Development for Industrial and Commercial Use: A Case Study of Beijing. Sustainability, 8(12): 1323.
|
|
孙威,林晓娜. 2020. 柳州市汽车制造业企业的空间格局与影响因素. 地球信息科学学报,22(6):1216-1227. [Sun Wei and Lin Xiaona. 2020. The Spatial Distribution of Automobile Manufacturing Enterprises and Its Influencing Factors in Liuzhou. Journal of Geo-Information Science, 22(6): 1216-1227.]
|
|
Wachowicz Monica and Liu Tianyu. 2016. Finding Spatial Outliers in Collective Mobility Patterns Coupled with Social Ties. International Journal of Geographical Information Science, 30(9): 1806-1831.
|
|
Weber A. 1960. Theory of the Location of Industries. Nature, 1(15): 1.
|
|
Wheaton W C and Lewis M J. 2002. Urban Wages and Labor Market Agglomeration. Journal of Urban Economics, 51(3): 542-562.
|
|
王俊松. 2014. 长三角制造业空间格局演化及影响因素. 地理研究,33(12):2312-2324. [Wang Junsong. 2014. Evolution of Spatial Pattern and Influencing Factors of Manufacturing Industries in Yangtze River Delta Region. Geographical Research, 33(12): 2312-2324.]
|
|
巫细波. 2019. 外资主导下的汽车制造业空间分布特征及其影响因素——以广州为例. 经济地理,39(7):119-128. [Wu Xibo. 2019. Spatial Distribution Evolvement Characteristics and Influencing Factors of Automobile Manufacturing Industry Under the Guidance of Foreign Investment: A Case Study of Guangzhou. Economic Geography, 39(7): 119-128.]
|
|
徐维祥,张筱娟,刘程军. 2019. 长三角制造业企业空间分布特征及其影响机制研究:尺度效应与动态演进. 地理研究,38(5):1236-1252. [Xu Weixiang, Zhang Xiaojuan and Liu Chengjun. 2019. Spatial Distribution Pattern and Influencing Factors of Manufacturing Enterprises in Yangtze River Delta: Scale Effects and Dynamic Evolution. Geographical Research, 38(5): 1236-1252.]
|
|
Yeung H W and Coe N M. 2015. Toward a Dynamic Theory of Global Production Networks. Economic Geography, 91(1): 29-58.
|
|
Yang Zhenshan and Dunford Michael. 2017. Cluster Evolution and Urban Industrial Dynamics in the Transition from a Planned to a Socialist Market Economy: The Case of Beijing. Spatial Economic Analysis, 12(1): 50-71.
|
|
Yang Fiona Fan, Yeh Anthony G O and Wang Jiejing. 2018. Regional Effects of Producer Services on Manufacturing Productivity in China. Applied Geography, 97: 263-274.
|
|
叶强,莫正玺,许乙青. 2019. 1979-2014年长沙市城市功能用地扩展与驱动力研究. 地理研究,38(5):1063-1079. [Ye Qiang, Mo Zhengxi and Xu Yiqing. 2019. The Expansion and Driving Forces of the Functional Space Land: A Case Study of Changsha from 1979 to 2014. Geographical Research, 38(5): 1063-1079.]
|
|
张晓平,孙磊. 2012. 北京市制造业空间格局演化及影响因子分析. 地理学报,67(10):1308-1316. [Shun Xiaoping and Sun Lei. 2019. Manufacture Restructuring and Main Determinants in Beijing Metropolitan Area. Acta Geographica Sinica, 67(10): 1308-1316.]
|
|
张杰,唐根年. 2018. 浙江省制造业空间分异格局及其影响因素. 地理科学,38(7):1107-1117. [Zhang Jie and Tang Gennian. 2018. Spatial Differentiation Pattern of Manufacturing Industry in Zhejiang and Its Influencing Factors. Scientia Geographica Sinica, 38(7): 1107-1117.]
|
|
张可云,裴相烨. 2021. 大城市制造业企业空间扩张模式及其对企业效率的影响——以北京市上市企业为例. 地理科学进展,40(10):1613-1625. [Zhang Keyun and Pei Xiangye. 2021. Spatial Expansion Mode of Manufacturing Firms in Big Cities and Its Impact on Firm Efficiency: A Case Study of Beijing Listed Firms. Progress in Geography, 40(10): 1613-1625.]
|
|
周锐波,李晓雯. 2017. 广东省制造业空间格局演化及其影响因素研究. 人文地理,32(2):95-102. [Zhou Ruibo and Li Xiaowen. 2017. Evolution of Spatial Pattern and Influencing Factors of Manufacturing Industries in Guangdong Province. Human Geography, 32(2): 95-102.]
|
|
周伟,赵艳,宁煊. 2020. 京津冀城市群制造业结构变迁与空间集聚影响因素分析. 地理科学,40(11):1921-1929. [Zhou Wei, Zhao Yan and Ning Xuan. 2020. Manufacturing Industry Structure Changes and Spatial Agglomeration Influence Factors in Beijing-Tianjin-Hebei Urban Agglomeration. Scientia Geographica Sinica, 40(11): 1921-1929.]
|
/
| 〈 |
|
〉 |