
Evaluation of Multiple Precipitation Products in the Hainan Island
Received date: 2023-10-12
Revised date: 2024-01-09
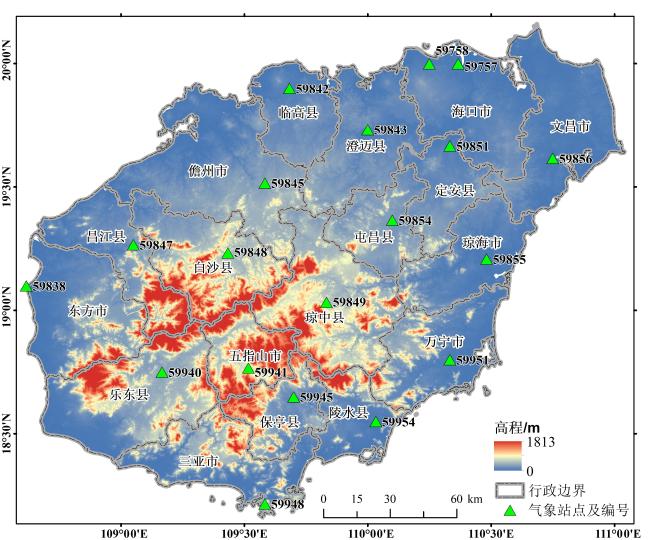
Online published: 2024-09-05
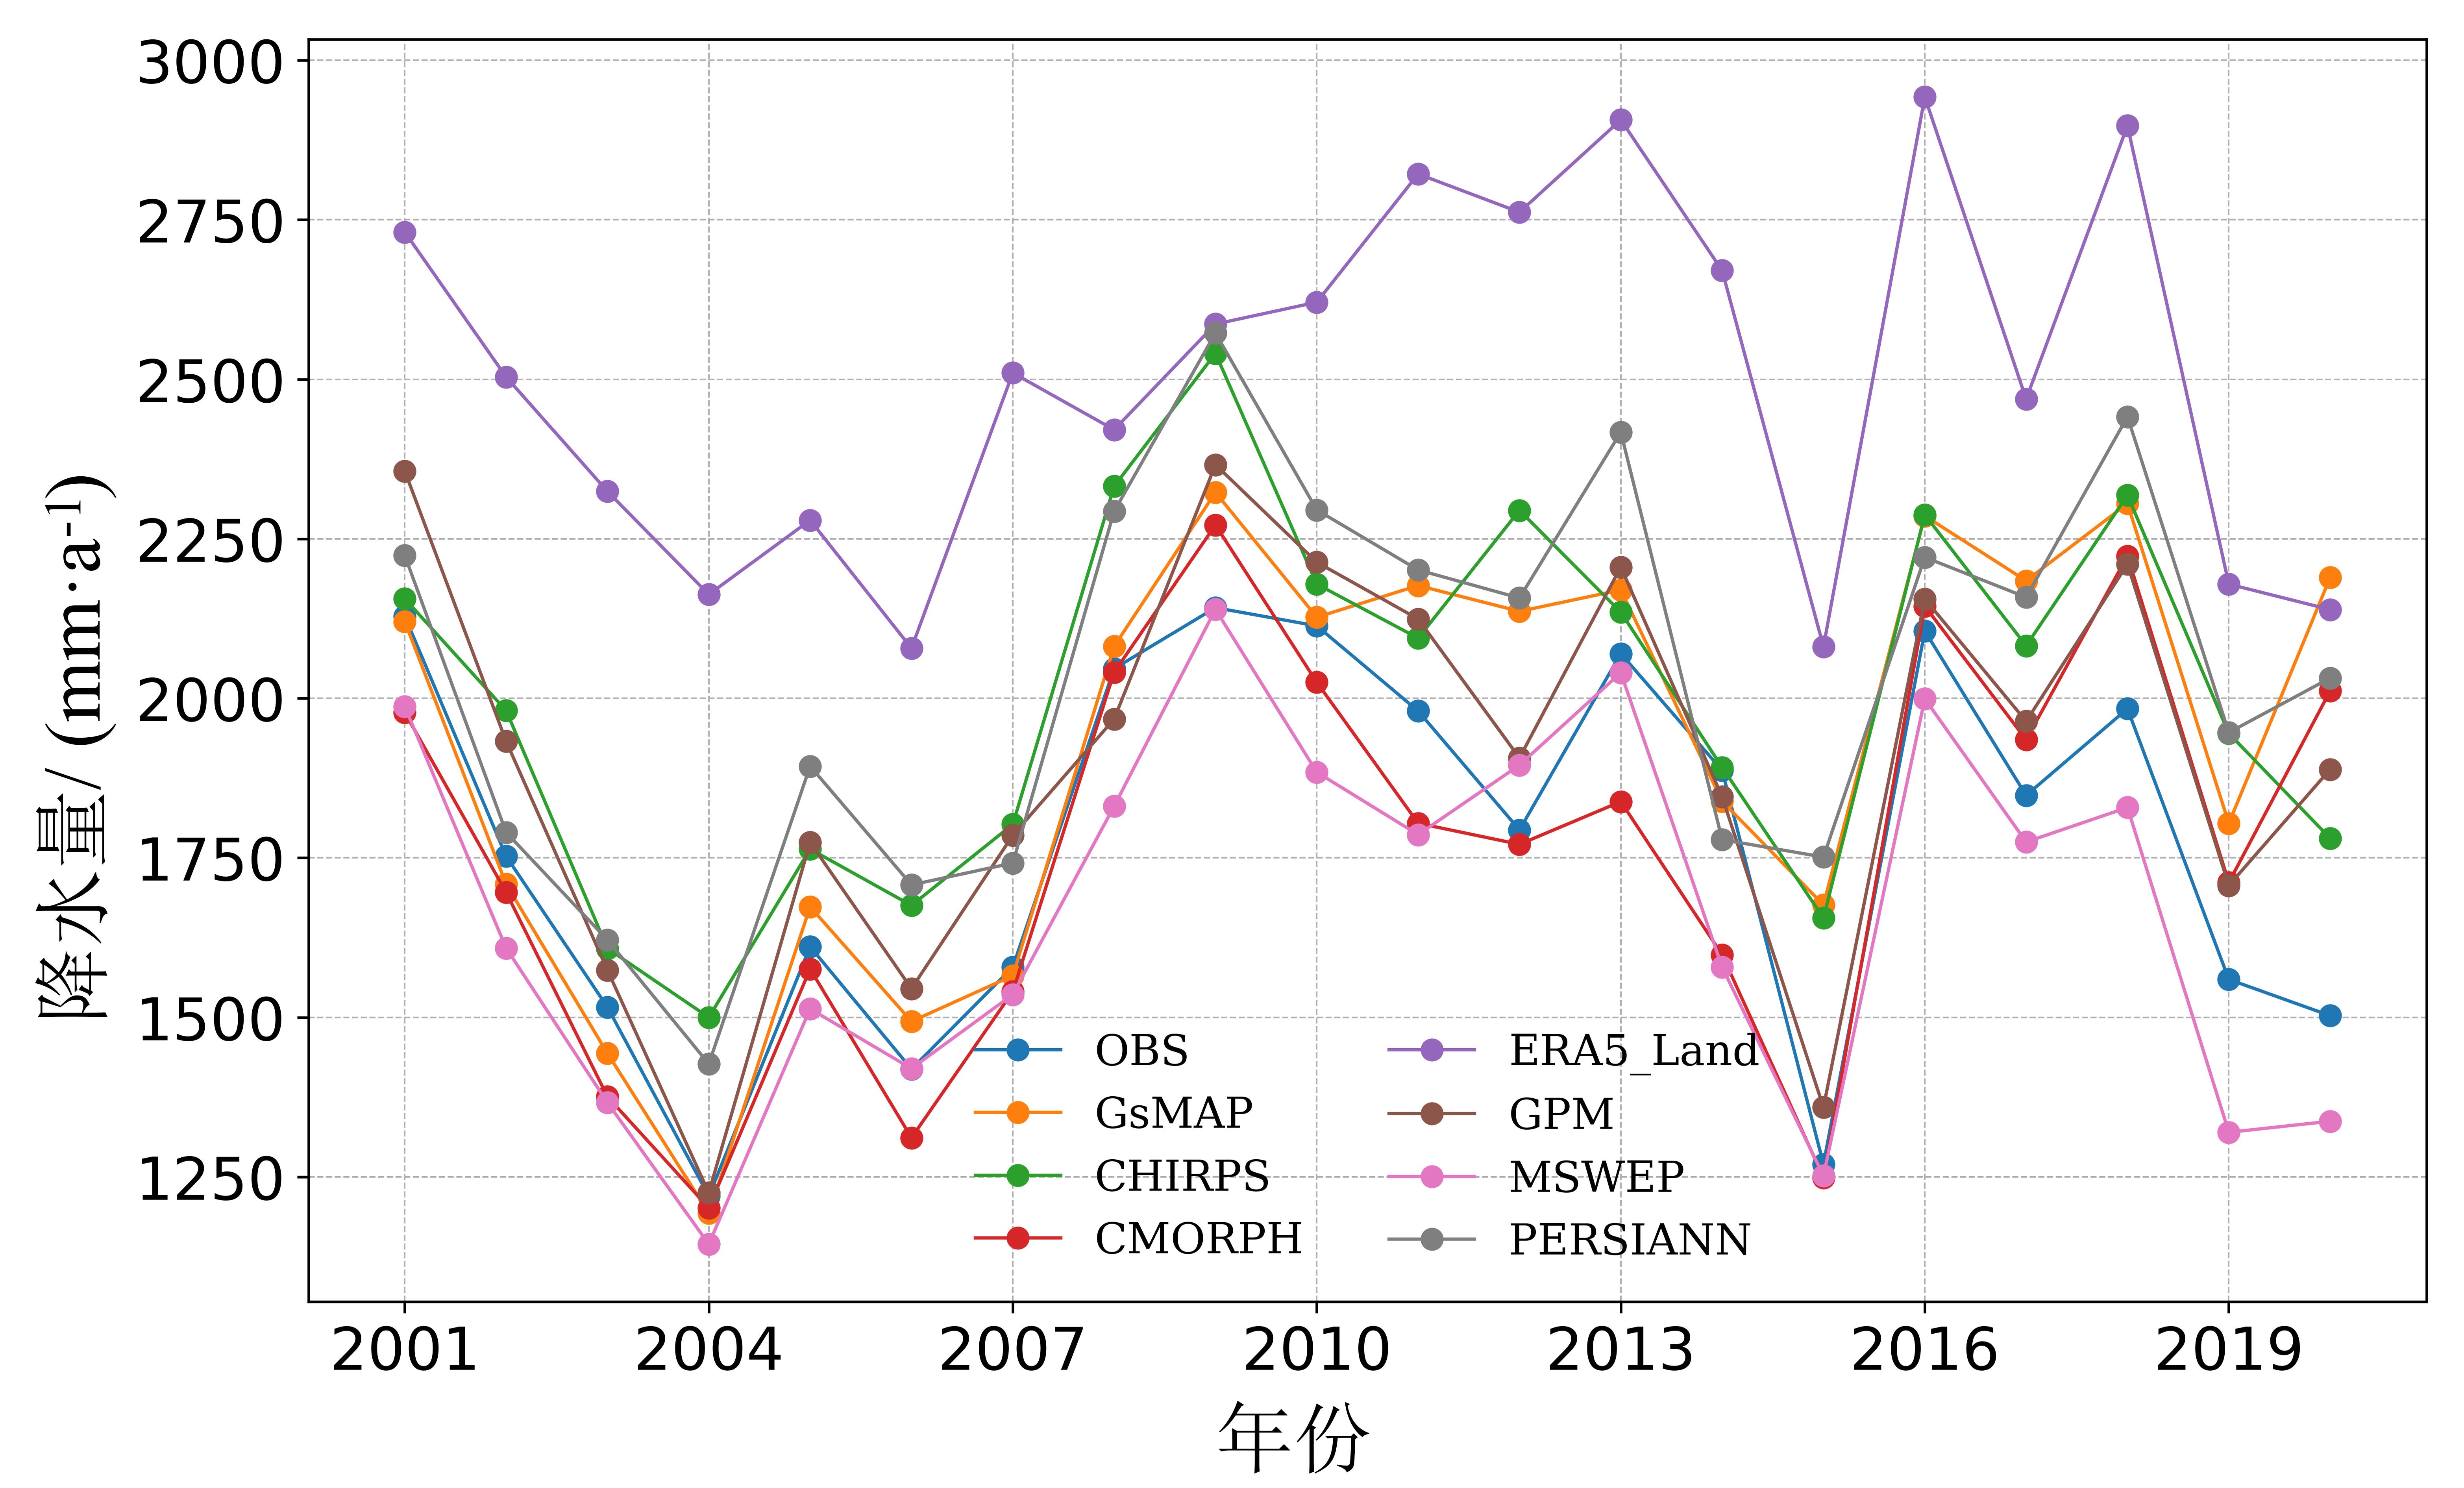
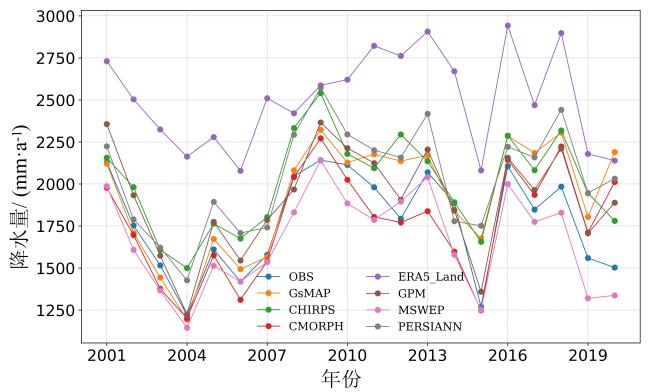
Global precipitation observations have been realized through the development of satellite remote-sensing technology. However, there is a lack of evaluation of remote-sensing precipitation products in complex tropical island terrains. This study used hourly rain gauge data to conduct a multi-scale systematic evaluation of common precipitation products, such as CMORPH, CHIRPS, GsMAP, GPM, MSWEP, ERA5-Land, and PERSIANN, over Hainan Island, providing an in-depth analysis of the precipitation detection capabilities of various products in this region. The main conclusions are: (1) In a multi-temporal scale evaluation, GPM and GsMAP outperformed the other products across all time scales. On a 3-hour scale, GPM and GsMAP showed the highest correlation coefficients (0.53 and 0.52, respectively). On a daily scale, except for PERSIANN, all products showed correlation coefficients above 0.56, with GPM and GsMAP showing the best performance (R = 0.73 and 0.74, respectively). (2) In comparing annual precipitation, Hainan Island's average-annual precipitation over the past 20 years showed a fluctuating trend, with a mean of 1,776.4 mm/a. The CMORPH annual average of 1,765.1 mm/a was the closest to the CHM-PRE dataset, with minimal error. ERA5-Land and MSWEP significantly overestimated (2,504.3 mm/a) and underestimated (1,662.2 mm/a) the average-annual precipitation, respectively. (3) Spatial distribution pattern analysis revealed that the observed multi-year annual precipitation in Hainan Island ranges from 996.9 to 2,368.9 mm, exhibiting an annular-distribution pattern with higher precipitation in the east than in the west and the southwestern mountainous areas than in the northeastern plains. The precipitation range of 1,337.9‒2,287.0 mm observed in GsMAP was the closest to the rain gauge data and particularly matched that of the high-value center in the southeast of the island. (4) In a precipitation trend analysis, CMORPH, ERA5-Land, GPM, MSWEP, CHIRPS, and PERSIANN showed an increasing trend in local areas of Hainan Island, while GsMAP showed a stronger increasing trend. (5) In an analysis of extreme precipitation events, GsMAP, CMORPH, and GPM reproduced the spatiotemporal evolution of extreme precipitation events on a daily scale in Hainan relatively well. GPM better reproduced the spatial and temporal evolution characteristics of typhoon precipitation events in Hainan Island. However, the accuracy of the precipitation estimation still requires improvement. The results of this study not only contribute to our understanding of precipitation products applicable to Hainan but also provide insights for improving satellite-based precipitation products in tropical island environments. These findings underscore the importance of regional validation and the potential of multi-product fusion approaches for enhancing precipitation estimates in complex terrains.
Shixi Li , Weijie Liao , Ming Shang , Jianchao Guo , Chenxiao Shi , Yue Yang , Lei Bai . Evaluation of Multiple Precipitation Products in the Hainan Island[J]. Tropical Geography, 2024 , 44(9) : 1588 -1601 . DOI: 10.13284/j.cnki.rddl.20230786
表1 研究中所使用降水产品的基本信息Table 1 Brief information of precipitation products used in this study |
| 数据集 | 网址 | 简称 | 时间 分辨率 | 空间 分辨率 | 时间 覆盖 | 制作 单位 | 反演原理 |
|---|---|---|---|---|---|---|---|
| CMORPH1.0 | https://rda.ucar.edu/datasets/ds502.0/ | CMORPH(Joyce et al., 2004) | 30 min | 8 km | 1998—2023年 | CPC | 基于卫星观测的融合,将地面雨量计数据、 红外和微波卫星数据进行融合 |
| CHIRPS | https://www.chc.ucsb.edu/data/chirps | CHRIPS(Funk et al., 2015) | 1 d | 0.05° | 1981—2023年 | USGS、 CHC | 基于地面雨量计数据和AVHRR红外传感器数据的融合,主要用于长时间序列降水分析 |
| GsMAP V7 | https://sharaku.eorc.jaxa.jp/GsMAP/ | GsMAP(Okamoto et al., 2005) | 1 h | 0.10° | 2000—2023年 | JAXA | 融合多种卫星传感器数据(包括微波和红外数据),同时也融合了地面雨量计数据 |
| MSWEP2.0 | http://www.gloh2o.org/mswep/ | MSWEP(Beck et al., 2017) | 3 h | 0.10° | 1979—2023年 | GloH2O | 基于全球多套遥感降水数据和再分析数据的融合,通过统计方法将多个数据源合并为一个高分辨率数据集 |
| ERA5-Land | https://cds.climate.copernicus.eu | ERA5-Land(Muñoz-Sabater et al., 2021) | 1 h | 0.10° | 1951—2023年 | ECMWF | 基于数值模式的输出,融合大量观测数据进行模拟,以产生高分辨率的降水和其他气象参数 |
| GPM IMERG V7 Final product | https://gpm.nasa.gov/data/news | GPM(Hou et al., 2014) | 30 min | 0.10° | 2000—2023年 | NASA | 融合GPM卫星的双频微波成像仪(DPR)和其他卫星传感器数据,提供近实时和再分析的降水估计 |
| PERSIANN CDR | https://climatedataguide.ucar.edu/ | PERSIANN(Sorooshian et al., 2000) | 3 h | 0.25° | 1983—2023年 | UCI | 基于神经网络算法,使用地面雨量计和红外传感器数据进行降水估算的降水产品 |
表2 研究中定义的雨量等级Table 2 Rainfall intensity threshold in the study |
| 雨量等级 | 3 h尺度/(mm·3 h-1) | 日尺度/(mm·d-1) |
|---|---|---|
| 小雨 | 2.9 | 9.9 |
| 中雨 | 9.9 | 24.9 |
| 大雨 | 19.9 | 49.9 |
| 暴雨 | 49.9 | 99.9 |
表3 2016—2020年不同时间尺度上多种降水产品的检测能力和评估指标比较Table 3 Comparison of detection capabilities and evaluation metrics for multiple precipitation products at different temporal scales, 2016-2020 |
| 统计指标 | 时间尺度 | GsMAP | CHIRPS | CMORPH | PERSIANN | ERA5-Land | GPM | MSWEP |
|---|---|---|---|---|---|---|---|---|
| R | 3 h | 0.52 | — | 0.46 | 0.33 | 0.26 | 0.53 | 0.51 |
| 1 d | 0.74 | 0.61 | 0.65 | 0.56 | 0.59 | 0.73 | 0.72 | |
| 雨季 | 0.52 | 0.53 | 0.70 | 0.35 | 0.27 | 0.56 | 0.54 | |
| 旱季 | 0.49 | 0.49 | 0.64 | 0.31 | 0.23 | 0.43 | 0.45 | |
| ME | 3 h | 0.09 | — | -0.30 | -0.44 | -0.65 | -0.31 | -0.08 |
| 1 d | 0.69 | -0.62 | -2.43 | -3.55 | -5.16 | -2.48 | -0.65 | |
| 雨季 | -0.09 | -0.43 | -0.26 | -2.55 | -0.41 | -0.27 | -0.07 | |
| 旱季 | -0.01 | -0.23 | -0.06 | -0.56 | -0.07 | -0.06 | -0.01 | |
| RMSE | 3 h | 3.54 | — | 3.61 | 5.83 | 3.88 | 3.41 | 3.41 |
| 1 d | 11.59 | 11.59 | 13.17 | 13.94 | 15.47 | 12.19 | 11.4 | |
| 雨季 | 3.48 | 13.80 | 3.54 | 5.65 | 4.00 | 3.48 | 3.33 | |
| 旱季 | 1.24 | 5.50 | 1.29 | 2.28 | 1.38 | 1.24 | 1.24 | |
| POD | 3 h | 0.76/0.54/0.42/0.19 | — | 0.44/0.32/0.22/0.07 | 0.43/0.07/0.01/0.00 | 0.02/0.00/0.00/0.00 | 0.57/0.36/0.21/0.05 | 0.83/0.43/0.25/0.07 |
| 1 d | 0.87/0.79/0.72/0.60 | 0.49/0.54/0.49/0.37 | 0.64/0.51/0.44/0.30 | 0.59/0.36/0.19/0.05 | 0.04/0.00/0.00/0.00 | 0.73/0.57/0.45/0.29 | 0.97/0.75/0.61/0.40 | |
| FAR | 3 h | 0.60/0.57/0.58/0.64 | — | 0.48/0.51/0.54/0.62 | 0.52/0.48/0.55/0.11 | 0.19/0.7/0.82/1.00 | 0.52/0.40/0.40/0.47 | 0.67/0.52/0.52/0.45 |
| 1 d | 0.33/0.39/0.41/0.43 | 0.25/0.41/0.43/0.45 | 0.28/0.31/0.32/0.36 | 0.34/0.34/0.27/0.21 | 0.55/0.58/0.58/0.51 | 0.36/0.27/0.25/0.23 | 0.48/0.41/0.30/0.37 | |
| CSI | 3 h | 0.32/0.27/0.21/0.08 | — | 0.32/0.24/0.15/0.06 | 0.08/0.06/0.05/0.03 | 0.04/0.00/0.00/0.00 | 0.40/0.28/0.18/0.04 | 0.26/0.26/0.13/0.02 |
| 1 d | 0.54/0.52/0.43/0.32 | 0.43/0.45/0.41/0.33 | 0.48/0.43/0.39/0.28 | 0.48/0.44/0.39/0.33 | 0.34/0.00/0.00/0.00 | 0.55/0.53/0.46/0.30 | 0.44/0.55/0.50/0.37 |
|
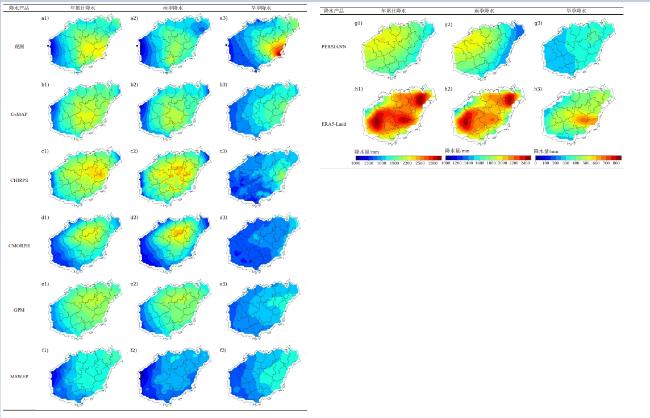
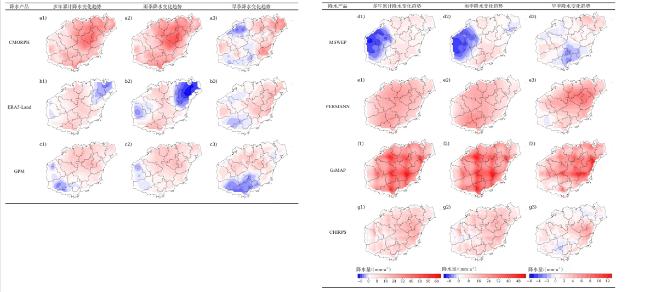
图3 2016—2020年多套降水产品在海南岛的多时间尺度降水空间分布 Fig.3 Spatial distribution of precipitation at multiple temporal scales over Hainan Island using various precipitation products during 2016-2020 |
图4 2001—2020年多套降水产品在海南岛多尺度降水变化趋势的空间分布对比 Fig.4 Comparison of spatial distribution of multi-scale precipitation trends in Hainan Island for multiple sets of precipitation products, 2001-2020 |

1 http://data.cma.cn//
2 https://figshare.com/articles/dataset/A_new_daily_gridded_precipitation_dataset_based_on_gauge_observations_across_mainland_China/2143 2123/4
李世禧:收集、整理与分析数据,文稿撰写;
白 磊:确定论文选题,对全文进行审阅与修改;
廖玮杰:整理数据,分析数据;
尚 明:数据处理;
郭建超、施晨晓、杨 岳:论文修改指导。
|
Bai L, Shi C, Li L, Yang Y, and Wu J. 2018. Accuracy of CHIRPS Satellite-Rainfall Products over Mainland China. Remote Sensing, 10(3): 362.
|
|
Bai L, Wen Y, Shi C, Yang Y, Zhang F, Wu J, Gu J, Pan Y, Sun S, and Meng J. 2020. Which Precipitation Product Works Best in the Qinghai-Tibet Plateau, Multi-Source Blended Data, Global/Regional Reanalysis Data, or Satellite Retrieved Precipitation Data?. Remote Sensing, 12(4): 683.
|
|
Beck H E, Van Dijk A I, Levizzani V, Schellekens J, Miralles D G, Martens B, and De Roo A. 2017. MSWEP: 3-Hourly 0.25 Global Gridded Precipitation (1979‒2015) by Merging Gauge, Satellite, and Reanalysis Data. Hydrology and Earth System Sciences, 21(1): 589-615.
|
|
陈亚玲,文军,杨传国,龙银平,李光伟,贾何佳,刘正. 2024. 不同降水产品及WRF-Hydro模式在黄河源区的适用性分析. 大气科学,48(3):923-937.
Chen Yaling, Wen Jun, Yang Chuan'guo, Long Yinping, Li Guangwei, Jia Hejia, and Liu Zheng. 2024. Applicability Analysis of Different Precipitation Products and the WRF-Hydro Model in the Source Region of the Yellow River. Chinese Journal of Atmospheric Sciences, 48(3): 923-937.
|
|
Funk C, Peterson P, Landsfeld M, Pedreros D, Verdin J, Shukla S, Husak G, Rowland J, Harrison L, Hoell A, and Michaelsen J. 2015. The Climate Hazards Infrared Precipitation with Stations—A New Environmental Record for Monitoring Extremes. Scientific Data, 2(1): 1-21.
|
|
Guo B, Xu T, Yang Q, Zhang J, Dai Z, Deng Y, and Zou J. 2023. Multiple Spatial and Temporal Scales Evaluation of Eight Satellite Precipitation Products in a Mountainous Catchment of South China. Remote Sensing, 15(5): 1373.
|
|
Huffman G J, Bolvin D T, Nelkin E J, Wolff D B, Adler R F, Gu G, Hong Y, Bowman K P, and Stocker E F. 2007. The TRMM Multisatellite Precipitation Analysis (TMPA): Quasi-Global, Multiyear, Combined-Sensor Precipitation Estimates at Fine Scales. Journal of Hydrometeorology, 8(1): 38-55.
|
|
Han J, Miao C, Gou J, Zheng H, Zhang Q, and Guo X. 2023. A New Daily Gridded Precipitation Dataset Based on Gauge Observations across Mainland China. Earth System Science Data Discussions, 15: 3147-3161.
|
|
Hou A Y, Kakar R K, Neeck S, Azarbarzin A A, Kummerow C D, Kojima M, Oki R, Nakamura K, and Iguchi T. 2014. The Global Precipitation Measurement Mission. Bulletin of the American Meteorological Society, 95(5): 701-22 .
|
|
Joyce R J, Janowiak J E, Arkin P A, and Xie P. 2004. CMORPH: A Method that Produces Global Precipitation Estimates from Passive Microwave and Infrared Data at High Spatial and Temporal Resolution. Journal of Hydrometeorology, 5(3): 487-503.
|
|
Kendall M A and Stuart A. 1961. The Advanced Theory of Statistics. London: Griffin Education.
|
|
刘松楠,汪君,王会军. 2022. 高分辨率卫星对“21·7”河南特大暴雨监测能力分析. 气象学报,80(5):765-776.
Liu Songnan, Wang Jun, and Wang Huijun. 2022. Analysis of High-Resolution Satellite Monitoring Capability for the "21·7" Severe Rainstorm in Henan Province, China. Acta Meteorologica Sinica, 80(5): 765-776.
|
|
Lavers D A, Simmons A, Vamborg F, and Rodwell M J. 2022. An Evaluation of ERA5 Precipitation for Climate Monitoring. Quarterly Journal of the Royal Meteorological Society, 148(748): 3152-3165.
|
|
Li Y, Wang W, Wang G, and Yu S. 2021. Evaluation and Hydrological Application of a Data Fusing Method of Multi-Source Precipitation Products-A Case Study over Tuojiang River Basin. Remote Sensing, 13(13): 2630.
|
|
Li X, He X, Li X, Du Y, Yang G, Li D, and Xu W. 2022. Spatiotemporal Evaluation and Estimation of Precipitation of Multi-Source Precipitation Products in Arid Areas of Northwest China: A Case Study of Tianshan Mountains. Water, 14(16): 2566.
|
|
Lei H, Zhao H, and Ao T. 2022. Ground Validation and Error Decomposition for Six State-of-the-Art Satellite Precipitation Products over Mainland China. Atmospheric Research, 269: 106017.
|
|
李伟光,张京红,刘少军,车秀芬,陈小敏,邹海平. 2022. 海南岛干旱的气象特征及监测指标. 热带生物学报,13(4):324-330.
Li Weiguang, Zhang Jinghong, Liu Shaojun, Chen Xiufen, Chen Xiaomin, and Zou Haiping. 2022. Meteorological Characteristics and Monitoring Index of Drought in Hainan Island. Journal of Tropical Biology, 13(4): 324-330.
|
|
刘洁,夏军,邹磊,王强,余江游. 2018. 多卫星遥感降水数据在塔里木河流域的适用性分析.南水北调与水利科技,16(5):1-8.
Liu Jie, Xia Jun, Zou Lei, Wang Qiang, and Yu Jiangyou. 2018. Applicability Analysis of Multi-Satellite Remote Sensing Precipitation Data in the Tarim River Basin. South-to-North Water Diversion and Water Science & Technology, 16(5): 1-8.
|
|
廖荣伟,张冬斌,沈艳. 2015. 6种卫星降水产品在中国区域的精度特征评估.气象,(8):970-979.
Liao Rongwei, Zhang Dongbin, and Shen Yan. 2015. Validation of Six Satellite-Derived Rainfall Estimates over China. Meteorological Monthly, (8): 970-979.
|
|
Maggioni V, Sapiano M R P, and Adler R F. 2016. Estimating Uncertainties in High-Resolution Satellite Precipitation Products: Systematic or Random Error? Journal of Hydrometeorology, 17(4): 1119-1129.
|
|
Muñoz-Sabater J, Dutra E, Agustí-Panareda A, Albergel C, Arduini G, Balsamo G, Boussetta S, Choulga M, Harrigan S, Hersbach H, Martens B, Miralles D G, Piles M, Rodríguez-Fernández N J, Zsoter E, Buontempo C, and Thépaut J. 2021. ERA5-Land: A State-Of-The-Art Global Reanalysis Dataset for Land Applications. Earth System Science Data, 13(9): 4349-4383.
|
|
Okamoto K I, Ushio T, Iguchi T, Takahashi N, and Iwanami K. 2005. The Global Satellite Mapping of Precipitation (GsMAP) Project. IEEE, 5: 3414-3416.
|
|
Qi W, Yong B, and Gourley J J. 2021. Monitoring the Super Typhoon Lekima by GPM-Based Near-Real-Time Satellite Precipitation Estimates. Journal of Hydrology, 603: 126968.
|
|
Qin J, Li W, Wen J, Qiu C, Sun W, Fang Q, Xu M, and Tan J. 2018. Accuracy Evaluation of Two High-Resolution Satellite-Based Rainfall Products: TRMM 3B42V7 and CMORPH in Shanghai. Water, 10(1): 40.
|
|
任阳阳,尚明,白磊,张潇文,宋宏利,吴复柱. 2021. 多种降水产品在京津冀的适用性评估. 水文,41(5):13-19.
Ren Yangyang, Shang Ming, Bai Lei, Zhang Xiaowen, Song Hongli, and Wu Fuzhu. 2021. Applicability Assessment of Multiple Precipitation Products in Beijing-Tianjin-Hebei Region. Hydrology, 41(5): 13-19.
|
|
Sorooshian S, Hsu K, Gao X, Gupta H V, Imam B, and Braithwaite D. 2000. Evaluation of PERSIANN System Satellite-Based Estimates of Tropical Rainfall. Bulletin of the American Meteorological Society, 81(9): 2035-2046.
|
|
Tan M L, Gassman P W, and Cracknell A P. 2017. Assessment of Three Long-Term Gridded Climate Products for Hydro-Climatic Simulations in Tropical River Basins. Water (Basel) , 9: 229.
|
|
Tang G, Zeng Z, Ma M, Liu R,Wen Y, and Hong Y. 2017. Can Near-Real-Time Satellite Precipitation Products Capture Rainstorms and Guide Flood Warning for the 2016 Summer in South China? IEEE Geoscience and Remote Sensing Letters, 14(8): 1208-1212.
|
|
Wang D, Wang X, Liu L, Wang D, Huang H, and Pan C. 2016. Evaluation of CMPA Precipitation Estimate in the Evolution of Typhoon-Related Storm Rainfall in Guangdong, China. Journal of Hydroinformatics, 18(6): 1055-1068.
|
|
Wang W, Lin H, Chen N, and Chen Z. 2021a. Evaluation of Multi-Source Precipitation Products over the Yangtze River Basin. Atmospheric Research, 249: 105287.
|
|
Wang Q, Xia J, She D, Zhang X, Liu J, and Zhang Y. 2021b. Assessment of Four Latest Long-Term Satellite-Based Precipitation Products in Capturing the Extreme Precipitation and Streamflow across a Humid Region of Southern China. Atmospheric Research, 257: 105554.
|
|
Wilks D S. 2011. Statistical Methods in the Atmospheric Sciences. New York: Academic Press.
|
|
Wu X and Zhao N. 2022. Evaluation and Comparison of Six High-Resolution Daily Precipitation Products in Mainland China. Remote Sensing, 15(1): 223.
|
|
熊立华,尹家波,郭生练. 2023. 极端水文事件对气候变化的热力学响应研究进展与评价. 武汉大学学报(工学版),56(12):1432-1444.
Xiong Lihua, Yin Jiabo, and Guo Shenglian. 2023. Progress and Evaluation of the Thermodynamic Response of Extreme Hydrological Events to Climate Change. Journal of Wuhan University (Engineering Edition), 56(12): 1432-1444.
|
|
许格希,郭泉水,牛树奎,裴顺祥,朱莉,朱妮妮. 2013. 近50 a来海南岛不同气候区气候变化特征研究. 自然资源学报,28(5):799-810.
Xu Gexi, Guo Quanshui, Niu Shukui, Pei Shunxiang, Zhu Li, and Zhu Nini. 2013. Research on Climate Change Characteristics of Different Climatic Regions in Hainan Island in the Last 50 Years. Journal of Natural Resources, 28(5): 799-810.
|
|
杨婷. 2023. 多源气象降水数据在云贵高原地区的适用性研究. 昆明:昆明理工大学.
Yang Ting. 2023. Study on the Applicability of Multi-source Meteorological Precipitation Data in the Yunnan-Guizhou Plateau Area. Kunming: Kunming University of Science and Technology.
|
|
曾岁康,雍斌. 2019. 全球降水计划IMERG和GsMAP反演降水在四川地区的精度评估. 地理学报,74(7):1305-1318.
Zeng Suikang and Yong Bin. 2019. Accuracy Assessment of Global Precipitation Products IMERG and GsMAP in Sichuan Region. Acta Geographica Sinica, 74(7): 1305-1318.
|
|
Zhu H, Chen S, Li Z, Gao L, and Li X. 2022. Comparison of Satellite Precipitation Products: IMERG and GsMAP with Rain Gauge Observations in Northern China. Remote Sensing, 14(19): 4748.
|
|
中国气象局. 2017. 全国智能网格气象预报业务规定(试行)(气预函[2017]36号). 北京:中国气象局
China Meteorological Administration. 2017. Regulations on National Intelligent Grid Weather Forecasting (Trial) (Qi Yu Han [2017] No.36). Beijing: China Meteorological Administration.
|
/
| 〈 |
|
〉 |