
Influence of Renewable Energy Development on the Export Patterns of China's High Energy-Intensive Products
Received date: 2024-09-06
Revised date: 2024-12-16
Online published: 2025-09-22
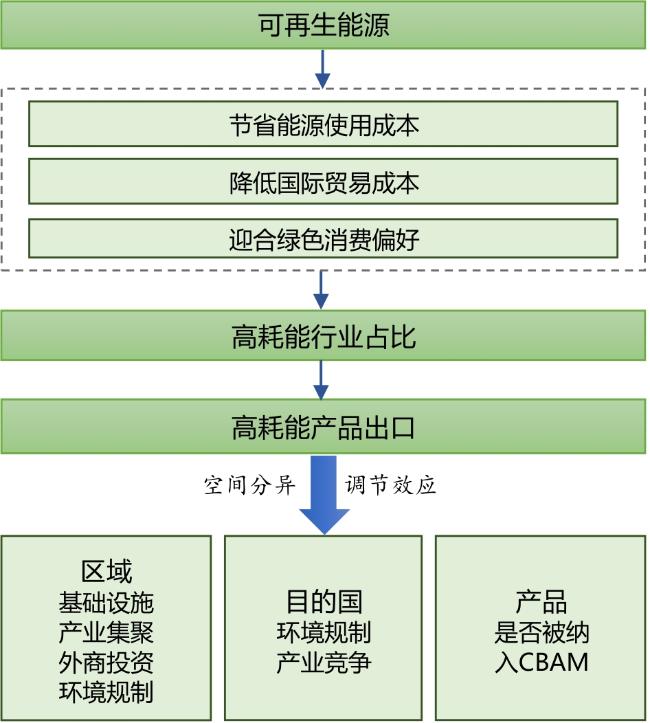
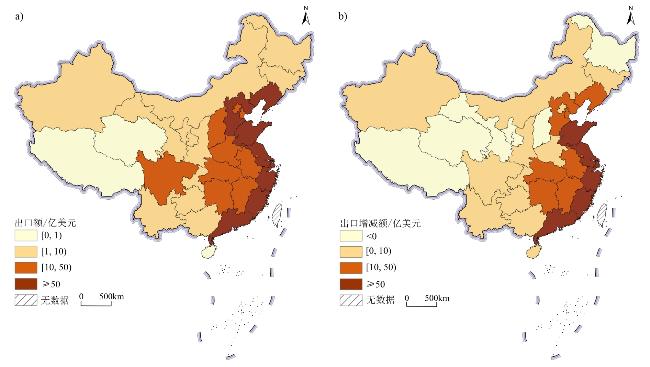
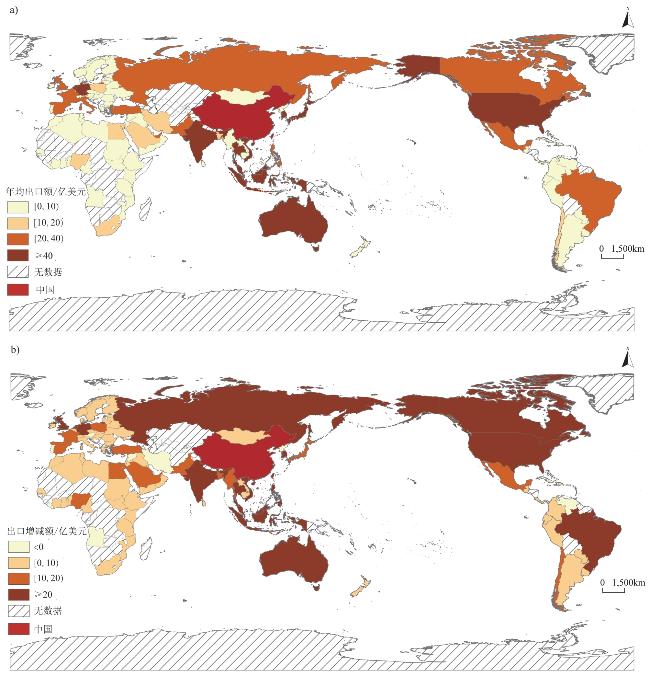
Renewable energy development is critical for advancing energy transitions and addressing climate change, both of which will likely trigger substantial transformations in industrial geography and trade patterns. Previous studies have investigated the impacts of renewable energy on manufacturing sectors from both production and consumption perspectives. In addition, the trade patterns of energy-intensive products have been analyzed in terms of industrial relocation, embodied carbon flows, and carbon leakage mechanisms. However, few studies have explored how renewable energy influences the export of high energy-intensive products. Based on province-product-destination trade data from 2011 to 2020, we used spatial analytical methods to characterize the geographical distribution of China's energy-intensive product exports across origins and destinations. We then applied fixed-effect regression models to empirically assess the impacts of provincial-level renewable energy on these exports. The results indicate that China's renewable energy generation is geographically concentrated in the northwestern provinces, whereas energy-intensive manufacturing exports are predominantly located in eastern coastal regions, revealing a spatial mismatch between the energy supply and industrial demand. While China's high energy-intensive exports remain predominantly destined for developed economies, the growth momentum in recent years has been increasingly propelled by demand from developing countries. In addition, renewable energy development promoted the export of high-energy-intensive products by increasing the proportion of energy-intensive industries in provincial industrial structures. Renewable energy development in China's eastern and central provinces promoted high energy-intensive product exports, whereas no substantial effect was observed in the western provinces. Superior grid infrastructure, stringent low-carbon policies, and higher foreign direct investment levels all enhanced the positive impact of renewable energy on energy-intensive exports, whereas greater agglomeration of energy-intensive industries demonstrated no favorable effect. Carbon mitigation policies in the destination countries strengthened the positive relationship between China's renewable energy and energy-intensive exports, whereas greater renewable energy deployment in these countries exerted a negative moderating effect. Compared with other high energy-intensive products, those subject to the EU's Carbon Border Adjustment Mechanism (CBAM) derived greater benefits from renewable energy development. This study contributes to the literature by establishing a spatial framework for understanding how renewable energy development affects energy-intensive product exports. In addition, this study clarifies the moderating effects of multidimensional factors at the provincial, product, and destination country levels, thereby providing a knowledge foundation for energy-intensive industries to use renewable energy for their green transitions while maintaining export competitiveness. This study demonstrates that the effects of renewable energy on energy-intensive product exports across provinces, product categories, and destination countries are heterogeneous. To maintain export competitiveness, three essential measures must be implemented: electricity market mechanisms and infrastructure improvement, clarification of destination countries' carbon reduction policies, and renewable energy-integrated production model development for energy-intensive industries.
Tianli Gu , Canfei He , Xiangdong Zhu . Influence of Renewable Energy Development on the Export Patterns of China's High Energy-Intensive Products[J]. Tropical Geography, 2025 : 1 -14 . DOI: 10.13284/j.cnki.rddl.20240590
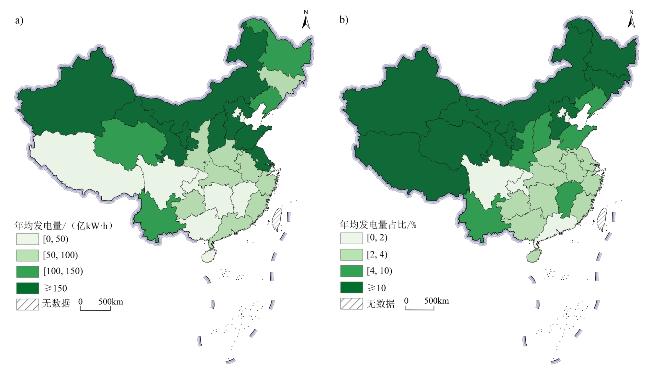
图2 2011—2020年中国可再生能源发电量空间格局 [各省年均风电和光伏发电总量(a)及其占比(b)] Fig.2 Spatial patterns of provincial renewable energy generation (2011—2020) [annual electricity generation from wind and solar PV power (a) and its percentage share of total generation (b) by province] |
表1 实证模型变量定义与数据来源Table 1 Variable definitions and data sources for the empirical model |
| 变量类型 | 变量 | 变量符号 | 解释 | 数据来源 |
|---|---|---|---|---|
| 因变量 | 高耗能产品出口额 | Yijpt | 省份i在t年向国家j出口高耗能产品p的数额 | 中国海关贸易数据库 |
| 自变量 | 可再生能源 | RE it | 省份i在t年风电和光伏发电量占发电总量比例 | 中国电力企业联合会 |
| 中介变量 | 高耗能产品结构 | HC ijt | 省份i在t年向国家j出口高耗能产品的占比 | 中国海关贸易数据 |
| 省级层面 | 电网密度 | Grid it | 省份i在t年的输电线路回路长度/行政区域土地面积 | 中国电力企业联合 |
| 产业集聚 | RCA ipt | 省份i在t年出口产品p的显著性比较优势 | 中国海关贸易数据 | |
| 外资利用水平 | FDI it | 省份i在t年实际使用外资数额与GDP的比值 | 中国经济数据库 | |
| 省份经济发展水平 | GDPPCP it | 省份i在t年的人均GDP | 各省统计年鉴 | |
| 省份对外开放程度 | Open it | 省份i在t年的进出口额占GDP比例 | 中国科技数据库 | |
| 省份碳强度 | CEIP it | 省份i在t年的碳强度 | 中国碳核算数据库 | |
| 目的国层面 | 目的国碳强度 | CEID jt | 国家j在t年的碳强度 | 气候观察组织 |
| 可再生能源发电量 | Clean jt | 国家j在t年风电和光伏发电量之和 | 能源研究所 | |
| 目的国经济发展水平 | GDPPCD jt | 国家j在t年的人均GDP | 世界银行 | |
| 省份-目的国贸易联系 | Import ijt | 国家j在t年从省份i进口全部产品总额 | 中国海关贸易数据 | |
| 产品层面 | 是否被纳入碳关税 | CBAM p | 产品是否被纳入欧盟碳关税 | Magacho等(2024) |
表2 可再生能源对高耗能产品出口的影响Table 2 The impact of renewable energy on the export of high-energy-intensive products |
| 变量 | 模型1 | 模型2 | 模型3 | 模型4 | 模型5 | 模型6 | 模型7 |
|---|---|---|---|---|---|---|---|
| Yijpt | Yijpt | HC ijt | Yijpt | 东部 | 中部 | 西部 | |
| Yijpt | Yijpt | Yijpt | |||||
| RE it | 0.045***(0.001) | 0.177***(0.004) | 0.042***(0.001) | 0.046***(0.001) | 0.023***(0.002) | -0.003(0.003) | |
| RET it | 0.133***(0.003) | ||||||
| HC ijt | 0.019***(0.000 2) | ||||||
| Open it | -0.600***(0.016) | -0.600***(0.017) | -7.436***(0.066) | -0.455***(0.016) | -0.099***(0.020) | 3.167***(0.238) | -1.171***(0.179) |
| GDPPCP it | 0.194***(0.015) | -0.046**(0.020) | -1.202***(0.059) | 0.218***(0.015) | 0.559***(0.020) | 0.165***(0.031) | 0.246***(0.036) |
| Import ijt | 0.648***(0.003) | 0.649***(0.003) | -2.123***(0.014) | 0.690***(0.003) | 0.788***(0.004) | 0.462***(0.008) | 0.372***(0.009) |
| GDPPCD jt | 0.689***(0.019) | 0.683***(0.019) | 4.651***(0.077) | 0.599***(0.019) | 0.604***(0.021) | 0.717***(0.059) | 1.107***(0.080) |
| 常数项 | -10.20***(0.196) | -8.890***(0.224) | 30.88***(0.790) | -10.80***(0.195) | -16.20***(0.243) | -6.383***(0.527) | -8.370***(0.664) |
| 省份固定效应 | 控制 | 控制 | 控制 | 控制 | 控制 | 控制 | 控制 |
| 产品固定效应 | 控制 | 控制 | 控制 | 控制 | 控制 | 控制 | 控制 |
| 国家固定效应 | 控制 | 控制 | 控制 | 控制 | 控制 | 控制 | 控制 |
| 样本量/个 | 1 489 178 | 1 489 178 | 1 489 178 | 1 489 178 | 1 208 705 | 182 739 | 97 714 |
| R 2 | 0.710 | 0.710 | 0.801 | 0.712 | 0.717 | 0.684 | 0.685 |
|
表3 省份异质性分析Table 3 Provincial heterogeneity analysis |
| 变量 | 模型1 | 模型2 | 模型3 | 模型4 | 模型5 | 模型6 | 模型7 | 模型8 |
|---|---|---|---|---|---|---|---|---|
| Yijpt | Yijpt | Yijpt | Yijpt | Yijpt | Yijpt | Yijpt | Yijpt | |
| RE it | 0.027*** (0.001) | -0.020*** (0.002) | 0.059*** (0.001) | 0.100*** (0.002) | 0.044*** (0.001) | 0.040*** (0.001) | 0.060*** (0.001) | 0.090*** (0.001) |
| Grid it | 1.378***(0.039) | 0.324***(0.051) | ||||||
| RE it ×Grid it | 0.087***(0.003) | |||||||
| RCA ipt | 0.415***(0.007) | 0.436***(0.007) | ||||||
| RE it ×RCA ipt | -0.023***(0.001) | |||||||
| FDI it | -1.202*** (0.124) | -1.999***(0.170) | ||||||
| RE it ×FDI it | 0.258***(0.038) | |||||||
| CEIP it | 14.825***(0.408) | 17.485***(0.411) | ||||||
| RE it ×CEIP it | -1.140***(0.024) | |||||||
| Open it | -0.467*** (0.017) | -0.396*** (0.017) | -0.256*** (0.017) | -0.243*** (0.017) | -0.574*** (0.017) | -0.561*** (0.017) | -0.581***(0.016) | -0.548*** (0.016) |
| GDPPCP it | -0.023 (0.016) | 0.148*** (0.017) | 0.337*** (0.015) | 0.238*** (0.015) | 0.190*** (0.015) | 0.179*** (0.015) | 0.386***(0.016) | 0.329*** (0.016) |
| Import ijt | 0.658*** (0.003) | 0.664*** (0.003) | 0.672*** (0.003) | 0.660*** (0.003) | 0.650***(0.003) | 0.649***(0.003) | 0.636***(0.003) | 0.628*** (0.003) |
| GDPPCD jt | 0.705*** (0.019) | 0.724*** (0.019) | 0.675*** (0.019) | 0.705*** (0.019) | 0.677*** (0.019) | 0.680*** (0.019) | 0.740***(0.019) | 0.771*** (0.019) |
| Constant | -9.467*** (0.197) | -10.71*** (0.200) | -12.61*** (0.199) | -11.77*** (0.201) | -10.05*** (0.196) | -9.951*** (0.197) | -12.52***(0.206) | -12.21*** (0.206) |
| 省份固定效应 | 控制 | 控制 | 控制 | 控制 | 控制 | 控制 | 控制 | 控制 |
| 产品固定效应 | 控制 | 控制 | 控制 | 控制 | 控制 | 控制 | 控制 | 控制 |
| 国家固定效应 | 控制 | 控制 | 控制 | 控制 | 控制 | 控制 | 控制 | 控制 |
| 样本量/个 | 1 489 178 | 1 489 178 | 1 489 178 | 1 489 178 | 1 489 168 | 1 489 168 | 1 489 158 | 1 489 158 |
| R 2 | 0.710 | 0.710 | 0.711 | 0.711 | 0.710 | 0.710 | 0.710 | 0.711 |
表4 目的国异质性分析Table 4 Heterogeneity analysis of destination countries |
| 变量 | 模型1 | 模型2 | 模型3 | 模型4 | 模型5 | 模型6 |
|---|---|---|---|---|---|---|
| Yijpt | Yijpt | Yijpt | Yijpt | Yijpt | Yijpt | |
| RE it | 0.046***(0.001) | 0.047***(0.001) | 0.043***(0.001) | 0.049***(0.001) | 0.039***(0.001) | 0.038***(0.001) |
| CEID it | -0.061***(0.007) | -0.054***(0.008) | ||||
| RE it ×CEID it | -0.003***(0.001) | |||||
| Clean jt | 0.010***(0.001) | 0.023***(0.001) | ||||
| RE it ×Clean jt | -0.002***(0.000 1) | |||||
| CBAM p | 0.603***(0.007) | 0.540***(0.010) | ||||
| RE it ×CBAM p | 0.018***(0.002) | |||||
| Open it | -0.598***(0.016) | -0.598***(0.016) | -0.595***(0.016) | -0.578***(0.016) | -0.175***(0.026) | -0.171***(0.026) |
| GDPPCP it | 0.200***(0.015) | 0.199***(0.015) | 0.155***(0.015) | 0.104***(0.015) | 0.302***(0.023) | 0.308***(0.023) |
| Import ijt | 0.645***(0.003) | 0.645***(0.003) | 0.655***(0.003) | 0.655***(0.003) | 0.301***(0.003) | 0.301***(0.003) |
| GDPPCD jt | 0.682***(0.020) | 0.687***(0.020) | 0.692***(0.019) | 0.686***(0.019) | 0.800***(0.030) | 0.798***(0.030) |
| Constant | -10.09***(0.202) | -10.13***(0.203) | -10.02***(0.196) | -9.528***(0.198) | -5.351***(0.313) | -5.371***(0.313) |
| 省份固定效应 | 控制 | 控制 | 控制 | 控制 | 控制 | 控制 |
| 产品固定效应 | 控制 | 控制 | 控制 | 控制 | 未控制 | 未控制 |
| 国家固定效应 | 控制 | 控制 | 控制 | 控制 | 控制 | 控制 |
| 样本量/个 | 1 483 429 | 1 483 429 | 1 489 178 | 1 489 178 | 1 488 372 | 1 488 372 |
| R 2 | 0.71 | 0.71 | 0.71 | 0.71 | 0.116 | 0.116 |
1 https://www.climatewatchdata.org/
2 https://www.ceads.net.cn/data/province/
3 https://www.ceicdata.com/zh-hans/products/china-economic-database
4 https://www.epsnet.com.cn/
5 https://www.energyinst.org/statistical-review/
6 https://data.worldbank.org.cn/indicator
|
Beylot A, Guyonnet D, Muller S, Vaxelaire S, and Villeneuve J. 2019. Mineral Raw Material Requirements and Associated Climate-Change Impacts of the French Energy Transition by 2050. Journal of Cleaner Production, 208: 1198-1205.
|
|
Bogdanov D, Gulagi A, Fasihi M, and Breyer C. 2021. Full Energy Sector Transition Towards 100% Renewable Energy Supply: Integrating Power, Heat, Transport and Industry Sectors Including Desalination. Applied Energy, 283: 116273.
|
|
陈伟,蒋益飞,刘志高. 2024. 全球镍贸易网络演化及其韧性研究. 世界地理研究,34(1):1-15.
Chen Wei, Jiang Yifei, and Liu Zhigao. 2024. Evolution and Resilience of the Global Nickel Trade Network. World Regional Studies, 34(1): 1-15.
|
|
Das K C and Mahalik M K. 2023. Renewable Energy Use and Export Performance of Manufacturing Firms: Panel Evidence from Six Industries in India. Energy Economics, 125: 106894.
|
|
Duranton G and Puga D. 2004. Micro-Foundations of Urban Agglomeration Economies. Handbook of Regional and Urban Economics, 4: 2063-2117.
|
|
封亦代,刘耀彬,程风雨. 2023. 中国城市绿色全要素能源效率的区域差异及空间收敛. 地理研究,42(9):2343-2368.
Feng Yidai, Liu Yaobin, and Cheng Fengyu. 2023. Regional Differences and Spatial Convergence of Green Total-Factor Energy Efficiency in Chinese Cities. Geographical Research, 42(9): 2343-2368.
|
|
Gong P, Tang B, Xiao Y, Lin G, and Liu J. 2016. Research on China Export Structure Adjustment: An Embodied Carbon Perspective. Natural Hazards, 84: 129-151.
|
|
Hao Y. 2022. The Relationship between Renewable Energy Consumption, Carbon Emissions, Output, and Export in Industrial and Agricultural Sectors: Evidence from China. Environmental Science and Pollution Research, 29(42): 63081-63098.
|
|
He K and Hertwich E G. 2019. The Flow of Embodied Carbon Through the Economies of China, the European Union, and the United States. Resources, Conservation and Recycling, 145: 190-198.
|
|
黄永源,朱晟君,王少剑. 2020. 基于制度背景与经济活动交互效应的广东省PM2.5污染驱动因素分析. 热带地理,40(1):74-87.
Huang Yongyuan, Zhu Shengjun, and Wang Shaojian. 2020. Driving Force behind PM2.5 Pollution in Guangdong Province Based on the Interaction Effect of Institutional Background and Socioeconomic Activities. Tropical Geography, 40(1): 74-87.
|
|
Ilechukwu N and Lahiri S. 2022. Renewable-Energy Consumption and International Trade. Energy Reports, 8: 10624-10629.
|
|
金煜,陈钊,陆铭. 2006. 中国的地区工业集聚:经济地理、新经济地理与经济政策. 经济研究,(4):79-89.
Jin Yu, Chen Zhao, and Lu Ming. 2006. Industry Agglomeration in China: Economic Geography, New Economic Geography and Policy. Economic Research Journal, (4): 79-89.
|
|
Khan S A R, Yu Z, Belhadi A, and Mardani A. 2020. Investigating the Effects of Renewable Energy on International Trade and Environmental Quality. Journal of Environmental Management, 272: 111089.
|
|
Li F, Zhang J, and Li X. 2022. Research on Supporting Developing Countries to Achieve Green Development Transition: Based on the Perspective of Renewable Energy and Foreign Direct Investment. Journal of Cleaner Production, 372: 133726.
|
|
Li W, Liu X, and Lu C. 2023. Analysis of China's Steel Response Ways to EU CBAM Policy Based on Embodied Carbon Intensity Prediction. Energy, 282: 128812.
|
|
李小平,卢现祥. 2010. 国际贸易、污染产业转移和中国工业CO2排放. 经济研究,45(1):15-26.
Li Xiaoping and Lu Xianxiang. 2010. International Trade, Pollution Industry Transfer and Chinese Industries' CO2 Emissions. Economic Research Journal, 45(1): 15-26.
|
|
Lin B and Zhao H. 2024. Asymmetric Trade Barriers and CO2 Emissions in Carbon-Intensive Industry. Journal of Environmental Management, 349: 119547.
|
|
Lipiäinen S, Kuparinen K, Sermyagina E, and Vakkilainen E. 2022. Pulp and Paper Industry in Energy Transition: Towards Energy-Efficient and Low Carbon Operation in Finland and Sweden. Sustainable Production and Consumption, 29: 421-431.
|
|
刘逸,杨伟聪. 2019. 全球生产网络视角下珠三角区域经济的战略耦合与产业升级. 热带地理,39(2):155-169.
Liu Yi and Yang Weicong. 2019. Strategic Coupling and Industrial Upgrading in the Pearl River Delta: A Global Production Network Perspective. Tropical Geography, 39(2): 155-169.
|
|
马诗萍,刘倩倩,张文忠. 2022. 空间视角下的能源-经济-环境关系研究进展与展望. 地理科学进展,41(8):1530-1541.
Ma Shiping, Liu Qianqian, and Zhang Wenzhong. 2022. Progress and Prospect of Energy-Economy-Environment Nexus Research from a Spatial Perspective. Progress in Geography, 41(8): 1530-1541.
|
|
Magacho G, Espagne E, and Godin A. 2024. Impacts of the CBAM on EU Trade Partners: Consequences for Developing Countries. Climate Policy, 24(2): 243-259.
|
|
Nadeem T B, Siddiqui M, Khalid M, and Asif M. 2023. Distributed Energy Systems: A Review of Classification, Technologies, Applications, and Policies. Energy Strategy Reviews, 48: 101096.
|
|
Opeyemi A, Uchenna E, Simplice A, and Evans O. 2019. Renewable Energy, Trade Performance and the Conditional Role of Finance and Institutional Capacity in Sub-Sahara African Countries. Energy Policy, 132: 490-498.
|
|
Sokolova Y, Davidson N, and Mariev O. 2024. Global Energy Transition and Foreign Environmental Regulations: Impacts on Russian Regions' Export Volumes. Journal of Environmental Management, 352: 120001.
|
|
Stadler K, Wood R, Bulavskaya T, Södersten C J, Simas M, Schmidt S, Usubiaga A, Acosta-Fernández J, Kuenen J, and Bruckner M. 2018. EXIOBASE 3: Developing a Time Series of Detailed Environmentally Extended Multi-Regional Input-Output Tables. Journal of Industrial Ecology, 22(3): 502-515.
|
|
Verpoort P C, Gast L, Hofmann A, and Ueckerdt F. 2024. Impact of Global Heterogeneity of Renewable Energy Supply on Heavy Industrial Production and Green Value Chains. Nature Energy, 9(4): 491-503.
|
|
王兵,吴英东,刘朋帅,陈思卿. 2022. 可再生能源发展影响因素区域异质性研究——基于生产—输送—消费全产业链视角. 北京理工大学学报(社会科学版),24(1):39-50.
Wang Bing, Wu Yingdong, Liu Pengshuai, and Chen Siqing. 2022. Regional Heterogeneity Governing Renewable Energy Development From the Perspective of Industrial Chain of Production, Transportation and Consumption. Journal of Beijing Institute of Technology(Social Sciences Edition), 24(1): 39-50.
|
|
王长建,张虹鸥,汪菲,叶玉瑶,吴康敏,徐茜,杜志威. 2018. 城市能源消费碳排放特征及其机理分析——以广州市为例. 热带地理,38(6):759-770.
Wang Changjian, Zhang Hong’ou, Wang Fei, Ye Yuyao, Wu Kangmin, Xu Qian, and Du Zhiwei. 2018. Features and Influencing Factors of Energy-Related Carbon Emissions in Mega City: A Case Study of Guangzhou. Tropical Geography, 38(6): 759-770.
|
|
王谋,吉治璇,康文梅,陈迎,张莹. 2021. 欧盟“碳边境调节机制”要点、影响及应对. 中国人口·资源与环境,31(12):45-52.
Wang Mou, Ji Zhixuan, Kang Wenmei, Chen Ying, and Zhang Ying. 2021. Key Points and Impact of EU's Carbon Border Adjustment Mechanism and China's Responses. China Population, Resources and Environment, 31(12): 45-52.
|
|
Wang Y, Xu C, and Yuan P. 2022. Is There a Grid-Connected Effect of Grid Infrastructure on Renewable Energy Generation? Evidence from China's Upgrading Transmission Lines. Energy & Environment, 33(5): 975-995.
|
|
相晨曦,陈占明,郑新业. 2021. 环境外部性对出口结构和贸易政策选择的影响——基于中国高耗能产业的证据. 中国人口·资源与环境,31(6):45-56.
Xiang Chenxi, Chen Zhanming, and Zheng Xinye. 2021. Influence of Environmental Externalities on Export Structure and Trade Policies: Evidence from China's Energy-Intensive Industries. China Population, Resources and Environment, 31(6): 45-56.
|
|
Xie H, Yang D, Zhang K, and Yang L. 2023. Structural Evolutionary Analysis of the Embodied Net Carbon Transfer Network of Belt and Road Trade: From the Regional and Sectoral Perspectives. Environmental Science and Pollution Research, 30(18): 54205-54222.
|
|
薛松,屠俊明,杨素,张晓萱. 2015. 我国需求侧资源促进大规模间歇可再生能源并网消纳模式. 技术经济与管理研究,(7):82-86.
Xue Song, Tu Junming, Yang Su, and Zhang Xiaoxuan. 2015. Demand Side Resources Promoting Large-Scale Intermittent Renewable Energy Integration Mode in China. Journal of Technical Economics & Management, (7): 82-86.
|
|
Yang S, Zhu Z, Fu W, and Hu S. 2024. Tele-Connection of Embodied Carbon Emissions from Industries in China's Trade: A Complex Network Analysis. Journal of Environmental Management, 366: 121652.
|
|
杨宇,郭越,樊杰,刘毅. 2024. 能源地理研究的发展与展望. 地理学报,79(1):147-170.
Yang Yu, Guo Yue, Fan Jie, and Liu Yi. 2024. Geopolitics of the Energy Transition. Acta Geographica Sinica, 79(1): 147-170.
|
|
叶玉瑶,王景诗,吴康敏,杜志威,王洋,何淑仪,刘郑倩. 2020. 粤港澳大湾区建设国际科技创新中心的战略思考. 热带地理,40(1):27-39.
Ye Yuyao, Wang Jingshi, Wu Kangmin, Du Zhiwei, Wang Yang, He Shuyi, and Liu Zhengqian. 2020. Strategic Thinking Regarding Building an International Science and Technology Innovation Center in the Guangdong-Hong Kong-Macao Greater Bay Area. Tropical Geography, 40(1): 27-39.
|
|
张捷,赵秀娟. 2015. 碳减排目标下的广东省产业结构优化研究——基于投入产出模型和多目标规划模型的模拟分析. 中国工业经济,(6):68-80.
Zhang Jie and Zhao Xiujuan. 2015. The Optimization of Guangdong Province's Industrial Structure under the Objective of Carbon Emissions Reduction: A Simulating Analysis Based on Input-Output Model and Multi-Objective Programming Model. China Industrial Economics, (6): 68-80.
|
|
Zhang Q and Lin B. 2024. What Does Clean Energy Attract? Evidence from the Transfer Structure of Energy-Intensive Projects in China. Renewable Energy, 228: 120642.
|
|
中共中央. 2024. 中共中央关于进一步全面深化改革推进中国式现代化的决定. (2024-07-21)[2025-09-08]. https://www.gov.cn/zhengce/202407/content_6963770.htm.
The Communist Party of China Central Committee. 2024. Resolution of the Central Committee of the Communist Party of China on Further Deepening Reform Comprehensively to Advance Chinese Modernization. (2024-07-21) [2025-09-08]. https://www.gov.cn/zhengce/202407/content_6963770.htm.
|
|
朱向东,贺灿飞,朱晟君. 2019. 贸易保护如何改变中国光伏出口目的国格局? 地理研究,38(11):2565-2577.
Zhu Xiangdong, He Canfei, and Zhu Shengjun. 2019. How Does Protectionism Change the Pattern of the Destinations of Chinese Photovoltaic Export? Geographical Research, 38(11): 2565-2577.
|
/
| 〈 |
|
〉 |