
Characterization of Spatial and Temporal Coupling of Digital Economy and Carbon Emission in Yangtze River Delta Urban Agglomerations and the Influence Factors by Integrating GWRF and SHAP
Received date: 2025-07-29
Revised date: 2025-09-01
Online published: 2025-12-31
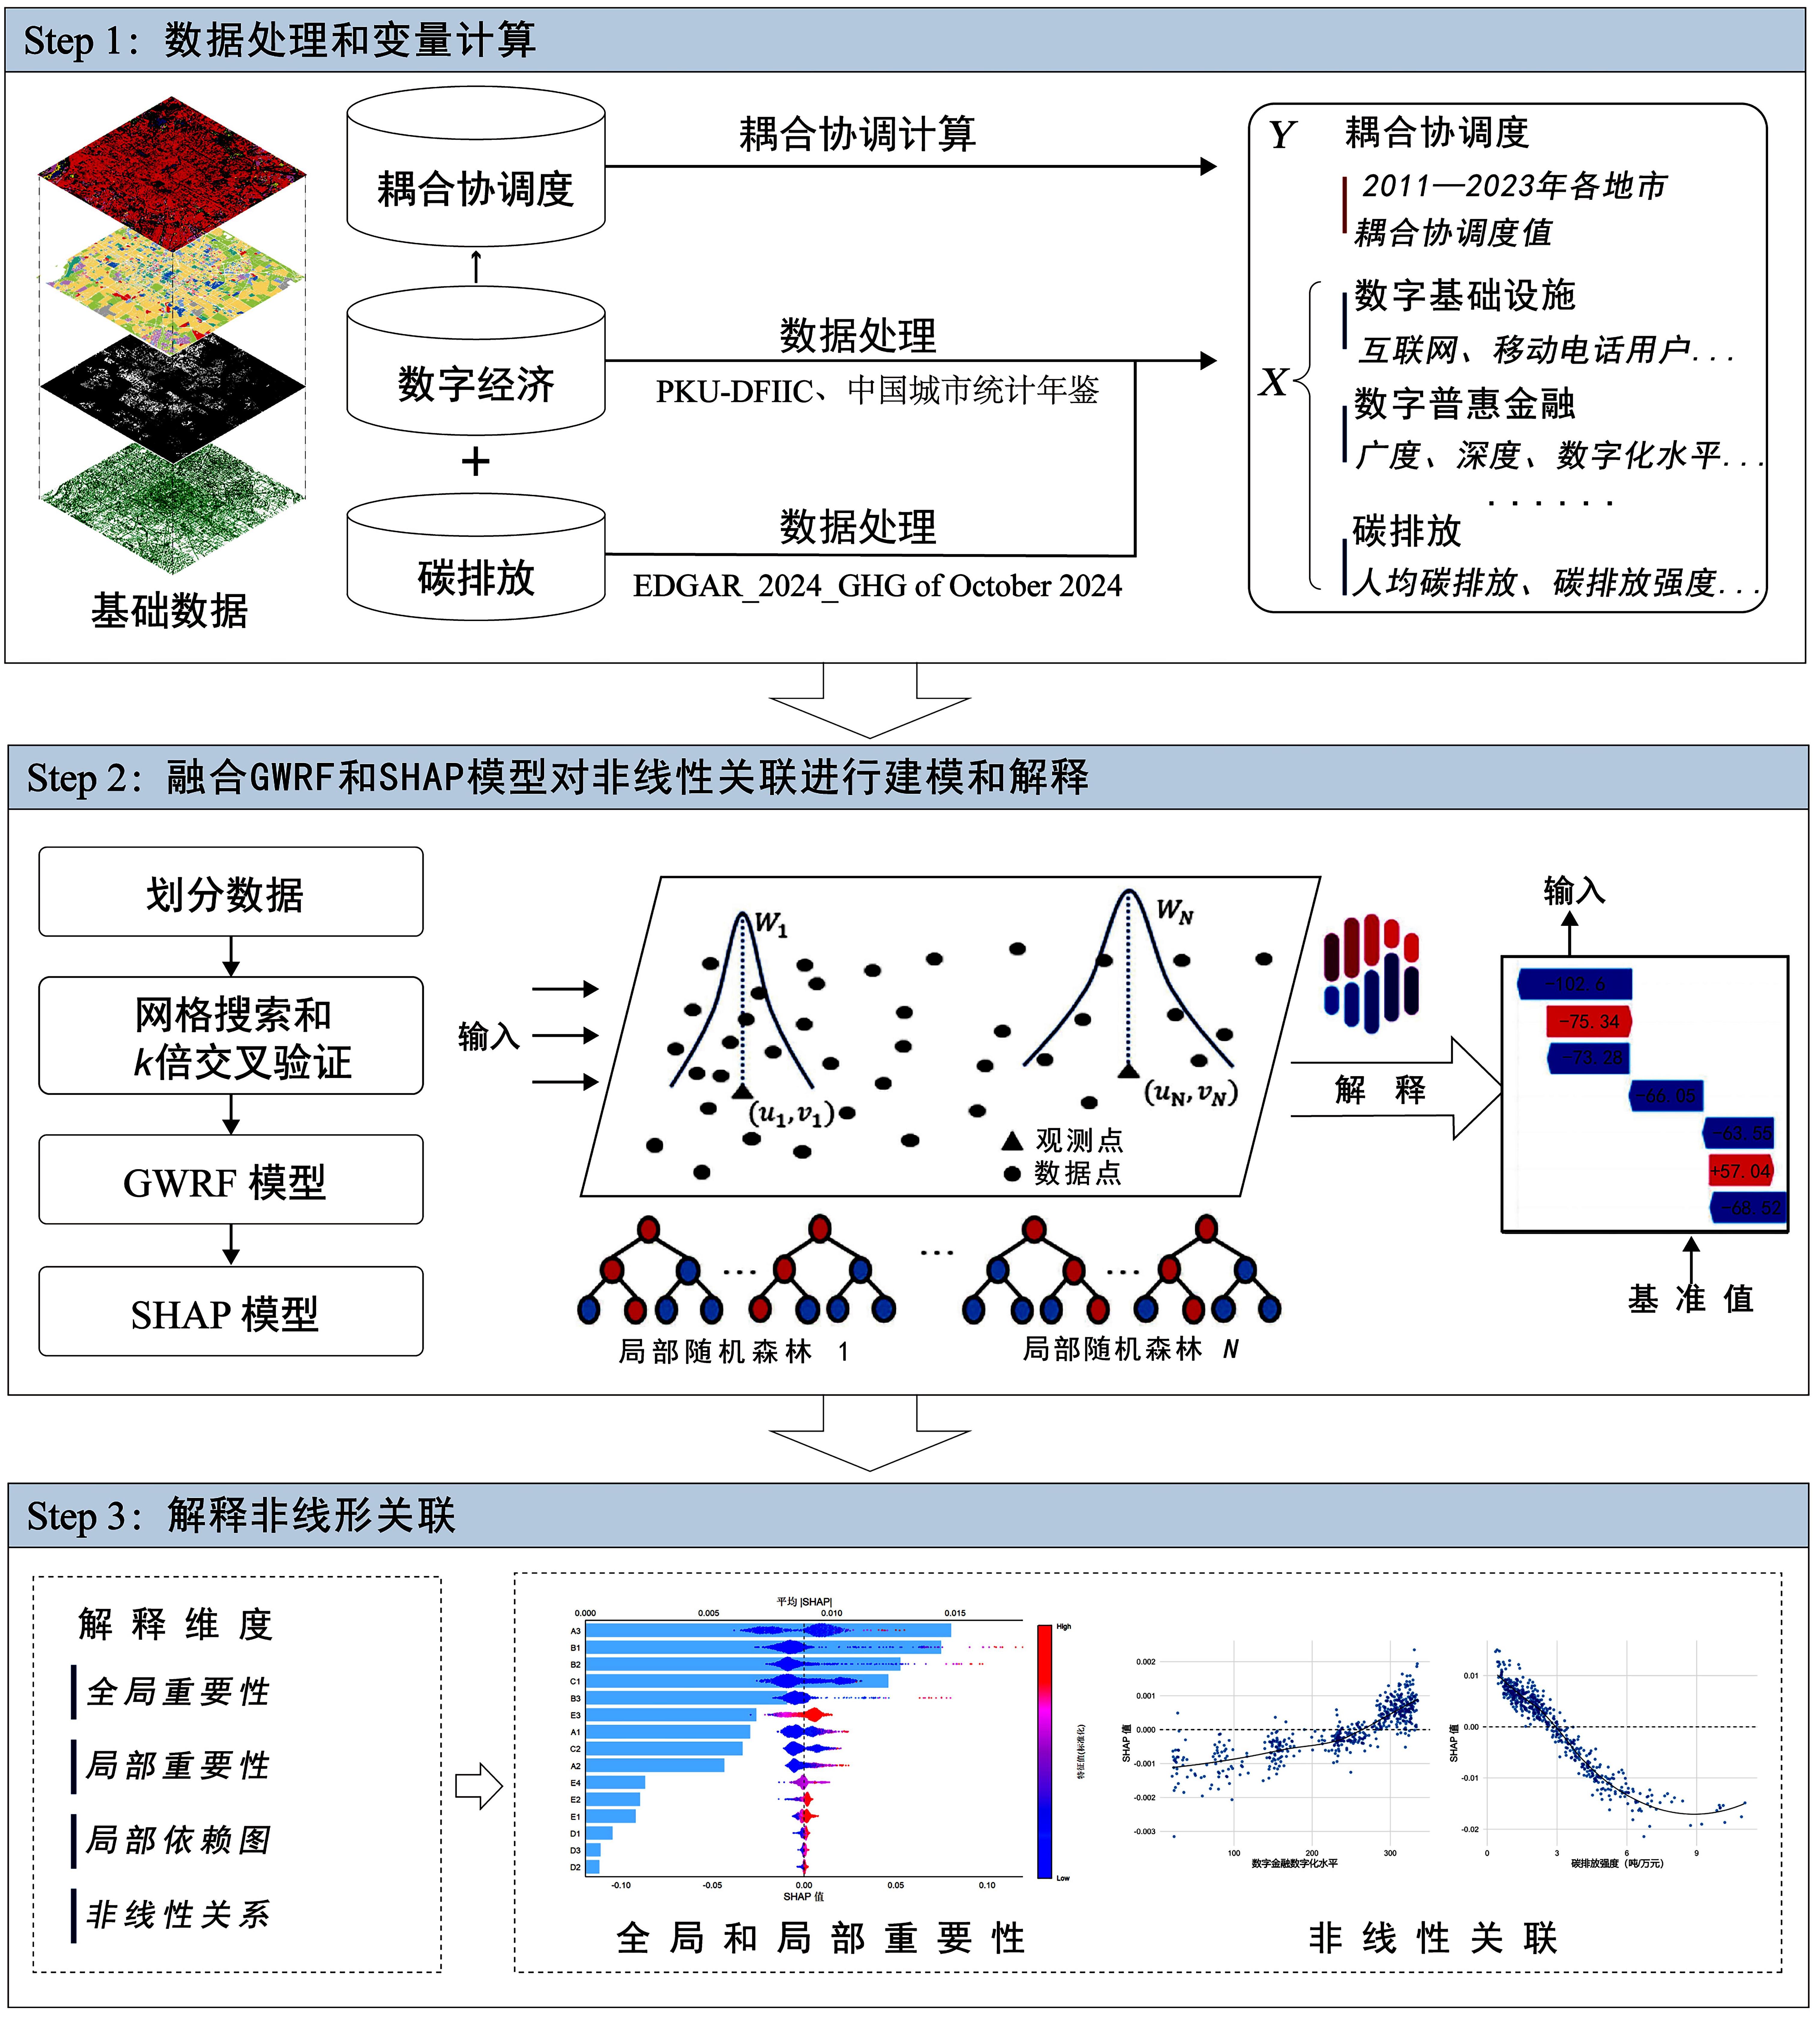
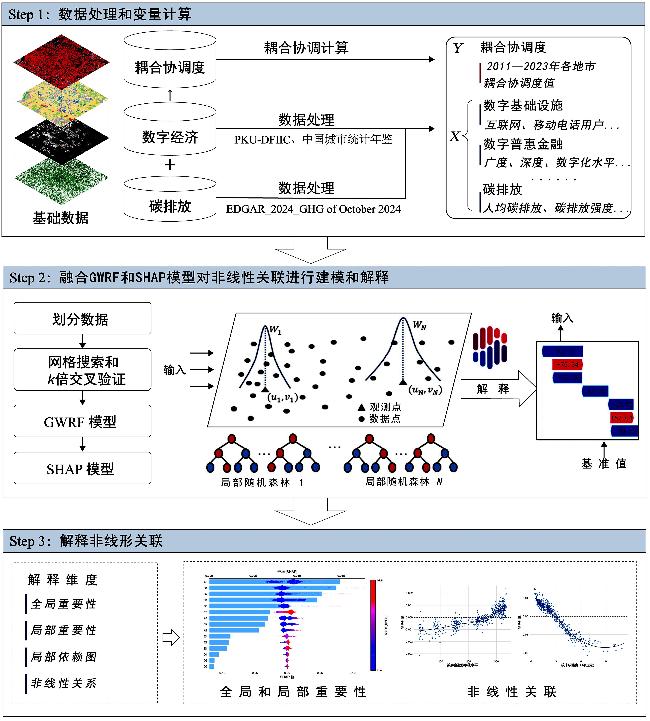
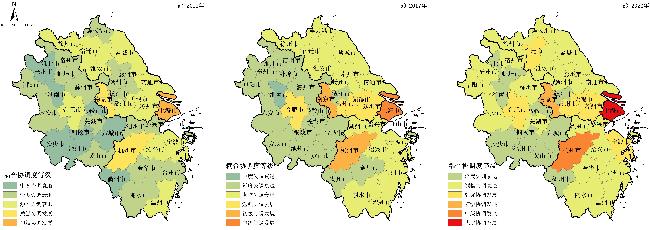
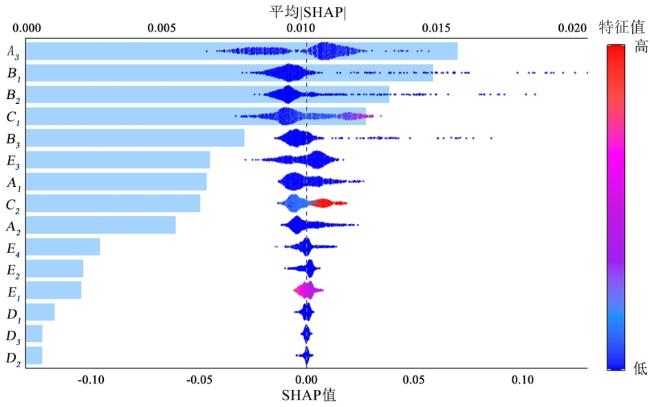
Against the strategic backdrop of "Digital-China" and the "Dual-Carbon" goals, the synergistic advancement of digital economy and carbon emission reduction is crucial for achieving high-quality, sustainable development. As a leading region in China's economic and digital transformation, the Yangtze River Delta (YRD) urban agglomeration provides a critical-case study for examining the complex interplay between digital growth and decarbonization. In this study, we aimed to systematically analyze the spatiotemporal-coupling characteristics and underlying influence mechanisms between the digital economy and carbon emissions in the YRD region from 2011 to 2023. Moving beyond aggregate-analysis and linear-assumptions, this study seeks to reveal the spatial heterogeneity, nonlinear-relationships, and threshold-effects to provide a nuanced empirical basis for differentiated-regional policymaking. Methodologically, we integrated the Geographically Weighted Random Forest (GWRF) model with SHapley Additive exPlanations (SHAP). We constructed comprehensive evaluation systems for both the digital economy and carbon emissions, and calculates the coupling coordination degree (D) between these two systems for 41 cities. The core analytical approach uses the GWRF model, which embeds a spatial-weight matrix into the Random Forest algorithm to simulate the spatially-varying and nonlinear effects of multiple influencing factors on the degree of coordination. Subsequently, the SHAP framework was applied to interpret the GWRF " black-box model and quantify the global-importance, directional-contribution, and potential nonlinear or threshold-behavior of each explanatory variable. This study yielded several key findings. Regarding temporal evolution, the overall coupling coordination degree of the YRD urban agglomeration shows a clear upward trend, increasing from 0.411 in 2011 to 0.505 in 2023, marking a transition from an "imminent-imbalance" to a "barely-coordinated" stage. However, this progression is not monotonic; the significant dip observed in 2021 reflects dynamic tension and potential lagged-adaptation between technological-advancement cycles and stringent emission-reduction targets. In terms of spatial patterns, a distinct hierarchical "core-corridor-periphery" radial structure has formed. Shanghai, leveraging its advanced technological foundation and institutional advantages, remains at the forefront, achieving "high-quality coordination" by 2023. The provinces of Jiangsu and Zhejiang exhibit follow-up growth, entering the "barely-coordinated" stage. In contrast, Anhui province, despite exhibiting the fastest growth rate, remains at the threshold of "imminent-imbalance," highlighting persistent regional disparities within the agglomeration. At the city level, high-coordination cores were concentrated along the Shanghai-Nanjing-Hefei-Hangzhou development axis, with coordination levels gradually diffusing along major transport corridors and weakening in northern Anhui and southwestern Zhejiang. Concerning the model validation and identification of key drivers, the GWRF model demonstrated significantly superior explanatory power and predictive accuracy compared to the standard-Random Forest model, confirming its efficacy in capturing spatial-non-stationarity. The SHAP analysis identified variables from the digital economy subsystem, specifically, the number of mobile phone subscribers, employees in information transmission and software services, and postal business volume, as important positive drivers. Their intensity-of-influence exhibited a spatial-diffusion pattern, radiating outward from core metropolitan areas to key manufacturing nodes and emerging industrial zones. Conversely, variables from the carbon emissions subsystem, particularly carbon emissions intensity and per-capita carbon emissions, act as primary inhibitors of coupling coordination. In summary, this study elucidates a dual-path mechanism, wherein the agglomeration of digital elements drives synergistic improvements, whereas high-carbon economic structures exert inhibitory pressure. This study makes substantive contributions to both the theoretical and methodological fronts. Theoretically, it provides robust empirical evidence for the complex, nonlinear-interdependencies between digital and green transitions, challenging simplistic linear-assumptions and enriching the understanding of their coupling dynamics in a regional context. Methodologically, the integrated GWRF-SHAP framework was validated as a powerful tool for dissecting high-dimensional and spatially-heterogeneous problems in urban and regional studies, offering a replicable-analytical pathway. These findings provide actionable-insights for policymakers to advocate tailored-strategies that reinforce positive digital diffusion, especially in lagging areas, while implementing targeted measures to decouple economic growth from carbon emissions in high-pressure zones. Ultimately, this approach aims to foster a more balanced and synergistic development pathway for the YRD and similar regions.
Qianwei Zhang , Guangliang Xi . Characterization of Spatial and Temporal Coupling of Digital Economy and Carbon Emission in Yangtze River Delta Urban Agglomerations and the Influence Factors by Integrating GWRF and SHAP[J]. Tropical Geography, 2026 , 46(1) : 110 -128 . DOI: 10.13284/j.cnki.rddl.20250510
表1 数字经济与碳排放耦合系统评价指标体系Table 1 Evaluation index system for digital economy and carbon emission coupling system |
| 目标层 | 准则层 | 指标层 | 单位 | 属性 | 权重/% |
|---|---|---|---|---|---|
| 数字经济系统 | 数字基础设施 | 互联网宽带接入用户数A 1 | 万户 | 正向 | 5.62 |
| 固定电话年末用户数A 2 | 万户 | 正向 | 4.26 | ||
| 移动电话年末用户数A 3 | 万户 | 正向 | 5.00 | ||
| 数字人员投入 | 信息传输、软件和信息服务业从业人员数B 1 | 万人 | 正向 | 22.61 | |
| 科学研究和技术服务业从业人员数B 2 | 万人 | 正向 | 18.11 | ||
| 交通运输、仓储和邮政业从业人员数B 3 | 万人 | 正向 | 14.59 | ||
| 数字业务水平 | 邮政业务总量C 1 | 万元 | 正向 | 18.94 | |
| 电信业务总量C 2 | 万元 | 正向 | 9.70 | ||
| 数字普惠金融 | 数字普惠金融覆盖广度D 1 | — | 正向 | 0.39 | |
| 数字普惠金融使用深度D 2 | — | 正向 | 0.30 | ||
| 数字普惠金融数字化水平D 3 | — | 正向 | 0.49 | ||
| 碳排放系统 | 人口碳排放 | 人均碳排量E 1 | t/万人 | 负向 | 16.99 |
| 土地碳排放 | 碳排放密度E 2 | 万t/km2 | 负向 | 14.96 | |
| 经济碳排放 | 碳排放强度E 3 | t/万元 | 负向 | 28.53 | |
| 工业碳排放 | 碳生产力E 4 | t//万元 | 负向 | 39.52 |
表2 2011—2023年长三角城市群整体耦合协调度及时序变化Table 2 Changes in Overall Coupling Coordination Degree and Timing Sequence of Yangtze River Delta Urban Agglomerationsduring 2011-2023 |
| 年份 | 耦合度C | 耦合协调度D | 耦合协调度等级 | 耦合度 增速/% | 耦合协调度增速/% |
|---|---|---|---|---|---|
| 2011 | 0.480 | 0.411 | 濒临失调衰退 | 3.05 | 2.27 |
| 2012 | 0.483 | 0.416 | 濒临失调衰退 | ||
| 2013 | 0.543 | 0.445 | 濒临失调衰退 | ||
| 2014 | 0.535 | 0.446 | 濒临失调衰退 | ||
| 2015 | 0.546 | 0.449 | 濒临失调衰退 | ||
| 2016 | 0.551 | 0.459 | 濒临失调衰退 | ||
| 2017 | 0.560 | 0.466 | 濒临失调衰退 | ||
| 2018 | 0.589 | 0.480 | 濒临失调衰退 | ||
| 2019 | 0.628 | 0.502 | 勉强协调发展 | 4.09 | 3.10 |
| 2020 | 0.638 | 0.510 | 勉强协调发展 | ||
| 2021 | 0.598 | 0.488 | 濒临失调衰退 | -1.76 | -1.06 |
| 2022 | 0.615 | 0.498 | 濒临失调衰退 | ||
| 2023 | 0.631 | 0.505 | 勉强协调发展 | 2.59 | 1.28 |
表3 2011—2023年长三角城市群三省一市耦合协调度及时序变化Table 3 Changes in coupling coordination degree and timing sequence of three provinces and one city in Yangtze River Delta Urban Agglomerations during 2011-2023 |
| 年份 | 上海市 | 江苏省 | 浙江省 | 安徽省 | |||||||
|---|---|---|---|---|---|---|---|---|---|---|---|
| 耦合协调度 | 等级 | 耦合协调度 | 等级 | 耦合协调度 | 等级 | 耦合协调度 | 等级 | ||||
| 2011 | 0.688 | 初级协调发展 | 0.429 | 濒临失调衰退 | 0.418 | 濒临失调衰退 | 0.318 | 轻度失调衰退 | |||
| 2012 | 0.687 | 初级协调发展 | 0.429 | 濒临失调衰退 | 0.431 | 濒临失调衰退 | 0.323 | 轻度失调衰退 | |||
| 2013 | 0.820 | 良好协调发展 | 0.459 | 濒临失调衰退 | 0.435 | 濒临失调衰退 | 0.336 | 轻度失调衰退 | |||
| 2014 | 0.787 | 中级协调发展 | 0.465 | 濒临失调衰退 | 0.437 | 濒临失调衰退 | 0.343 | 轻度失调衰退 | |||
| 2015 | 0.789 | 中级协调发展 | 0.474 | 濒临失调衰退 | 0.440 | 濒临失调衰退 | 0.344 | 轻度失调衰退 | |||
| 2016 | 0.778 | 中级协调发展 | 0.488 | 濒临失调衰退 | 0.447 | 濒临失调衰退 | 0.358 | 轻度失调衰退 | |||
| 2017 | 0.790 | 中级协调发展 | 0.493 | 濒临失调衰退 | 0.455 | 濒临失调衰退 | 0.365 | 轻度失调衰退 | |||
| 2018 | 0.806 | 良好协调发展 | 0.510 | 勉强协调发展 | 0.458 | 濒临失调衰退 | 0.389 | 轻度失调衰退 | |||
| 2019 | 0.869 | 良好协调发展 | 0.531 | 勉强协调发展 | 0.466 | 濒临失调衰退 | 0.411 | 濒临失调衰退 | |||
| 2020 | 0.855 | 良好协调发展 | 0.544 | 勉强协调发展 | 0.471 | 濒临失调衰退 | 0.424 | 濒临失调衰退 | |||
| 2021 | 0.842 | 良好协调发展 | 0.504 | 勉强协调发展 | 0.481 | 濒临失调衰退 | 0.391 | 轻度失调衰退 | |||
| 2022 | 0.888 | 良好协调发展 | 0.508 | 勉强协调发展 | 0.484 | 濒临失调衰退 | 0.400 | 轻度失调衰退 | |||
| 2023 | 0.907 | 优质协调发展 | 0.515 | 勉强协调发展 | 0.488 | 濒临失调衰退 | 0.405 | 濒临失调衰退 | |||
图3 2011—2023年数字基础设施影响因素重要性时空分布格局Fig.3 Spatial and temporal distribution patterns of the importance of factors influencing digital infrastructure during 2011-2023 |
| 2011年 | 2017年 | 2023年 | |
| 互 联 网 宽 带 接 入 用 户 数(A 1) |  | ||
| 固 定 电 话 年 末 用 户 数(A 2) | |||
| 移 动 电 话 年 末 用 户 数(A 3) | |||
图4 2011—2023年数字人员投入影响因素重要性时空分布格局Fig.4 Spatial and temporal distribution patterns of the importance of factors influencing digital personnel inputs during 2011-2023 |
| 2011年 | 2017年 | 2023年 | |
| 信息 传输、 软件和 信息 服务业 从业 人员数(B 1) |  | ||
| 科学 研究和 技术 服务业 从业 人员数(B 2) | |||
| 交通 运输、 仓储和 邮政业 从业 人员数(B 3) | |||
图5 2011—2023年数字业务水平影响因素重要性时空分布格局Fig.5 Spatial and Temporal Distribution Patterns of the Importance of factors influencing the level of digital business during 2011-2023 |
| 2011年 | 2017年 | 2023年 | |
| 邮 政 业 务 总 量 (C 1) |  | ||
| 电 信 业 务 总 量 (C 2) | |||
图6 2011—2023年数字普惠金融影响因素重要性时空分布格局Fig.6 Spatial and temporal distribution patterns of the importance of digital financial inclusion influencing factors during 2011-2023 |
| 2011年 | 2017年 | 2023年 | |
| 数 字 普 惠 金 融 覆 盖 广 度 (D 1) |  | ||
| 数 字 普 惠 金 融 使 用 深 度 (D 2) | |||
| 数 字 普 惠 金 融 数 字 化 水 平 (D 3) | |||
图7 2011—2023年碳排放系统影响因素重要性时空分布格局Fig.7 Spatial and temporal distribution patterns of the importance of factors influencing carbon emission systems during 2011-2023 |
| 2011年 | 2017年 | 2023年 | |
| 人 均 碳 排 量 (E 1) |  | ||
| 碳 排 放 密 度 (E 2) | |||
| 碳 排 放 强 度 (E 3) | |||
| 碳 生 产 力 (E 4) | |||
1 https://db.cei.cn/jsps/Home
2 https://www.epsnet.com.cn/index.html#/Index
3 https://idf.pku.edu.cn/zsbz/515313.htm
张嵌玮:数据收集与分析,论文设计、撰写与修改;
席广亮:论文设计、撰写与修改指导,基金支持。
|
陈艺敏,苏漳文,陈移萍,林子彭. 2024. 基于地理加权随机森林的长三角PM2.5空间效应建模. 中国环境科学,1-9[2024-03-28]. https://doi.org/10.19674/j.cnki.issn1000-6923.20240326.004.
Chen Yimin, Su Zhangwen, Chen Yiping, and Lin Zipeng. 2024. Modelling Spatial Effects of PM2.5 in Yangtze River Delta Based on Geographically Weighted Random Forest. China Environmental Science, 1-9 [2024-03-28]. https://doi.org/10.19674/j.cnki.issn1000-6923.20240326.004.
|
|
蔡勃伟,邢祖哥,周进,黄耿志. 2022. 珠三角城市经济升级与社会升级的耦合协调关系及其影响因素. 热带地理,42(8):1228-1240.
Cai Bowei, Xing Zuge, Zhou Jin, and Huang Gengzhi. 2022. Coupling and Coordination of Economic and Social Upgrading in Pearl River Delta Cities and Its Influencing Factors. Tropical Geography, 42(8): 1228-1240.
|
|
邓荣荣,张翱祥. 2021. 中国城市数字金融发展对碳排放绩效的影响及机理. 资源科学,43(11):2316-2330.
Deng Rongrong and Zhang Aoxiang. 2021. Impacts and Mechanisms of Digital Finance Development on Carbon Emission Performance in Chinese Cities. Resource Science, 43(11): 2316-2330.
|
|
European Commission, Joint Research Centre. 2024. EDGAR—The Emissions Database for Global Atmospheric Research(Database). (2024-11-05) [2025-05-30]. https://edgar.jrc.ec.europa.eu/.
|
|
Fotheringham A S, Brunsdon C, and Charlton M. 2002. Geographically Weighted Regression: The Analysis of Spatially Varying Relationships. Hoboken: Wiley.
|
|
国家数据局. 2025. 数字中国发展报告(2024年). (2025-05-30)[2025-12-17].https://www.nda.gov.cn/sjj/ywpd/sjzg/0530/202505 30151342718164521_pc.html
National Data Administration. 2024. Digital China Development Report (2024). (2025-05-30) [2025-12-17]. https://www.nda.gov.cn/sjj/ywpd/sjzg/0530/20250530151342718164521_pc.html.
|
|
国家统计局. 2025. 中国城市统计年鉴. (2025-12-01)[2025-12-17].https://www.stats.gov.cn/sj/ndsj.
National Bureau of Statistics of China. 2025. China City Statistical Yearbook. (2025-12-01) [2025-12-17]. https://www.stats.gov.cn/sj/ndsj.
|
|
Georganos S, Grippa T, Niang Gadiaga A, Linard T, Lennert M, Vanhuysse S, Mboga N, Wolff E, and Kalogirou S. 2021. Geographical Random Forests: A Spatial Extension of the Random Forest Algorithm to Address Spatial Heterogeneity in Remote Sensing and Population Modelling. Geocarto International, 36(2): 121-136.
|
|
Grekousis G. 2020. Spatial Analysis Methods and Practice: Describe-Explore-Explain through GIS. Cambridge: Cambridge University Press.
|
|
Grekousis G, Feng Z X, Marakakis I, Yi L, and Wang R Y. 2022. Ranking the Importance of Demographic, Socioeconomic, and Underlying Health Factors on US COVID-19 Deaths: A Geographical Random Forest Approach. Health & Place, 74: 102744.
|
|
Han D, Ding Y, Shi Z, and He Y. 2022. The Impact of Digital Economy on Total Factor Carbon Productivity: The Threshold Effect of Technology Accumulation. Environmental Science and Pollution Research, 29(37): 55691-55706.
|
|
贺茂斌,杨晓维. 2021. 数字普惠金融、碳排放与全要素生产率. 金融论坛,26(2):18-25.
He Maobin and Yang Xiaowei. 2021. Digital Financial Inclusion, Carbon Emissions and Total Factor Productivity. Financial Forum, 26(2): 18-25.
|
|
International Energy Agency. 2025. Global Energy Review 2025. (2025-03-01) [2025-05-30]. https://www.iea.org/reports/global-energy-review-2025.
|
|
冷硕峰,席广亮,甄峰. 2023. 长三角数字经济网络演化特征及影响因素. 热带地理,43(4):620-635.
Leng Shuofeng, Xi Guangliang, and Zhen Feng. 2023. Evolutionary Characteristics and Influencing Factors of the Digital Economy Network in the Yangtze River Delta. Tropical Geography, 43(4): 620-635.
|
|
冷硕峰,席广亮,甄峰,刘翰阳. 2024. 基于企业股权关联的长三角数字经济网络演变和空间扩展模式研究. 人文地理,39(3):81-91,182.
Leng Shuofeng, Xi Guangliang, Zhen Feng, and Liu Hanyang. 2024. Study on the Evolution and Spatial Expansion Pattern of the Digital Economy Network in the Yangtze River Delta Based on Inter-Firm Equity Connections. Human Geography, 39(3): 81-91, 182.
|
|
李兰晖,黄聪聪,张镱锂,刘林山,王兆锋,张海燕,张华敏. 2023. 基于地理加权随机森林的青藏地区放牧强度时空格局模拟. 地理科学,43(3):398-410.
Li Lanhui, Huang Congcong, Zhang Yili, Liu Linshan, Wang Zhaofeng, Zhang Haiyan, and Zhang Huamin. 2023. Simulation of Spatial and Temporal Patterns of Grazing Intensity in Qinghai-Tibet Based on Geographically Weighted Random Forest. Geoscience, 43(3): 398-410.
|
|
Li Y, Yang X, Ran Q, Wu H, Irfan M, and Ahmad M. 2021. Energy Structure, Digital Economy, and Carbon Emissions: Evidence from China. Environmental Science Pollution Research, 28(45): 64606-64629.
|
|
Li Z and Wang J. 2022. The Dynamic Impact of Digital Economy on Carbon Emission Reduction: Evidence City-Level Empirical Data in China. Journal of Cleaner Production, 351: 131570.
|
|
Lundberg S and Lee S. 2017. A Unified Approach to Interpreting Model Predictions. In: von Luxburg U, Guyon I, Bengio S, Wallach H, and Fergus R. NIPS'17: Proceedings of the 31st International Conference on Neural Information Processing Systems. New York: Curran Associates Inc, 4768-4777.
|
|
Luo Y W, Yan J G, McClure S C, and Li F. 2022 Socioeconomic and Environmental Factors of Poverty in China Using Geographically Weighted Random Forest Regression Model. Environmental Science and Pollution Research, 29(22): 33205-33217.
|
|
吕明元,麻林宵. 2022. 中国省域大数据与制造业融合测度分析——基于2013—2018年中国省级面板数据. 技术经济,41(1):88-100.
Lyu Mingyuan and Ma Linxiao. 2022 Analysis of Measurement of Big Data and Manufacturing Integration in Chinese Provinces—Based on Chinese Provincial Panel Data from 2013-2018. Technical Economics, 41(1): 88-100.
|
|
孟贵,王开泳,王甫园,李贺. 2024. 长江经济带市域数字经济与城乡融合发展耦合协调格局及其作用机制. 经济地理,44(11):73-83.
Meng Gui, Wang Kaiyong, Wang Fuyuan, and Li He. 2024. Coupling Coordination Pattern and Its Mechanism between Urban-Rural Integration Development and Digital Economy at Prefectural Level in the Yangtze River Economic Belt. Economic Geography, 44(11): 73-83.
|
|
缪陆军,陈静,范天正,吕雁琴. 2022. 数字经济发展对碳排放的影响——基于278个地级市的面板数据分析. 南方金融,(2):45-57.
Miao Lujun, Chen Jing, Fan Tianzheng, and Lyu Yanqin. 2022 Impact of Digital Economy Development on Carbon Emissions—A Panel Data Analysis Based on 278 Prefecture-Level Cities. Southern Finance, (2): 45-57.
|
|
廖铮潇,席广亮,张嵌玮,黄启泽. 2025. 碳汇潜力视角下的长三角城市群碳排放空间关联网络时空演变及驱动因素. 陕西师范大学学报(自然科学版),53(5):1-14. DOI:10.15983/j.cnki.jsnu.2025501.
Liao Zhengxiao, Xi Guangliang, Zhang Qianwei, and Huang Qize. 2025. Spatio-Temporal Evolution and Driving Factors of the Spatial Correlation Network of Carbon Emissions in the Yangtze River Delta Urban Agglomeration from the Perspective of Carbon Sink Potential. Journal of Shaanxi Normal University(Natural Science Edition), 53(5): 1-14. DOI:10.15983/j.cnki.jsnu.2025501.
|
|
Quiñones S, Goyal A, and Ahmed Z U. 2021 Geographically Weighted Machine Learning Model for Untangling Spatial Heterogeneity of Type 2 Diabetes Mellitus (T2D) Prevalence in the USA. Scientific Reports, 11(1): 6955.
|
|
孙茜,黄丽. 2022. 风险投资网络与绿色技术创新网络的时空耦合及其影响因素——以长三角城市群为例. 热带地理,42(5):716-726.
Sun Xi and Huang Li. 2022. Spatio-Temporal Coupling of Venture Capital Network and Green Technology Innovation Network and Its Influencing Factors—A Case Study of Yangtze River Delta City Cluster. Tropical Geography, 42(5): 716-726.
|
|
田云,林子娟. 2022. 中国省域农业碳排放效率与经济增长的耦合协调. 中国人口·资源与环境,32(4):13-22.
Tian Yun and Lin Zijuan. 2022. Coupled Coordination of Agricultural Carbon Emission Efficiency and Economic Growth in Chinese Provinces. China Population-Resources and Environment, 32(4): 13-22.
|
|
Tian Y and Lin Z J. 2022. Coupling Coordination between Agricultural Carbon Emission Efficiency and Economic Growth at Provincial Level in China. China Population, Resources and Environment, 32(4): 13-22.
|
|
Wang X, Wang X, Ren X, and Wen F. 2022 Can Digital Financial Inclusion Affect CO2 Emissions of China at the Prefecture Level? Evidence from a Spatial Econometric Approach. Energy Economics, 109: 105966.
|
|
王梓蒙,刘艳芳,罗璇,仝照民,安睿. 2023. 基于多源数据的城市活力与建成环境非线性关系研究——以双休日武汉市主城区为例. 地理科学进展,42(4):716-729.
Wang Zimeng, Liu Yanfang, Luo Xuan, Tong Zhaomin, and An Rui. 2023. A Study on the Nonlinear Relationship between Urban Vitality and Built Environment Based on Multi-Source Data—A Case Study of Wuhan's Main Urban Area on a Double Holiday. Progress in Geoscience, 42(4): 716-729.
|
|
席广亮,甄峰,方创琳,杨帆. 2025. 形流融合视角的都市圈国土空间优化与协调发展. 地理学报 ,80(2):272-287.
Xi Guangliang, Zhen Feng, Fang Chuanglin, and Yang Fan. 2025. Optimization and Coordinated Development of Metropolitan Territorial Space from the Perspective of "Form-Flow Integration". Acta Geographica Sinica, 80(2): 272-287.
|
|
谢云飞. 2021. 数字经济对区域碳排放强度的影响效应及作用机制. 当代经济管理,44(2):68-78.
Xie Yunfei. 2021. The Effect of Digital Economy on Regional Carbon Emission Intensity and Its Mechanism. Contemporary Economic Management, 44(2): 68-78.
|
|
颜平,周闻宇,王瑞荣,金湖江. 2024. 长三角城市群数字经济与制造业高质量发展耦合协调时空演化及影响因素. 经济地理,44(7):87-95.
Yan Ping, Zhou Wenyu, Wang Ruirong, and Jin Hujiang. 2024. Spatio-Temporal Evolution and Influencing Factors of Coupling Coordination between Digital Economy and High-quality Development of Manufacturing Industry in the Yangtze River Delta Urban Agglomeration. Economic Geography, 44(7): 87-95.
|
|
杨坤,汪万. 2020. 长三角地区协同创新、产业结构与生态效率耦合协调发展的时空演化. 科技管理研究,40(21):80-87.
Yang Kun and Wang Wan. 2020. Spatial and Temporal Evolution of the Coupled and Coordinated Development of Collaborative Innovation, Industrial Structure and Eco-Efficiency in the Yangtze River Delta Region. Research on Science and Technology Management, 40(21): 80-87.
|
|
叶淼,朱琳,刘旭东,黄勇,陈蓓蓓,李欢. 2024. 基于连续小波变换、SHAP 和 XGBoost 的土壤有机质含量高光谱反演. 环境科学,45(4):2280-2291.
Ye Miao, Zhu Lin, Liu Xudong, Huang Yong, Chen Beibei, and Li Huan. 2024. Hyperspectral Inversion of Soil Organic Matter Content Based on Continuous Wavelet Transform, SHAP and XGBoost. Environmental Science, 45(4): 2280-2291.
|
|
Zhao H B, Gu T S, Tang J Q, Gong Z Y, and Zhao P J. 2023. Urban Flood Risk Differentiation under Land Use Scenario Simulation. iScience, 26(4): 106479.
|
|
赵宏波,谷天顺,孙东琪,苗长虹. 2023. “三生”功能视角下黄河流域城市人居环境动态演变与机制. 地理学报,78(12):2973-2999.
Zhao Hongbo, Gu Tianshun, Sun Dongqi, and Miao Changhong. 2023. Evolution of Urban Habitat Dynamics and Mechanisms in the Yellow River Basin from the Perspective of the 'Three Lives' Function. Acta Geographica Sinica, 78(12): 2973-2999.
|
|
赵涛,张智,梁上坤. 2020. 数字经济、创业活跃度与高质量发展——来自中国城市的经验证据. 管理世界,36(10):65-76.
Zhao Tao, Zhang Zhi, and Liang Shangkun. 2020. Digital Economy, Entrepreneurial Activity and High-Quality Development-Empirical Evidence from Chinese Cities. Management World, 36(10): 65-76.
|
|
张茹倩,李鹏辉,徐丽萍. 2022. 城镇化对新疆土地利用碳排放的影响及其耦合关系. 生态学报,(13):1-17.
Zhang Ruqian, Li Penghui, and Xu Liping. 2022. Impacts of Urbanisation on Carbon Emissions from Land Use and Its Coupling Relationship in Xinjiang. Journal of Ecology, (13): 1-17.
|
|
Zhou X, Zhou D, Zhao Z, and Wang Q. 2022. A Framework to Analyze Carbon Impacts of Digital Economy: The Case of China. Sustainable Production and Consumption, 31: 357-369.
|
|
朱智洺,徐婕,林文雪. 2024. 长三角城市群碳减排与经济高质量发展时空耦合及驱动因素. 长江流域资源与环境,33(10):2285-2298.
Zhu Zhiming, Xu Jie, and Lin Wenxue. 2024. Spatio-Temporal Coupling and Driving Factors of Carbon Emission Reduction and High-Quality Economic Development in the Yangtze River Delta Urban Agglomeration. Resources and Environment in the Yangtze River Basin, 33(10): 2285-2298.
|
/
| 〈 |
|
〉 |