×
模态框(Modal)标题
在这里添加一些文本
Close
Close
Submit
Cancel
Confirm
×
模态框(Modal)标题
×
Journal
Article
Figure
Search
EN
中文
Home
About Journal
About Journal
Indexed in
Awards
Editorial Board
Guide for Authors
Browse
Current Issue
Online First
Archive
Highlights
Topic
Archive by Subject
Most Viewed
Most Download
Most Cited
E-mail Alert
RSS
Subscribe
Topic
Contact us
EN
中文
Figure/Table detail
Characteristics of Co-agglomeration and Spatial Follow-up of High-tech Industries in Nanjing Metropolitan Area
Qianwei Zhang, Guangliang Xi, Zhengxiao Liao
Tropical Geography
, DOI:
10.13284/j.cnki.rddl.20250454
年份
行业
医药制造业
电子信息和通信设备制造业
2012
信息服务业
0.4816
***
0.5187
***
科研服务业
0.5056
***
0.5421
***
2017
信息服务业
0.2634
***
0.4940
***
科研服务业
0.2676
**
0.4901
***
2022
信息服务业
0.2165
**
0.3996
***
科研服务业
0.2340
**
0.3970
***
Table 2
Bivariate spatial autocorrelation global Moran's
I
for high technology industry segments, 2012-2022
Other figure/table from this article
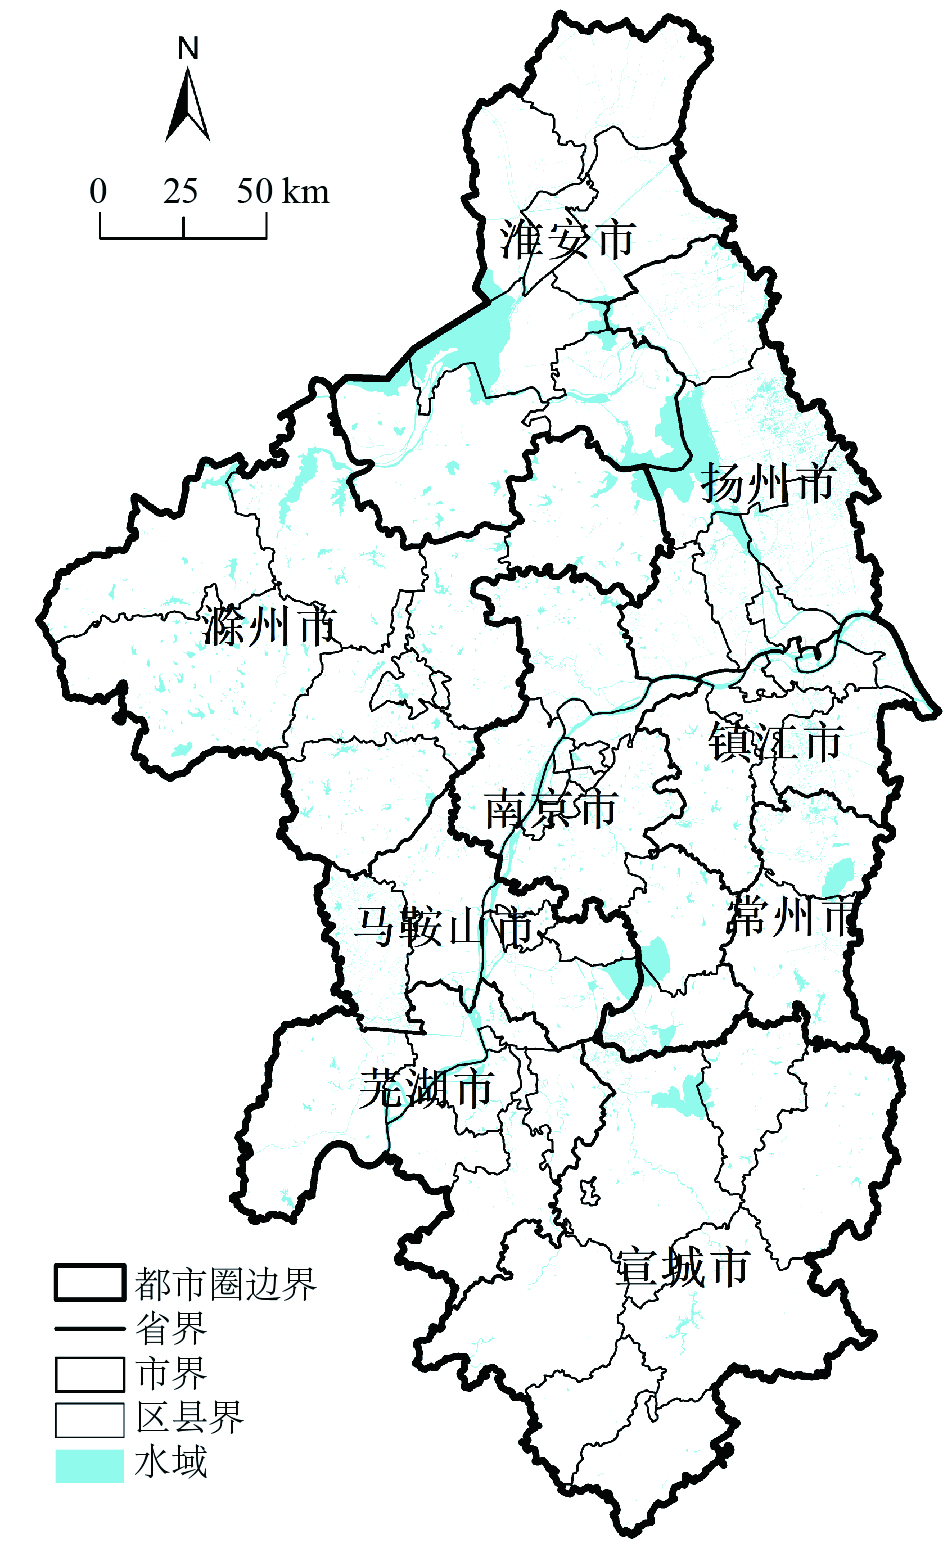
Fig.1
Spatial scope of nanjing metropolitan area
Table 1
Types of high-tech industries
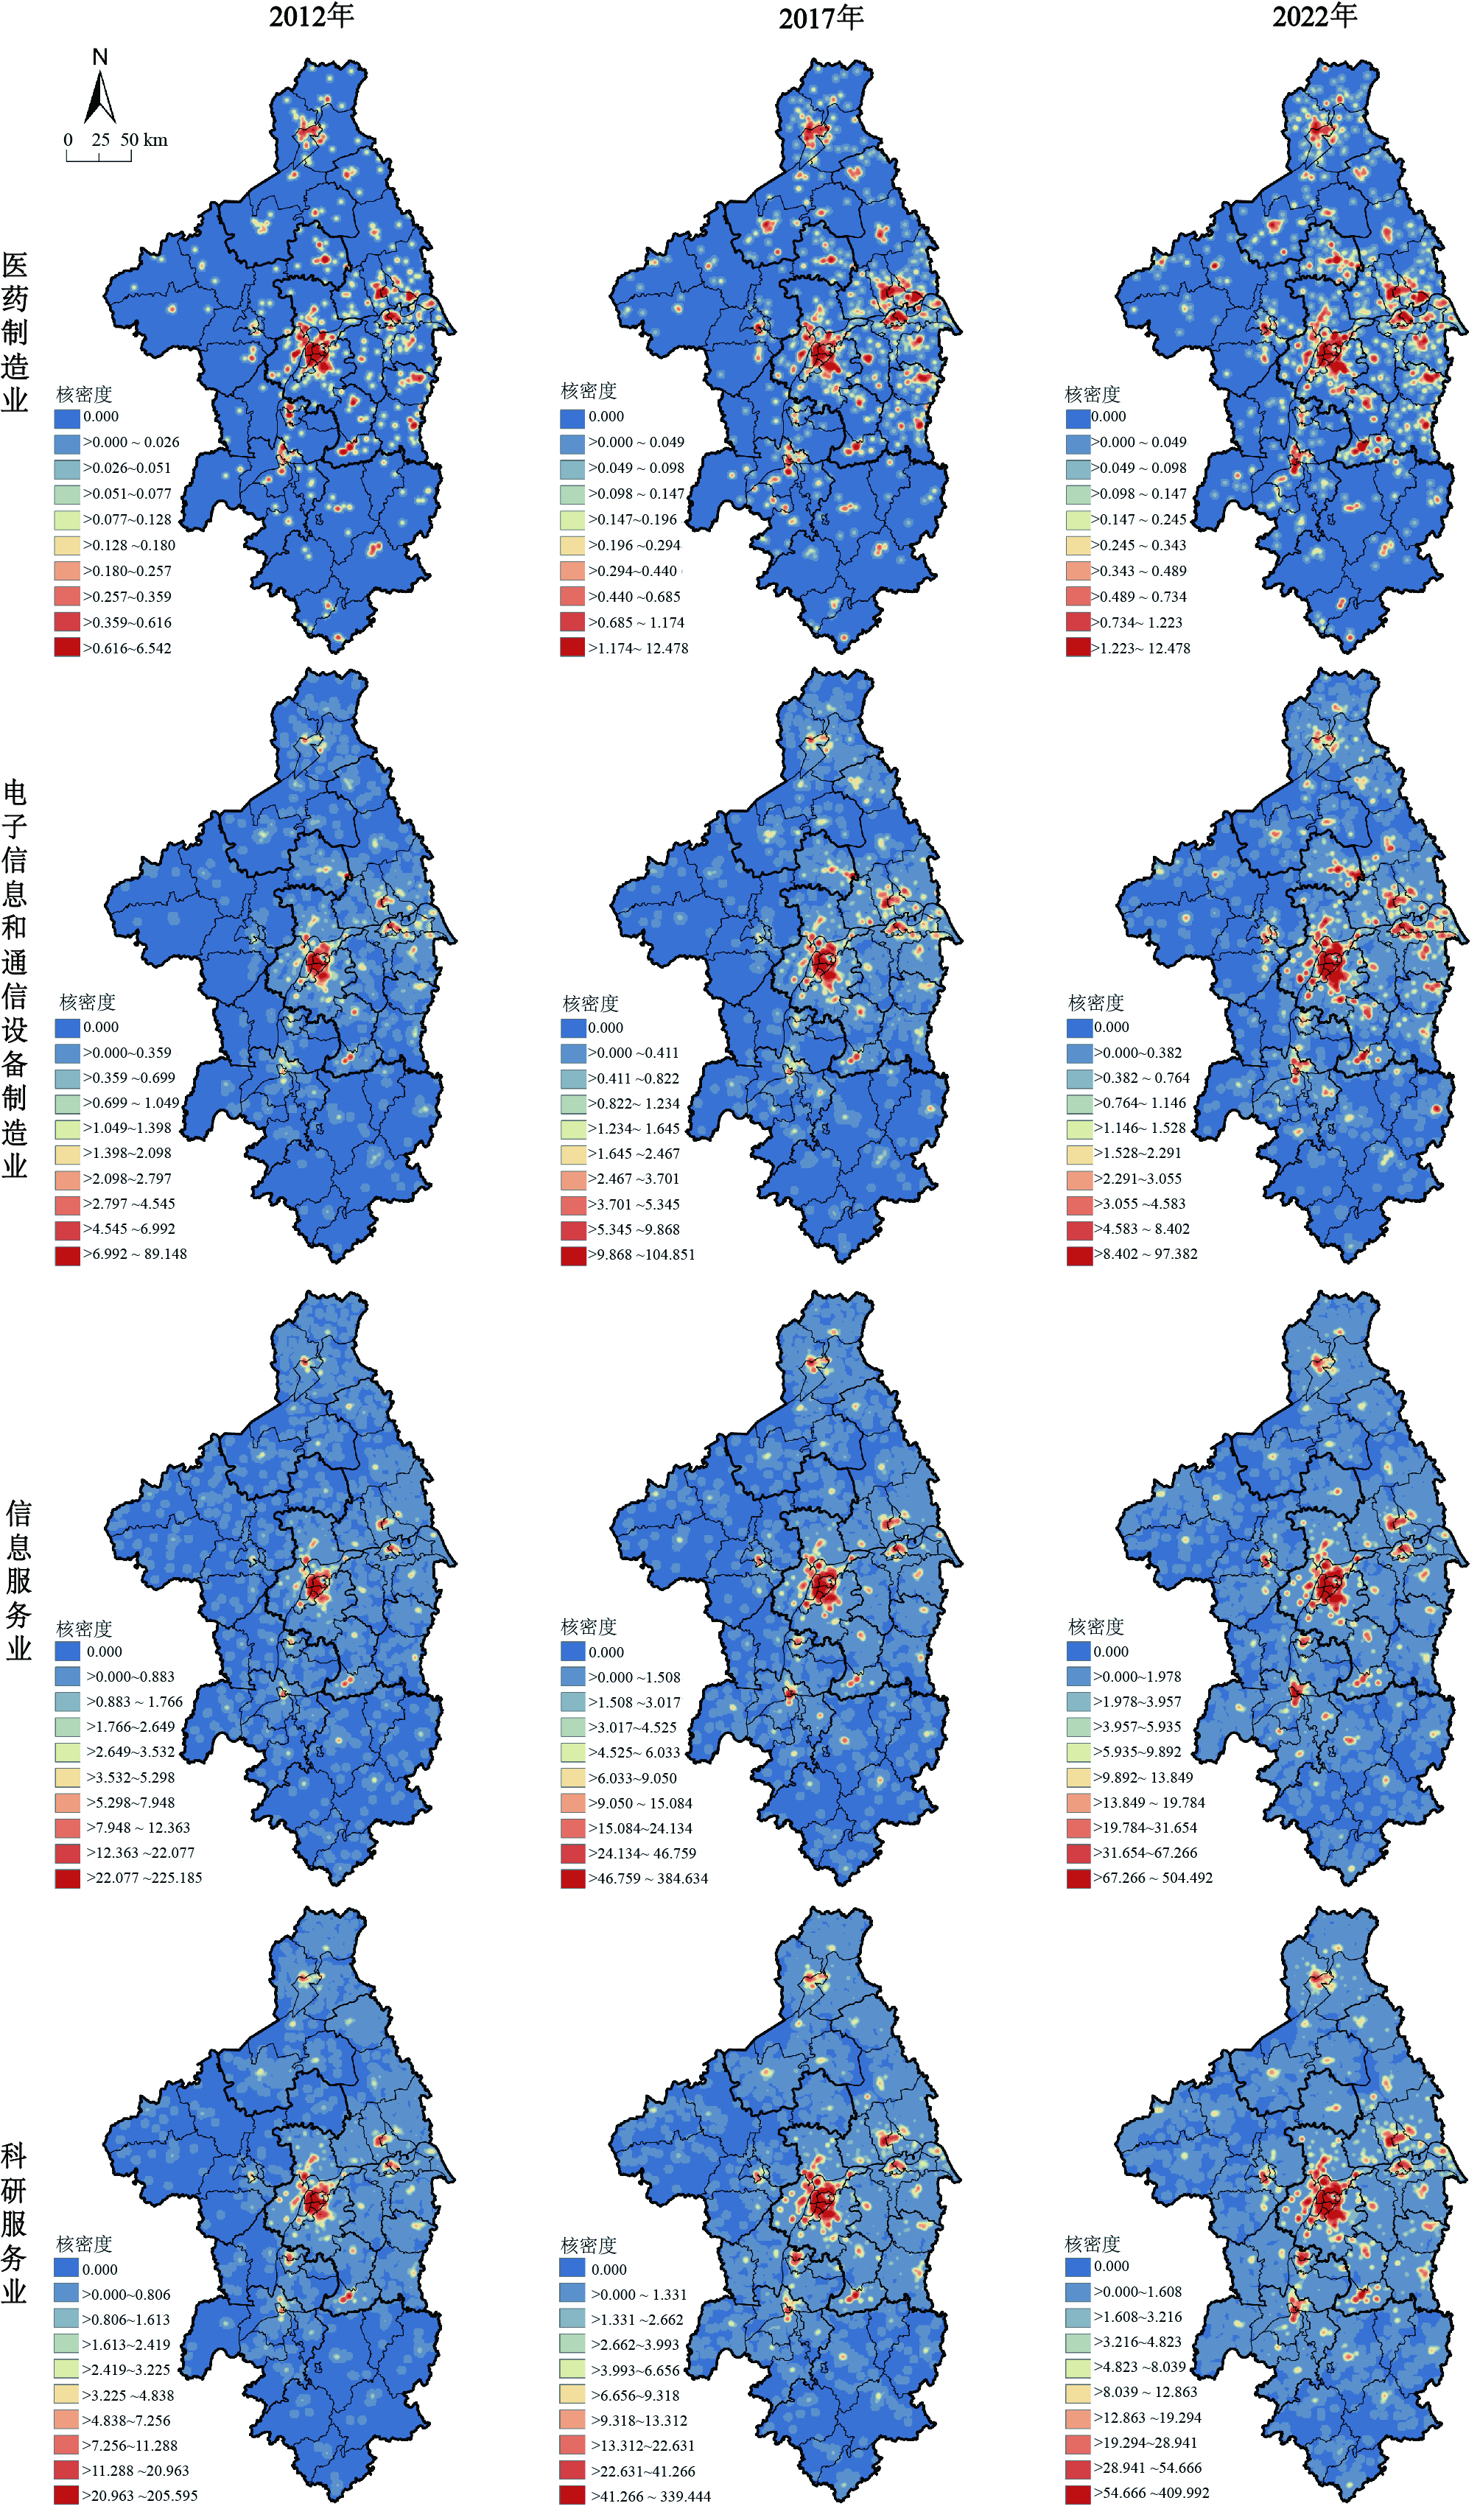
Fig.2
Kernel Density Analysis of High-Tech Industries in Nanjing Metropolitan Area, 2012-2022
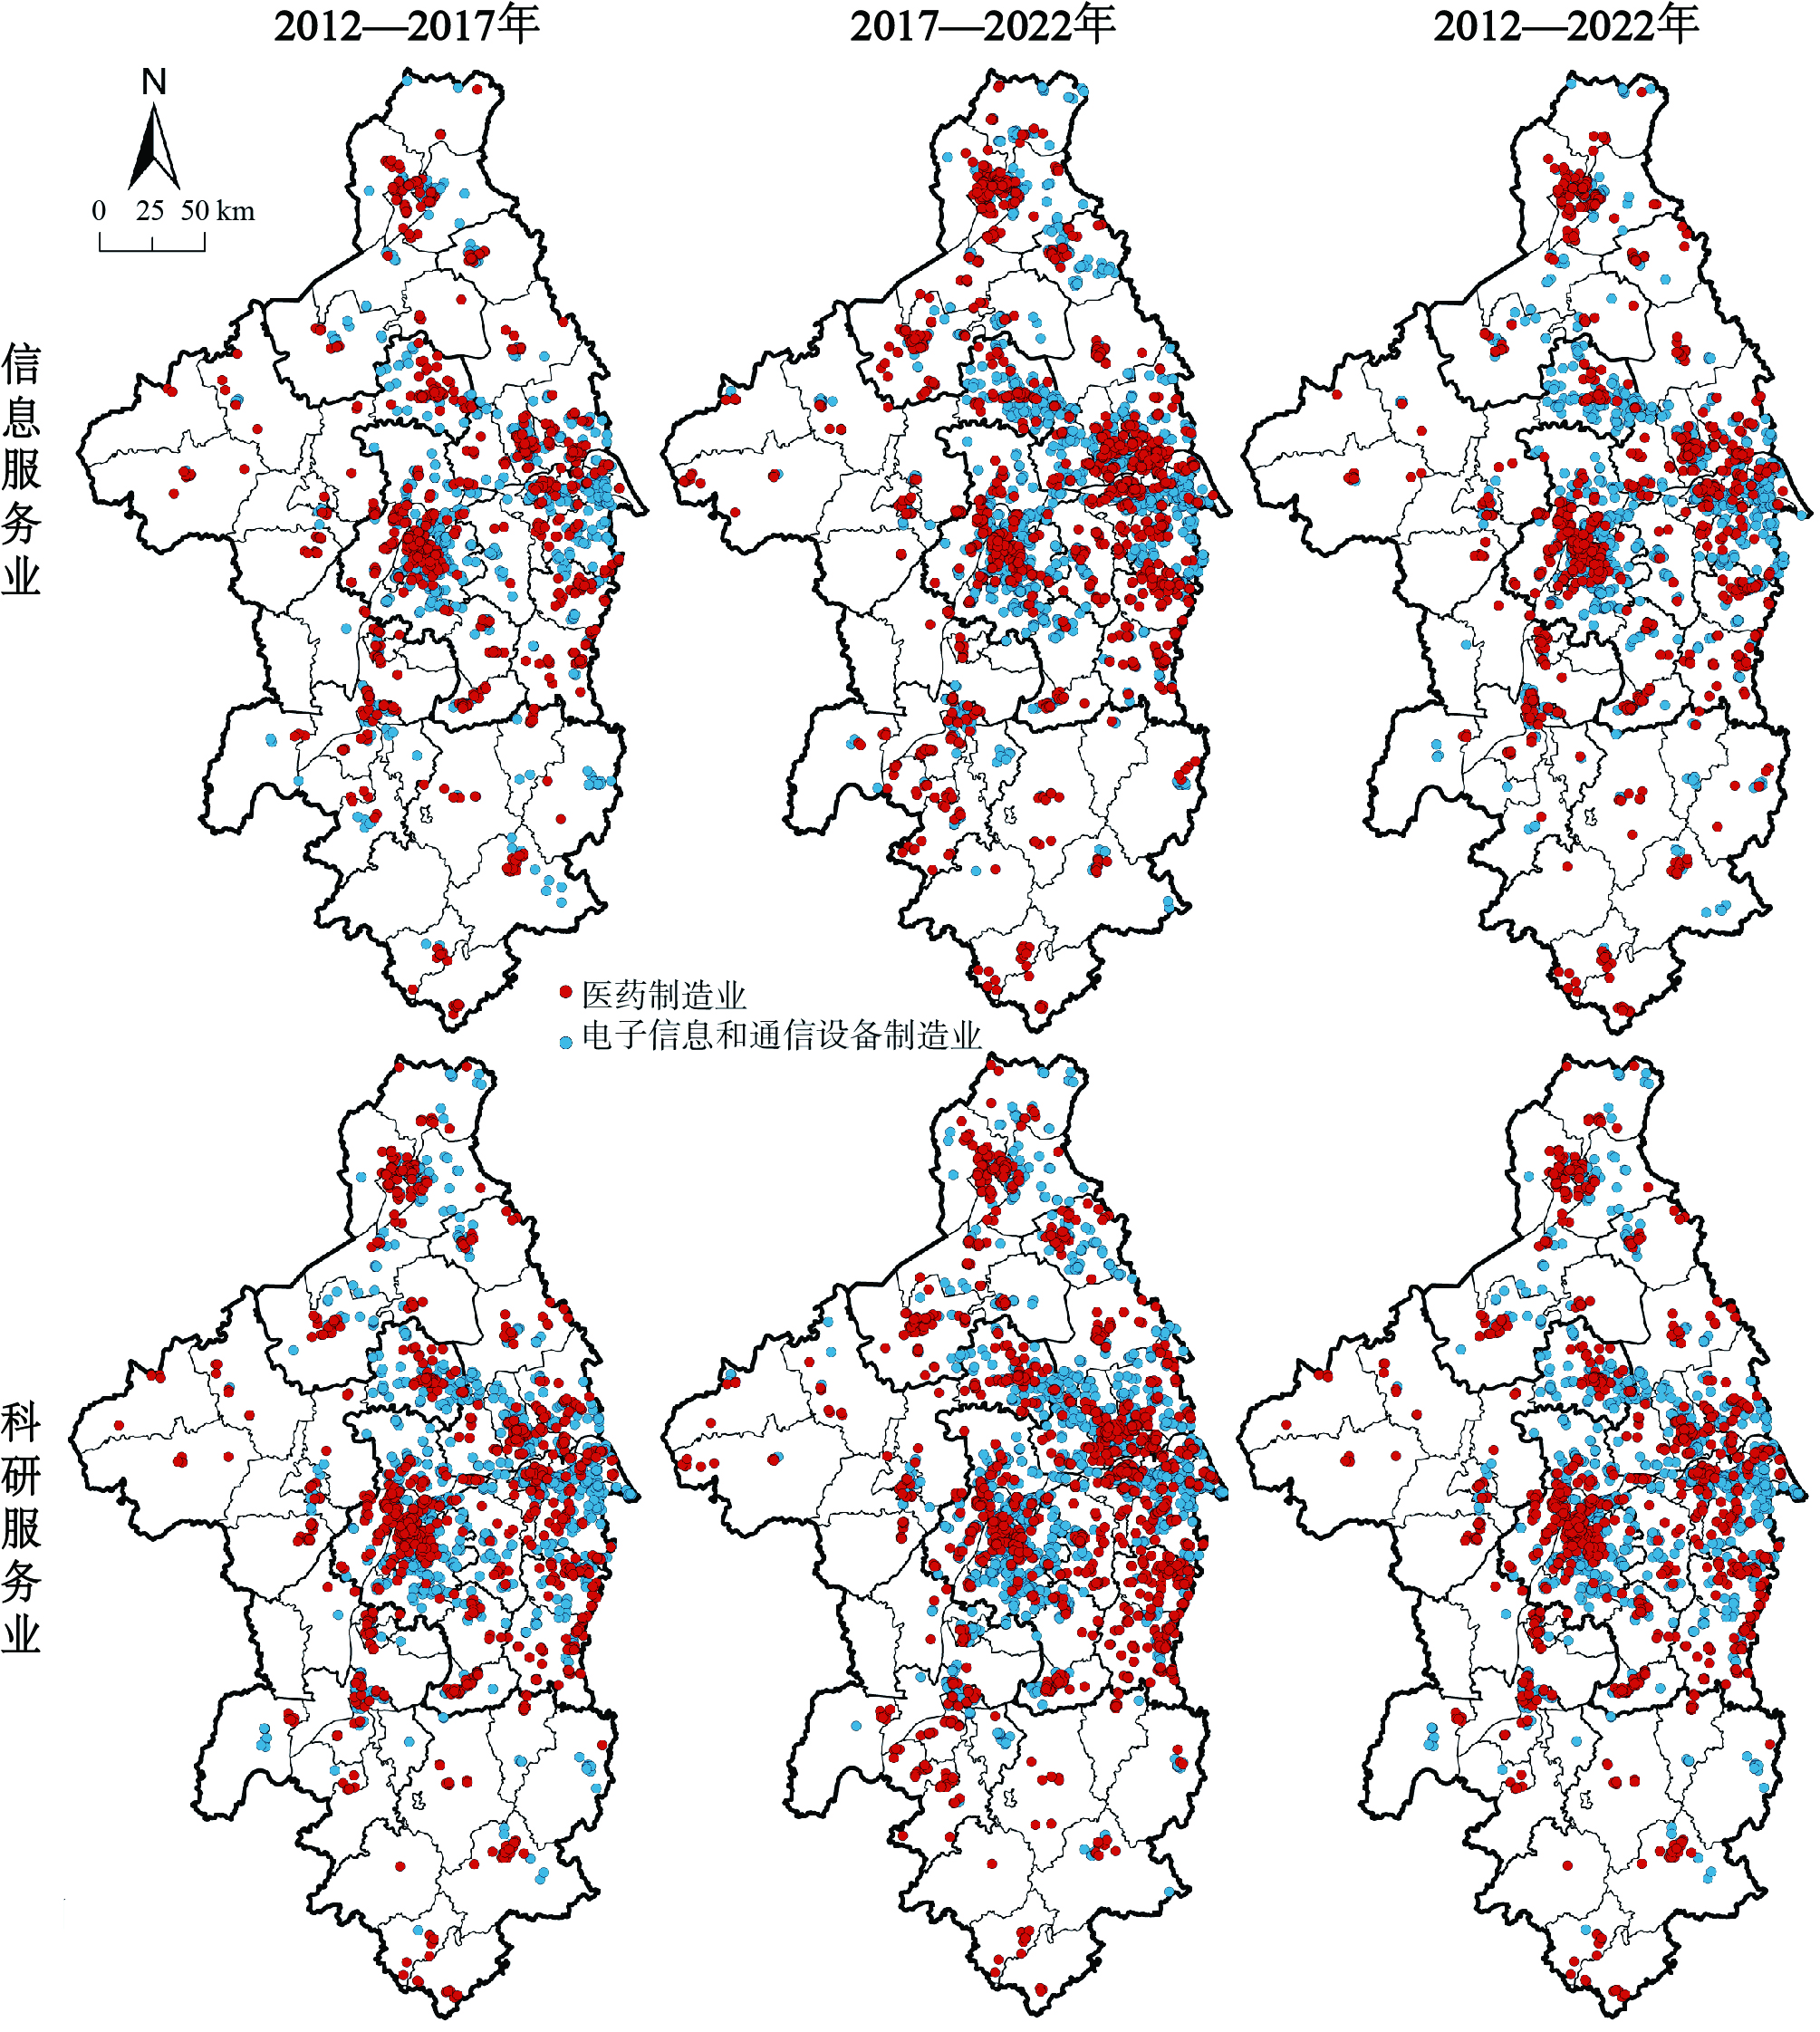
Fig.3
LCLQ of the high-tech service industry attracted by high-tech manufacturing industry
Table 3
Spatial followership of high-tech service industries to subsectors of the pharmaceutical manufacturing industry
Table 4
Spatial followership of high-tech service industries to subsectors of electronic information and communication equipment manufacturing industry