×
模态框(Modal)标题
在这里添加一些文本
Close
Close
Submit
Cancel
Confirm
×
模态框(Modal)标题
×
Journal
Article
Figure
Search
EN
中文
Home
About Journal
About Journal
Indexed in
Awards
Editorial Board
Guide for Authors
Browse
Current Issue
Online First
Archive
Highlights
Topic
Archive by Subject
Most Viewed
Most Download
Most Cited
E-mail Alert
RSS
Subscribe
Topic
Contact us
EN
中文
Figure/Table detail
Dynamic Heat Exposure Risk Assessment of Urban Residents Based on SOLWEIG Model: A Case Study of Chengdu Central City
Yu Zou, Jiao Chen, He Li
Tropical Geography
, 2025, 45(
10
): 1799-1814. DOI:
10.13284/j.cnki.rddl.20240712
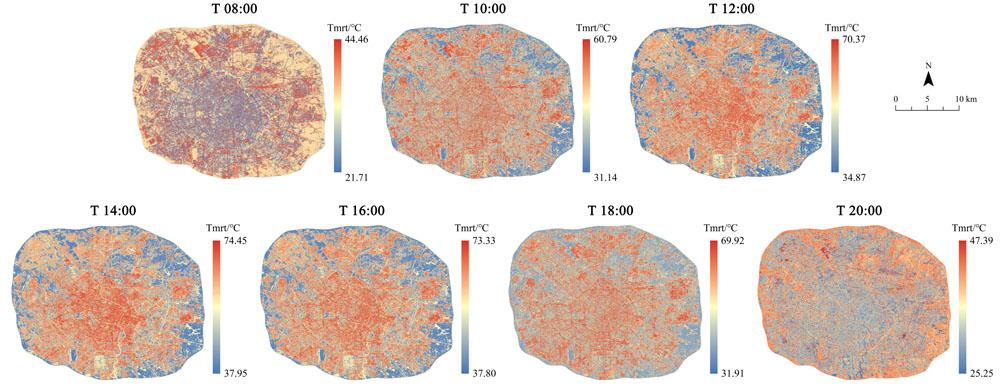
Fig.4
Spatiotemporal distribution characteristics of Tmrt
Other figure/table from this article
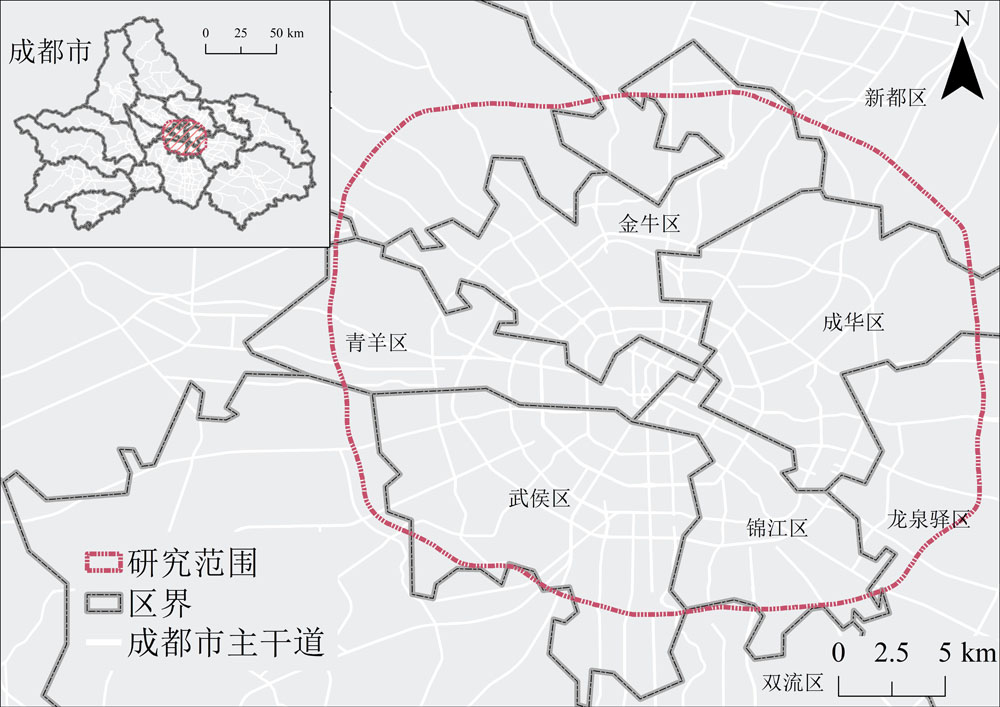
Fig.1
Geographical location of the study area
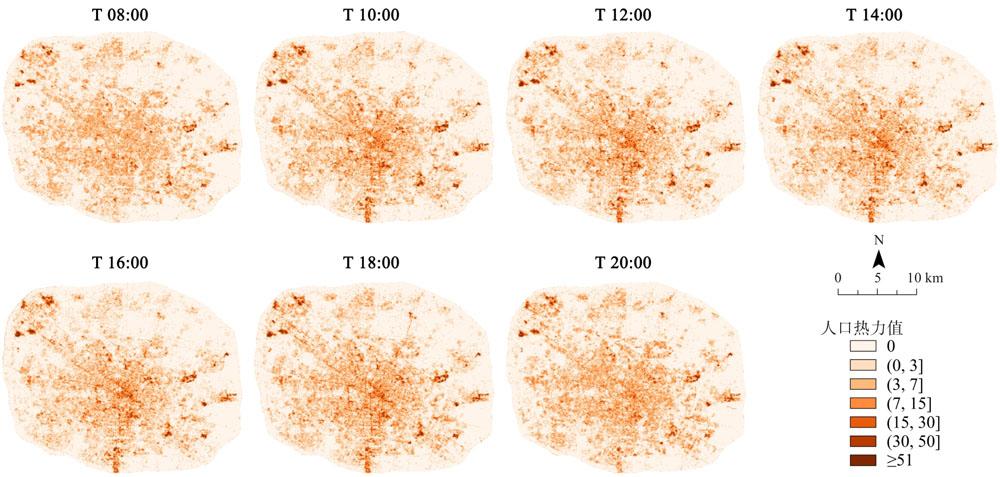
Fig.2
The Spatial distribution changes of the easygo population data
Table 1
Levels of population relative risks of heat exposure
Table 2
Time variation of mean radiation temperature(Tmrt) within the study area
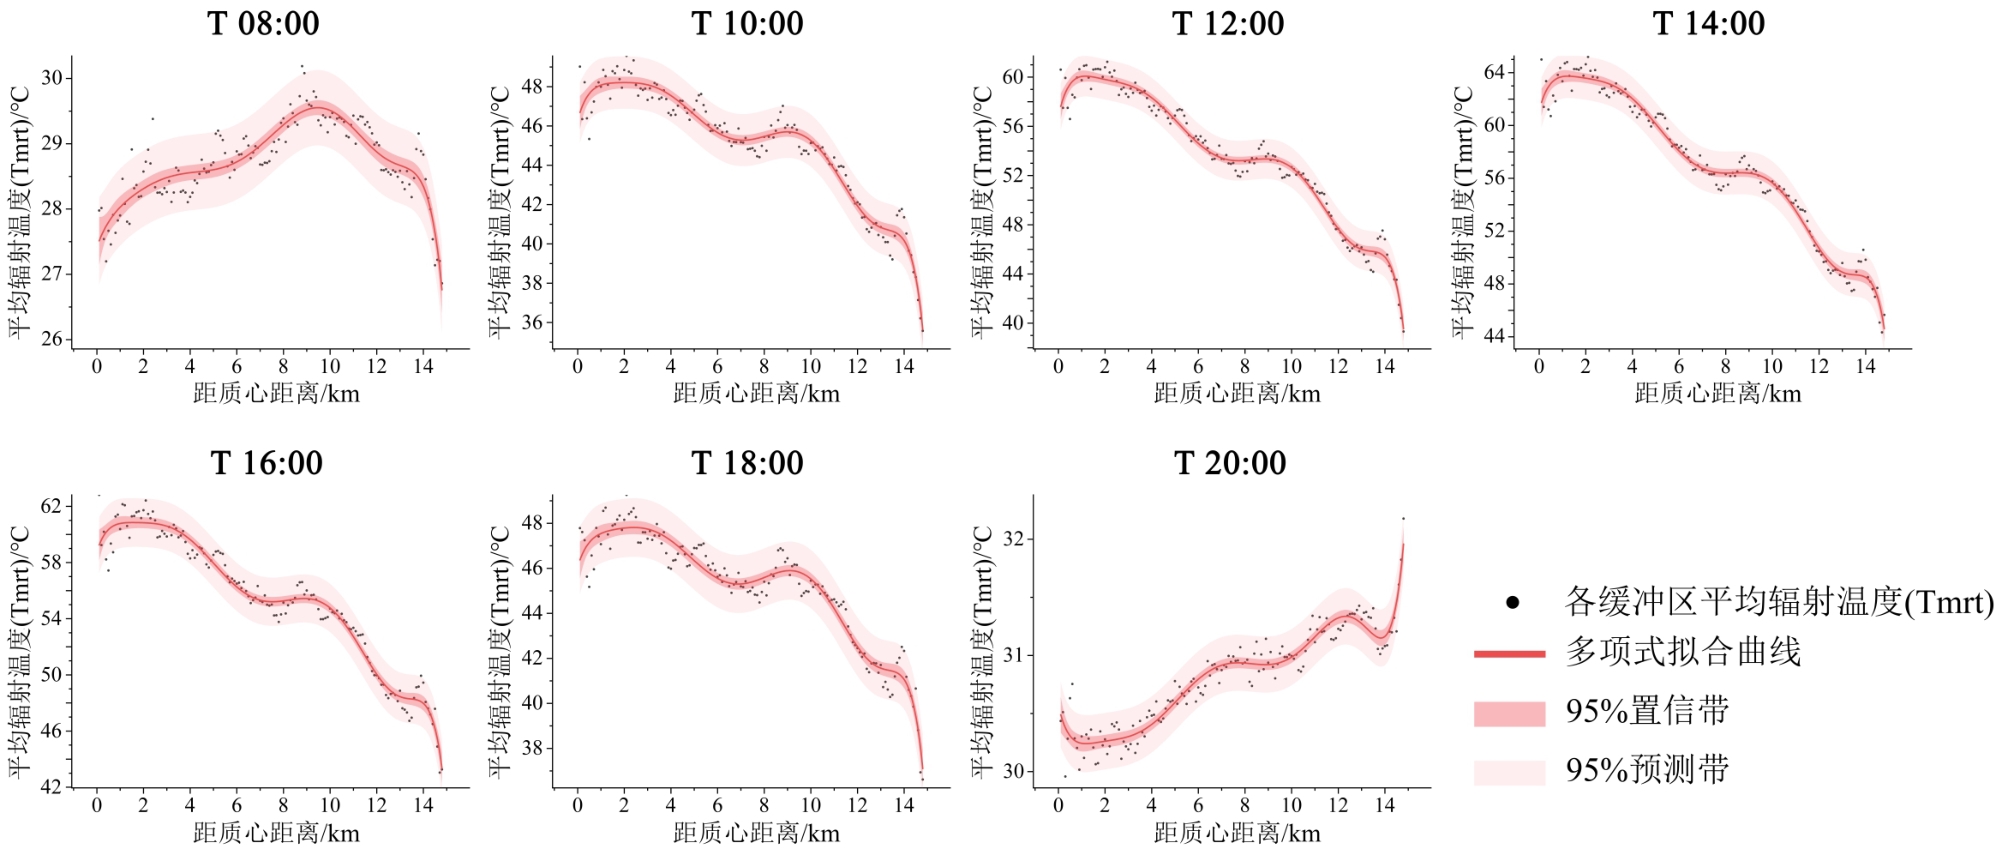
Fig.3
Variation characteristics of Tmrt along the "central- marginal" gradient
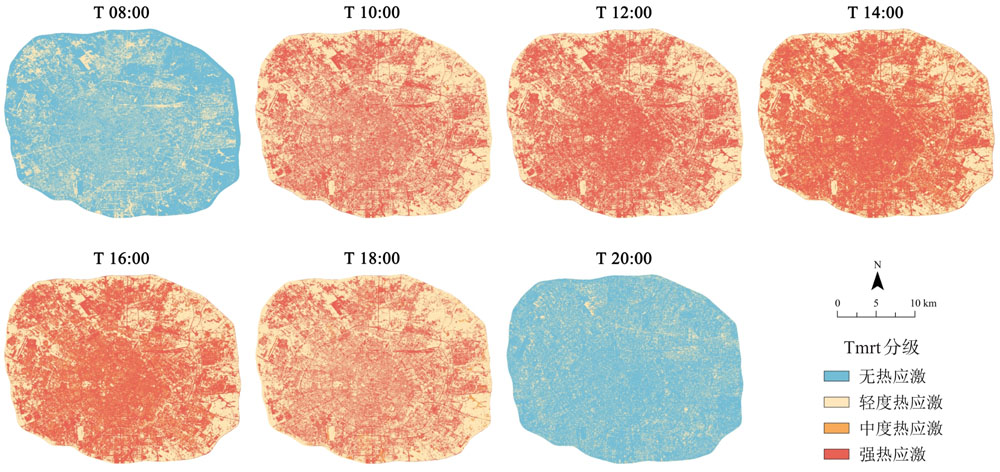
Fig.5
Tmrt classification based on heat stress
Fig.6
The spatiotemporal variation characteristics of heat exposure risk
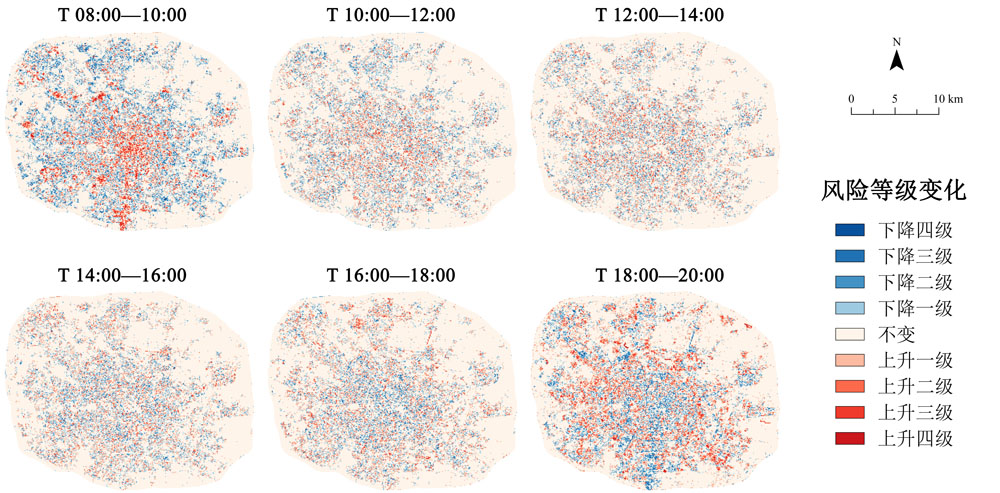
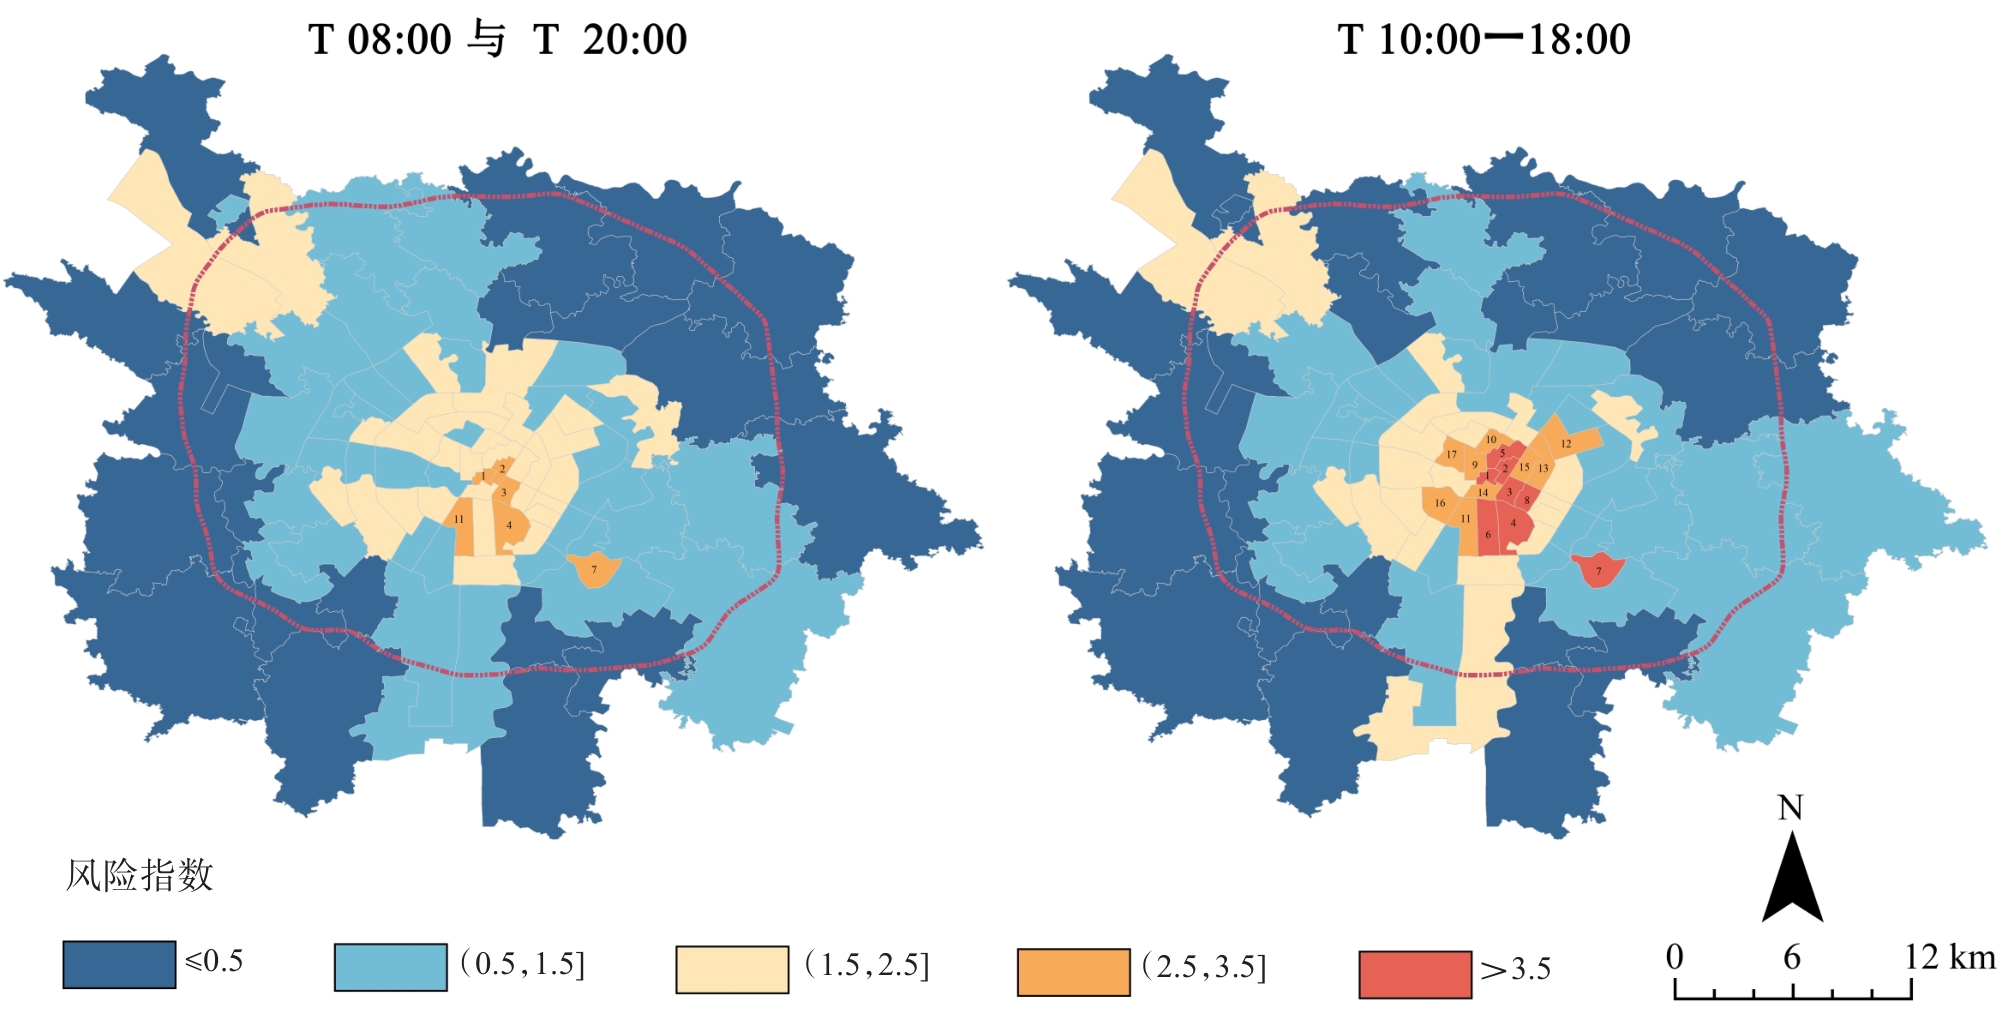
Fig.7
Spatiotemporal changes in heat exposure risk levels
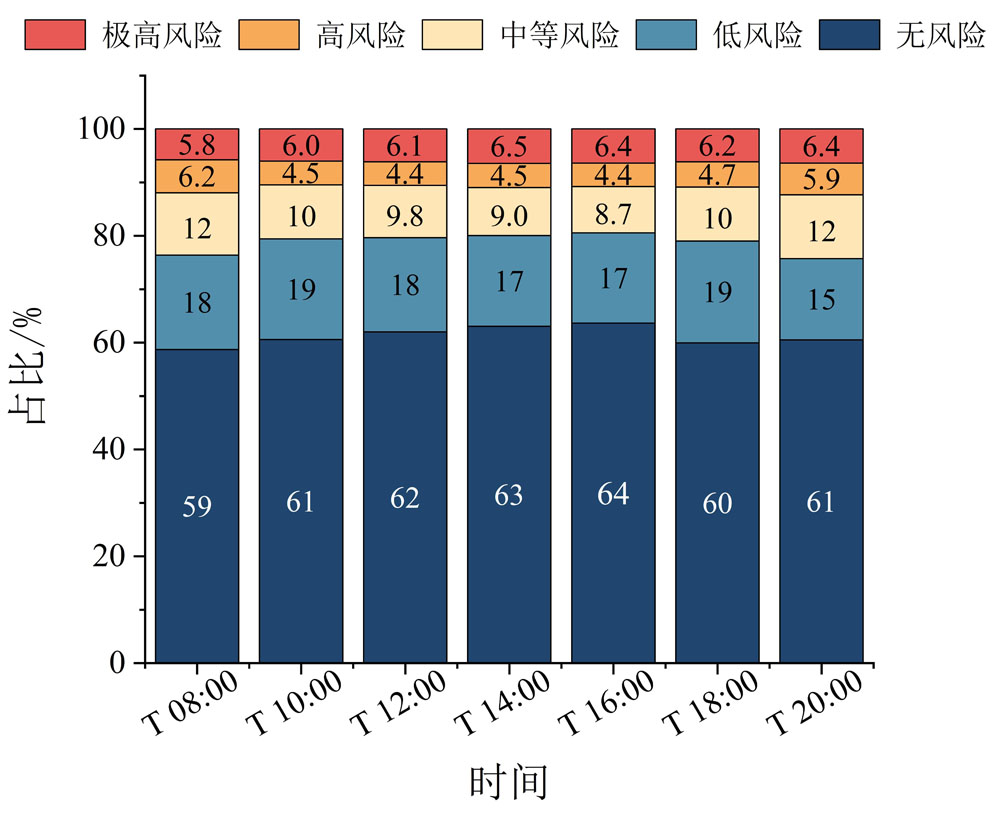
Fig.8
Quantitative Changes in Heat Exposure Risk Levels
Table 3
Spatial autocorrelation analysis between population/Tmrt and heat exposure risk
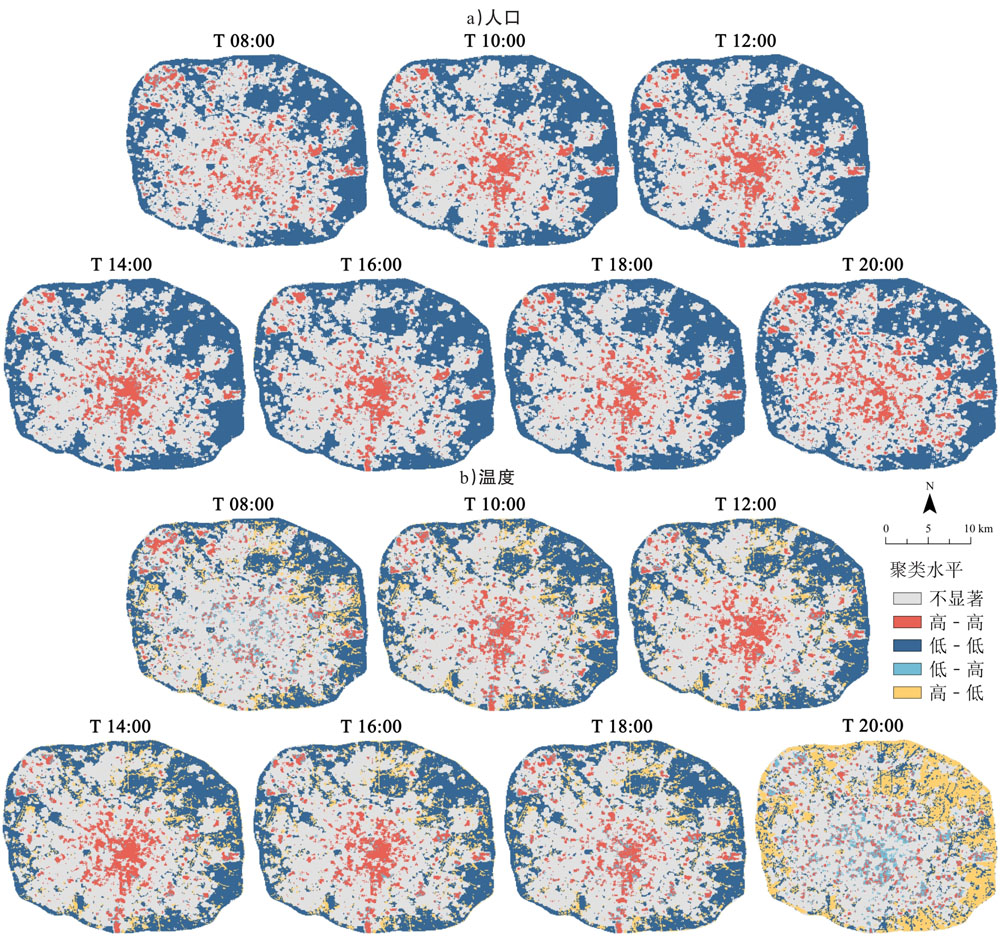
Fig.9
Correlation between population/Tmrt and heat exposure risk
Table 4
Time variation of the proportion of dominant factors of heat exposure risk
Fig.10
Average heat exposure risk of each sub-district