
Received date: 2018-12-22
Request revised date: 2019-05-01
Online published: 2019-11-08
Copyright
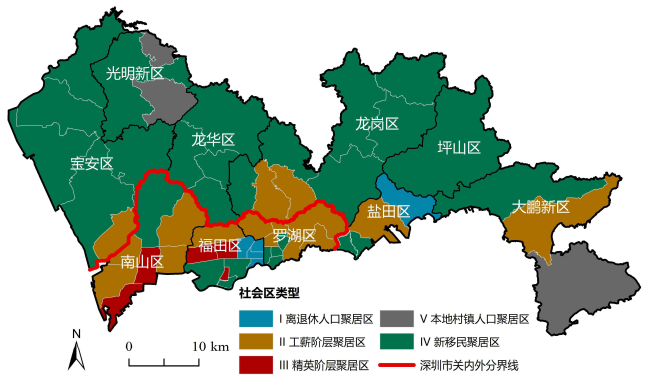
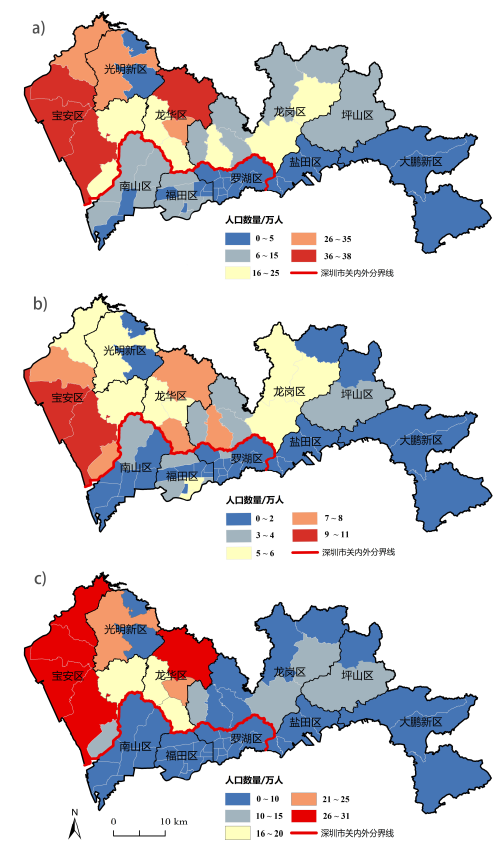
Boosted by industrialization and urbanization, China’s economy has become more oriented to growth. Along with this trend, the “urban era” is emerging, and the gap between rich and poor is increasing sharply within China’s cities. Available living space is therefore being rapidly reconstructed, and social space continuously differentiated. On the basis of data from the Sixth National Census, this paper explores the socio-spatial differentiation of the new migrants in Shenzhen, a typical migrants’ city in China, through calculations of the dissimilarity index, the isolation index and the Location Quotient. In addition to applying a linear regression model, this paper also analyzes the factors influencing spatial differentiation of new migrants in Shenzhen and compares these with Guangzhou to explore the similarities and differences of socio-spatial differentiation and its influencing mechanism in different cities. The empirical analysis shows that, first, there are five types of social spaces in Shenzhen, including elite-stratum neighborhoods, working-class ghettos, retired-population neighborhoods, urban villages, and new-migrant neighborhoods. Second, the spatial distribution of new migrants is uneven at the city level: the intra-province migrants are more concentrated inside the special economic zone (SEZ) of Shenzhen (where Futian District, Luohu District, Nanshan District and Yantian District locate), while inter-province migrants concentrate outside the SEZ (where Baoan District, Longgang District, Guangming New District, Longhua New District, Pingshan New District and Dapeng New District locate). Third, the dissimilarity index between the new migrants and the local residents is 0.47 and the isolation index is 0.64 in Shenzhen, higher than the same indices in Guangzhou, which indicates a higher degree of isolation among new migrants in Shenzhen. Moreover, there are significant differences on the degree of isolation between the districts of the SEZ and those outside the SEZ. This situation mainly stems from the differences in the level of economic development and the industrial structure, which is different from the suburbanization of migrants dominated by market factors in other Chinese cities like Guangzhou. Fourth, the results of the linear regression model show that the effects of institutional factors (Hukou-account attributes) on the spatial pattern of new migrants have decreased, while the role of market factors is increasing in this regard, in line with the assumption of “transition to a market-oriented economy”. Besides, demographic characteristics have significant influence on the spatial pattern of new migrants, especially with regard to the effects of age and educational level. Fifth, by contrast, the spatial pattern of new migrants in Guangzhou is impacted not only by the dual influences of institutional and market factors but also by the age structure and marital status. The household registration system continues to exert influence on spatial patterns in Guangzhou. It can be seen that the socio-spatial differentiation of new migrants and its mechanism show a pattern of heterogeneity in different cities. At the leading edge of the reform and opening-up policy, Shenzhen reflects the characteristics of social space under the influence of China’s transformation of socialist market. After the reform and opening-up policy more than 30 years ago, the shifting influences of “system-market” factors and the effect of the transition are particularly evident in Shenzhen. Against the historical background of the government and the market’s influence, the socio-spatial pattern in urban China is gradually developing into a “market-oriented” model.
Rong Wu , Zhuolin Pan , Ye Liu , Zhigang Li . Socio-spatial Segregation of New Migrants in Shenzhen, China[J]. Tropical Geography, 2019 , 39(5) : 721 -731 . DOI: 10.13284/j.cnki.rddl.003149

表1 深圳与广州各区分异指数与隔离指数Tab.1 Index of dissimilarity and index of isolation in Shenzhen and Guangzhou |
| 区域 | 分异指数(ID) | 隔离指数(II) |
|---|---|---|
| 深圳市 | 0.47 | 0.64 |
| 罗湖区 | 0.15 | 0.39 |
| 福田区 | 0.32 | 0.50 |
| 南山区 | 0.26 | 0.45 |
| 宝安区 | 0.30 | 0.74 |
| 龙岗区 | 0.22 | 0.61 |
| 盐田区 | 0.18 | 0.46 |
| 广州市 | 0.48 | 0.56 |
| 荔湾区 | 0.32 | 0.38 |
| 越秀区 | 0.38 | 0.35 |
| 海珠区 | 0.52 | 0.54 |
| 天河区 | 0.45 | 0.58 |
| 白云区 | 0.41 | 0.64 |
| 黄埔区 | 0.41 | 0.65 |
| 番禺区 | 0.37 | 0.52 |
| 花都区 | 0.51 | 0.51 |
| 南沙区 | 0.51 | 0.59 |
| 萝岗区 | 0.52 | 0.68 |
注:广州市数据来源于文献(李志刚 等,2014)。 |
表2 变量基本情况Tab.2 The in-use variables % |
| 因素 | 变量 | 指标 | 均值 | 最小值 | 最大值 | 方差 |
|---|---|---|---|---|---|---|
| 人口因素 | 年龄结构 | >45岁人口比例 | 15.1 | 6.3 | 27.8 | 5.0 |
| 婚姻状况 | 已婚人口比例 | 54.3 | 36.4 | 64.8 | 5.9 | |
| 教育水平 | 受高等教育人口比例 | 21.0 | 4.1 | 62.1 | 13.7 | |
| 制度因素 | 户口类型 | 集体户比例 | 20.8 | 7.6 | 74.4 | 10.0 |
| 市场因素 | 收入来源 | 劳动收入比例 | 70.3 | 50.3 | 97.7 | 9.6 |
| 物权类型 | 市场性租房比例 | 55.4 | 17.2 | 84.0 | 15.7 | |
| 住房因素 | 住房面积 | >110 m2户数比例 | 3.0 | 0 | 11.5 | 2.4 |
表3 影响因素回归模型Tab.3 The results of regression for independent variables |
| 指标 | 模型一 (人口因素) | 模型二 (制度因素) | 模型三 (市场因素) | 模型四 (市场因素) | 模型五 (市场因素) | 模型六 (住房因素) | |||||||||||||
|---|---|---|---|---|---|---|---|---|---|---|---|---|---|---|---|---|---|---|---|
| B. | S.E. | Sig. | B. | S.E. | Sig. | B. | S.E. | Sig. | B. | S.E. | Sig. | B. | S.E. | Sig. | B. | S.E. | Sig. | ||
| 控制 变量 | >45岁人口比例 | -3.023*** | 0.519 | 0.000 | -2.954*** | 0.526 | 0.000 | -1.633** | 0.543 | 0.004 | -2.674*** | 0.582 | 0.000 | -1.412* | 0.580 | 0.018 | -3.373*** | 0.523 | 0.000 |
| 已婚人口比例 | -0.831* | 0.357 | 0.024 | -0.592 | 0.445 | 0.189 | -0.367 | 0.324 | 0.262 | -0.943* | 0.365 | 0.013 | -0.458 | 0.334 | 0.176 | -1.030** | 0.354 | 0.005 | |
| 受高等教育人口比例 | -0.553** | 0.170 | 0.002 | -0.537** | 0.172 | 0.003 | -0.298 | 0.157 | 0.064 | -0.441* | 0.190 | 0.024 | -0.222 | 0.172 | 0.201 | -0.731*** | 0.182 | 0.000 | |
| 考 察 变 量 | 集体户比例 | — | — | — | 0.233 | 0.259 | 0.372 | — | — | — | — | — | — | — | — | — | — | — | — |
| 劳动收入比例 | — | — | — | — | — | — | 1.360*** | 0.303 | 0.000 | — | — | — | 1.329*** | 0.304 | 0.000 | — | — | — | |
| 市场性租房比例 | — | — | — | — | — | — | — | — | — | 0.230 | 0.178 | 0.202 | 0.167 | 0.155 | 0.286 | — | — | — | |
| >110 m2户数比例 | — | — | — | — | — | — | — | — | — | — | — | — | — | 2.467* | 1.079 | 0.026 | |||
| 常量 | 1.904*** | 0.172 | 0.000 | 1.977*** | 0.201 | 0.000 | 0.432 | 0.360 | 0.235 | 1.761*** | 0.204 | 0.000 | 0.362 | 0.365 | 0.326 | 2.027*** | 0.174 | 0.000 | |
| 相关系数R | 0.869 | — | — | 0.871 | — | — | 0.907 | — | — | 0.873 | — | — | 0.909 | — | — | 0.881 | — | — | |
| 决定系数R2 | 0.755 | — | — | 0.758 | — | — | 0.822 | — | — | 0.762 | — | — | 0.826 | — | — | 0.777 | — | — | |
| 校正决定系数R2adj | 0.741 | — | — | 0.740 | — | — | 0.809 | — | — | 0.744 | — | — | 0.809 | — | — | 0.760 | — | — | |
| 剩余标准差S.E. | 0.136 | — | — | 0.137 | — | — | 0.117 | — | — | 0.136 | — | — | 0.117 | — | — | 0.131 | — | — | |
注:*、**和***分别代表在5%、1%、0.1%显著水平上显著(双尾检验)。下表同。 |
表4 深圳市新移民总体模型Tab.4 The regression result of all migrant variables in Shenzhen |
| 因素 | 指标 | 模型七 | 模型八 | ||||
|---|---|---|---|---|---|---|---|
| B. | S.E. | Sig. | B. | S.E. | Sig. | ||
| 人口因素 | >45岁人口比例 | -1.644** | 0.569 | 0.006 | -1.947*** | 0.530 | 0.001 |
| 已婚人口比例 | -1.009* | 0.380 | 0.011 | — | — | — | |
| 受高等教育人口比例 | -0.385* | 0.174 | 0.032 | — | — | — | |
| 制度因素 | 集体户比例 | -0.540 | 0.330 | 0.109 | — | — | — |
| 市场因素 | 劳动收入比例 | 1.676*** | 0.419 | 0.000 | 1.618*** | 0.278 | 0.000 |
| 市场性租房比例 | 0.073 | 0.190 | 0.702 | — | — | — | |
| 住房因素 | >110 m2户数比例 | 2.008* | 0.967 | 0.043 | — | — | — |
| 模型检验 | 相关系数R | 0.922 | — | — | — | — | — |
| 决定系数R2 | 0.850 | — | — | — | — | — | |
| 校正决定系数R2adj | 0.829 | — | — | — | — | — | |
| 剩余标准差S.E. | 0.111 | — | — | — | — | — | |
表5 广州市新移民总体模型Tab.5 The regression result of all migrant variables in Guangzhou |
| 因素 | 指标 | B. | S.E. | Sig. |
|---|---|---|---|---|
| 人口因素 | >45岁人口比例 | -2.239*** | 0.089 | 0.000 |
| 已婚人口比例 | 0.797*** | 0.101 | 0.000 | |
| 受高等教育人口比例 | 0.073 | 0.050 | 0.143 | |
| 制度因素 | 集体户比例 | 1.331*** | 0.105 | 0.000 |
| 市场因素 | 劳动收入比例 | 0.683 | 0.350 | 0.051 |
| 市场性租房比例 | 1.322*** | 0.034 | 0.000 | |
| 住房因素 | >120 m2户数比例 | -0.104** | 0.041 | 0.010 |
| 模型检验 | 相关系数R | 0.891 | — | — |
| 决定系数R2 | 0.794 | — | — | |
| 校正决定系数R2adj | 0.793 | — | — | |
| 剩余标准差S.E. | 0.287 | — | — |
| 1 |
|
| 2 |
|
| 3 |
边燕杰, 刘勇利 . 2005. 社会分层、住房产权与居住质量——对中国“五普”数据的分析. 社会学研究,(3): 82-98, 243.
[
|
| 4 |
|
| 5 |
|
| 6 |
陈宏胜, 李志刚 . 2014. 快速城镇化下中国大城市房权分异研究. 地理学报, 69(12):1821-1832.
[
|
| 7 |
|
| 8 |
|
| 9 |
|
| 10 |
狄乾斌, 刘欣欣, 曹可 . 2013. 中国海洋经济发展的时空差异及其动态变化研究. 地理科学, 33(12):1413-1420.
[
|
| 11 |
|
| 12 |
冯健, 钟奕纯 . 2018. 北京社会空间重构(2000—2010). 地理学报, 73(4):711-737.
[
|
| 13 |
付磊, 唐子来 . 2008. 上海市外来人口社会空间结构演化的特征与趋势. 城市规划学刊,( 1):69-76.
[
|
| 14 |
国家统计局. 2018. 中国统计年鉴. 北京: 中国统计出版社.
[ National Bureau of Statistics. 2018. China Statistical Yearbook. Beijing: China Statistics Press. ]
|
| 15 |
|
| 16 |
|
| 17 |
|
| 18 |
|
| 19 |
|
| 20 |
|
| 21 |
兰宗敏, 冯健 . 2010. 城中村流动人口的时间利用以及生活活动时空间结构——对北京5个城中村的调查. 地理研究, 29(6):1092-1104.
|
| 22 |
[
|
| 23 |
李斌 . 2002. 中国住房改革制度的分割性. 社会学研究,( 2):80-87.
[
|
| 24 |
李志刚, 吴缚龙 . 2006. 转型期上海社会空间分异研究. 地理学报, 61(2):199-211.
[
|
| 25 |
李志刚, 刘晔, 陈宏胜 . 2011. 中国城市新移民的“乡缘社区”:特征、机制与空间性——以广州“湖北村”为例. 地理研究, 30(10):1910-1920.
[
|
| 26 |
李志刚, 吴缚龙, 肖扬 . 2014. 基于全国第六次人口普查数据的广州新移民居住分异研究. 地理研究, 33(11):2056-2068.
[
|
| 27 |
林李月, 朱宇, 梁鹏飞, 肖宝玉 . 2014. 基于六普数据的中国流动人口住房状况的空间格局. 地理研究, 33(5):887-898.
[
|
| 28 |
林宇川, 冯健 . 2011. 深圳关内关外一体化过程中的边界效应及时空演变. 热带地理, 31(6):580-585.
[
|
| 29 |
|
| 30 |
|
| 31 |
毛夏, 徐蓉蓉, 李新硕, 王煜, 李程, 曾波, 何宇华, 刘锦泉 . 2010. 深圳市人口分布的细网格动态特征. 地理学报, 65(4):443-453.
[
|
| 32 |
欧顺仙, 肖扬, 李志刚 . 2016. 新生代农民工的社会空间流动研究——以深圳富士康为例. 城市规划, 40(4):69-74.
[
|
| 33 |
|
| 34 |
申庆喜, 李诚固, 刘仲仪, 胡述聚, 刘倩 . 2018. 长春市公共服务设施空间与居住空间格局特征. 地理研究, 37(11):2249-2258.
[
|
| 35 |
深圳市统计局, 国家统计局深圳调查队. 2018. 深圳统计年鉴. 北京: 中国统计出版社.
[ Statistics Bureau of Shenzhen and NBS Survey Office in Shenzhen. 2018. Shenzhen Statistical Yearbook. Beijing: China Statistics Press. ]
|
| 36 |
|
| 37 |
|
| 38 |
|
| 39 |
|
| 40 |
王春兰, 杨上广, 何骏, 刘陆雪 . 2018. 上海城市社会空间演化研究——基于户籍与职业双维度. 地理研究, 37(11):2236-2248.
[
|
| 41 |
魏立华, 闫小培 . 2006. 转型期中国城市社会空间演进动力及其模式研究——以广州市为例. 地理与地理信息科学, 22(1):67-72.
[
|
| 42 |
吴开泽 . 2017. 房改进程、生命历程与城市住房产权获得(1980—2010年). 社会学研究, 32(5): 64-89, 243-244.
[
|
| 43 |
吴明伟, 吴晓 .2005. 我国城市化背景下的流动人口聚居形态研究. 南京: 东南大学出版社.
[
|
| 44 |
吴启焰, 吴小慧,
[
|
| 45 |
徐旳, 朱喜钢, 李唯 . 2009. 西方城市社会空间结构研究回顾及进展. 地理科学进展, 28(1):93-102.
[
|
| 46 |
阎云翔, 陆洋 .2016. 中国社会的个体化. 上海: 上海译文出版社.
[
|
| 47 |
张京祥, 赵丹, 陈浩 . 2013. 增长主义的终结与中国城市规划的转型. 城市规划, 37(1):45-50.
[
|
| 48 |
张瑜, 仝德,
|
| 49 |
[
|
| 50 |
赵美风, 戚伟, 刘盛和 . 2018. 北京市流动人口聚居区空间分异及形成机理. 地理学报, 73(8):1494-1512.
[
|
| 51 |
周春山, 杨高, 王少剑 . 2016a. 深圳农民工集聚空间的演变特征及影响机制. 地理科学, 36(11):1643-1653.
[
|
| 52 |
周春山, 胡锦灿, 童新梅, 边艳 . 2016b. 广州市社会空间结构演变跟踪研究. 地理学报, 71(6):1010-1024.
[
|
| 53 |
周林刚 . 2007. 地位结构、制度身份与农民工集体消费——基于深圳市的实证分析. 中国人口科学,( 4):88-94.
[
|
/
| 〈 |
|
〉 |