Behavior Characteristics of Food Shopping of Guangzhou Residents in the Age of Online Shopping

  • Qinghua Deng 1, 2 ,
  • Desheng Xue , 1 ,
  • Jianzhou Gong 2
Expand
  • 1. School of Geography and Planning, Sun Yat-Sen University, Guangzhou 510275, China
  • 2. School of Geographic Sciences, Guangzhou University, Guangzhou 510006, China

Received date: 2019-07-08

  Request revised date: 2019-08-27

  Online published: 2019-11-08

Copyright

Copyright reserved © 2019

Abstract

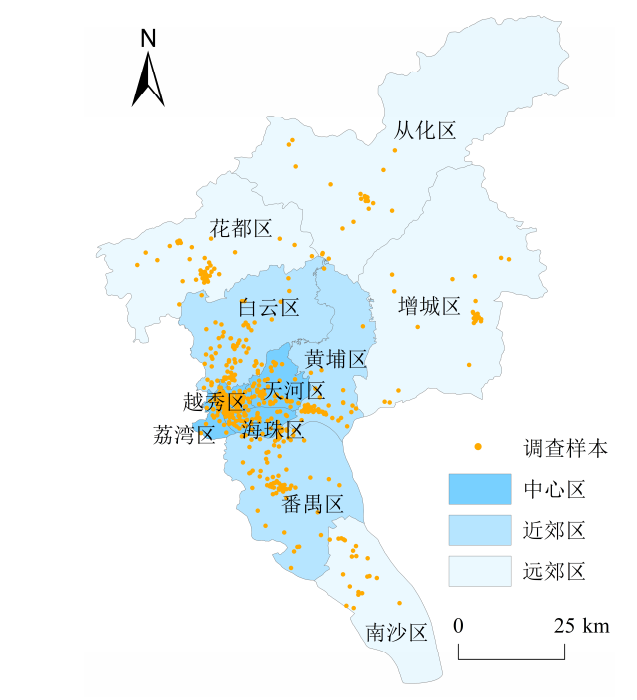
Information and communication technology reshapes resident behavior and urban spaces. Emerging online shopping has changed residents’ shopping preferences and processes, which inevitably affects the physical business space. However, there are some differences in shopping behaviors of different types of goods. Current research focuses on online shopping behavior for books, clothes, and other commodities, but seldom explores online food shopping behavior from the spatial perspective. Based on 1406 questionnaires on the food shopping behavior of residents in Guangzhou, we compared the behaviors of food purchasers whether to buy online, who buy food online in different locations and with different frequencies. General and spatial characteristics of food shopping behaviors of Guangzhou residents under the influence of online shopping were investigated in this study using cross frequency, chi-square test, and corresponding analyses. Spatial characteristics included shopping locations, retail formats, residence locations, and shopping travel time. The results of this study are as follows: 1) Acceptance of online shopping food is generally low, and the traditional shopping model still dominates; however, online food shopping has a certain substitution effect on traditional food purchases based on purchase frequency and single cost. This is consistent with Suel et al. (2015) who investigated the relationship between online and physical grocery shopping in the United Kingdom. 2) The influence of online shopping on food sales spaces varies in different locations and formats. Online food shopping has a greater negative effect on shops around residential areas but little on those in the business district. Supermarkets and department stores will be negatively affected relative to leisure snacks and local specialty food sales, whereas fresh food stores will be less affected. In the context of the decline in physical business owing to online shopping, Guangzhou’s fresh supermarkets are booming, which also confirms that online shopping has less impact on fresh food stores. 3) The role of spatial factors still exists in the information age. Resident online shopping behaviors show similar frequency in different locations but are dissimilar in cost, time, and reasons for online shopping. However, residents with poor physical shopping conditions are more inclined to buy food online, verifying the “efficiency hypothesis”. Spatial factors are an important reason why Guangzhou residents buy food online. Residents with poor physical shopping conditions are more affected by this factor, supporting the “efficiency hypothesis” from another angle. 4) The purpose and time of physical shopping trips of online food shoppers have changed. Online food shoppers have more leisure shopping purposes and more weekend shopping trips. Additionally, residents with high online food shopping frequency have shorter travel times. The results of this study will help develop targeted business development strategies and commercial space planning in the future. This study helps understand the impact of online shopping on different types of goods and different physical business locations to guide the future layout and development of online and offline retail enterprises and provide a basis for city governments to conduct business facilities network planning.

Cite this article

Qinghua Deng , Desheng Xue , Jianzhou Gong . Behavior Characteristics of Food Shopping of Guangzhou Residents in the Age of Online Shopping[J]. Tropical Geography, 2019 , 39(5) : 780 -789 . DOI: 10.13284/j.cnki.rddl.003171

开放科学(资源服务)标识码(OSID):
信息通讯技术(Information & Communication Technology, ICT)与商业的结合产生了网络购物,近20a来在中国迅速发展。中国互联网络信息中心(CNNIC)第43次《中国互联网络发展状况统计报告》公布:截至2018年12月,中国网络购物用户规模达到6.1亿人(中国互联网络信息中心,2019)。商务部于2019年2月公布,2018年全国网上零售额突破90 000亿元(冯其予,2019)。2017年7月商务部发布的《中国电子商务报告(2016)》显示,2016年网上零售商品交易额食品酒水类排第5位,同比增长46.3%,成为近年来增长快速的商品类别(中国商务部电子商务和信息化司,2017)。商业业态的每次变革必然引起消费者行为的改变,网络购物这种新兴商业业态已逐渐改变居民的消费偏好和习惯,重塑消费活动的时空过程。
网络购物行为是购物者在网络购物过程中进行的一系列活动的总称,是实体空间行为进入虚拟空间行为延伸的典型代表(孙智群 等,2009),对未来商业格局、交通运输及城市空间等都将产生重要影响。国内外相关研究主要集中在经济管理、市场营销、交通运输、心理学等学科,21世纪初国外地理学、城市规划等学科已有相关涉及,而国内地理学对此领域涉及较少。目前已有研究主要关注网络购物行为与传统购物出行的关系(Mokhtarian, 2004;汪明峰 等,2012;Edrisi et al., 2017)、网络购物行为特征(欧玫姗,2009;孙智群 等,2009;Ahmed et al., 2013)、影响因素(Farag et al., 2006; Ren et al., 2009;席广亮 等,2014;Ganapathi et al., 2015)及空间效应(Weltevreden et al., 2007;汪明峰 等,2010)等方面,多是针对消费者行为的整体研究,较少区分商品类型。已有研究证明,网络购物行为会因购买商品类型不同而呈现出消费偏好、购买频率和空间特征的差异(Girard et al., 2003; Farag et al., 2006;杜晓娟 等,2017)。目前网络购物行为研究主要针对书籍、服装、日用百货、电子产品(Dennis et al., 2009; Tang et al., 2009;汪明峰 等,2010,2012,2013;Muruganantham et al., 2013;易智康,2015;张永明 等,2017a;杜晓娟 等,2017)等商品展开,并将商品分为搜索型和体验型两类(Nelson, 1970)。搜索型商品以书籍为代表,体验型商品以衣服为代表,对这两类商品的研究相对较多(章雨晴 等,2016;张永明 等,2017b)。食品属于体验型商品范畴(Nelson, 1970),具有购买频率高、安全性要求高、时效性强等区别与其他商品类型的特点,因此有必要对食品类商品的网络购买行为进行细致的研究。
对网络购买食品行为相关研究主要包括消费者个体属性、网购食品原因、网购食品行为特点、网购食品意愿影响因素和网购食品安全等方面。网购食品者多为年轻人和中年人、女性、受过大学教育、中高收入人群(Hiser et al., 1999; Morganosky et al., 2000; White, 2001; Kapoor et al., 2017; Bryła, 2018)。消费者网购食品的主要原因是方便和节省时间(Morganosky et al., 2000; Robertson et al., 2005;余安琦 等,2018),更容易、更快捷(Corbett, 2001),还有小部分是由于身体和其他约束原因很难在实体店购买食品杂货(Morganosky et al., 2000)。而Lennon等(2009)研究发现对当地零售业不满是农村消费者网上购买食品的强大推动力。Morganosky等(2001)对比了1998与1999年消费者网购食品杂货行为,发现网购食品杂货者的属性特征相似,但1999年被调查消费者的网购经历更长,更倾向于网购所有或大部分食品杂货,有更多的消费者是为节省购物时间而选择网购。Liang等(2011)分析了569名大学生在线购买特色食品行为的特征,认为消费者对在线购买特色食品持积极态度。余安琦等(2018)调查发现徐州、南通、无锡的消费者网购食品频率不高,休闲食品是其最主要网购食品,大部分被调查者认为网购食品的安全风险超过实体商店。对于网购食品意愿的影响因素,Pauzi等(2017)认为主要是社会影响、便利条件、享乐动机、感知风险和感知信任等因素。Li等(2017)通过研究发现消费者追求饮食简单快捷、食品新奇特别和购物乐趣会影响其网络购买食品的态度和行为。杨进广(2013)认为主观规范(① 本文对网上购买食品行为的研究中,主观规范可定义为消费者感觉对他重要的人或群体认为他应该不应该进行网上购买食品行为。)是影响消费者网购食品意愿最重要的因素,而感知风险的影响并不明显。网上商店的网站建设、在线服务、售后服务等也是影响消费者网购食品的因素之一,Hasanov等(2015)发现网站质量间接影响马来西亚有机食品在线购买意愿;最重要的原因是网站速度快、在线服务响应快、人员素质好(Daim et al., 2013)。生鲜电商平台方面如“电商平台口碑及信用好”“生鲜食品信息详细、真实可靠”“提供完善的售后服务”等会影响消费者网络购买决策(杨浩雄 等,2018),线上生鲜食品购物中心的服务品质和顾客关系管理对消费者满意度和承诺有影响,最终影响消费者的购买行为(Shin et al., 2019)。另外张红霞等(2017)指出消费者对网购食品安全问题普遍较为关注,对网购食品安全状况缺乏信心,网购频率和花费、对食品安全风险的态度、消费者的文化程度和收入水平等是影响消费者网购食品安全信心的重要因素。可见国内外学者对消费者网络购买食品行为已有较多探讨,但多是基于消费经济学、市场管理学、企业管理学等学科背景,空间视角仅有所触及,如White(2001)发现不同国家和美国不同城市化地区网购食品者比例差异较大,而美国不同区域间网购食品者比例差异不大。但真正意义上基于地理学视角的研究较为缺乏。网购食品者在实体和虚拟2种商业空间中的行为特征如何?居住地实体购物条件是否会影响消费者网络购物行为?城市内部不同区位居民的网购食品行为是否有差异?这都值得从地理学角度进行探讨。
因此,本文以广州市居民食品购买行为调查问卷为基础,通过对比网购食品者和不网购食品者、不同区位网购食品者、不同网购食品频率者的购买行为,探讨网络购物对居民购买食品行为的影响以及这种影响的空间特征。以期有助于深入理解网络购物对不同类型商品、不同区位实体商业空间的影响,对引导线上线下零售企业未来布局与发展提供参考,也为城市政府进行商业设施网点规划提供依据。

1 研究数据与方法

1.1 数据来源

广州是国家中心城市之一,也是传统商业城市。商业业态多样,商业设施等级体系完善。社会经济发达,互联网普及率高,网络购物近年来发展迅速。广州市辖越秀、荔湾、天河、海珠、黄埔、白云、番禺、南沙、花都、从化、增城11个行政区(图1)。据调查显示,2015—2017年,广州市网购消费者人均网购额逐年攀升,2017年为11 840元,比2016年(10 372元)增长14.2%,比2015年(6 320元)增长87.3%(国家统计局广州调查队城镇住户处,2018)。
图1 调查样本区域分布

Fig.1 Regional distribution of the survey samples

课题组于2015年11月开展了广州市居民购物行为问卷调查,根据回收问卷的人口属性统计数据,于2016年3月又做了补充调查以保证调查样本人口结构的合理性。问卷包括个人基本信息、总体购物习惯、网络购物态度、食品购买行为等内容。由于广州市各区在人口密度、实体商业设施配套、交通条件等方面存在差异,因此采用分层抽样与定点随机抽样相结合的方法,参照2014年末各区常住人口所占比例确定各区抽样数,然后在11个区的商业中心、大型公共场所、居住区定点随机抽样发放问卷,当场填写并回收。共发放问卷1 600份,回收问卷1 498份,有效问卷1 406份,有效率为93.9%。其中网购食品居民样本697份(表1),占总样本的49.6%,可见广州市居民对网络购买食品接受度一般。
表1 调查样本基本情况统计

Tab.1 The basic statistics of surveyed samples

样本属性 网购食品者 不网购食品者 合计
样本数/个 比例/% 样本数/个 比例/% 样本数/个 比例*/%
性别 313 45.3 378 54.7 691 49.1
384 53.7 331 46.3 715 50.9
年龄/岁 15~24 290 60.4 190 39.6 480 34.1
25~34 244 66.8 121 33.2 365 26.0
35~44 114 46.9 129 53.1 243 17.3
45~59 45 20.1 179 79.9 224 15.9
≥60 4 4.3 90 95.7 94 6.7
学历 初中及以下 25 12.3 179 87.7 204 14.5
高中或高职 129 41.2 184 58.8 313 22.3
大专或本科 511 61.1 326 38.9 837 59.5
研究生 32 61.5 20 38.5 52 3.7
月收入
/万元
<0.3 319 53.3 279 46.7 598 42.5
0.3~0.6 180 46.9 204 53.1 384 27.3
0.6~1 139 51.5 131 48.5 270 19.2
1~1.5 49 46.7 56 53.3 105 7.5
>1.5 10 20.4 39 79.6 49 3.5
职业 机关/事业单位人员 58 45.0 71 55.0 129 9.2
企业员工 194 56.4 150 43.6 344 24.5
私营业者 73 40.3 108 59.7 181 12.9
在校学生 281 61.4 177 38.6 458 32.5
自由职业者 50 47.6 55 52.4 105 7.5
农民 3 9.7 28 90.3 31 2.2
退休人员 7 8.9 72 91.1 79 5.6
其他 31 39.2 48 60.8 79 5.6
居住
区位
中心区 241 48.7 254 51.3 495 35.2
近郊区 257 49.4 263 50.6 520 37.0
远郊区 199 50.8 192 49.2 391 27.8
合计 697 49.6 709 50.4 1 406 100

注:*以样本总量1 406个为基数。

参考已有研究(翁艺丹 等,2015;张小英 等,2016;傅辰昊 等,2018),将调查区分为中心区、近郊区和远郊区3个圈层(见图1),中心区包括越秀、荔湾、天河、海珠4个区,近郊区包括黄埔、白云、番禺3个区,远郊区包括南沙、花都、从化和增城4个区。
表1显示:在性别方面,女性更能接受网购食品,因其除了工作外还承担更多购买食品的家务,因此更倾向于方便省事的网购渠道;年龄和学历方面,年轻人和学历高的人群对网购食品接受度更高,这是由于年轻人心态开放、易于接受新兴事物,而且学历高的群体普遍对电子设备的使用技能更强;月收入方面,≤1.5万元的人群中,有40%以上网购食品,而>1.5万元的人群只有20.4%网购食品,说明高收入人群对网购食品接受度较低;职业方面,在校学生和企业员工网购食品比例高于其他人群,分别为61.4%和56.4%;区位方面,差异度不大,网购食品者比例都约为50%。

1.2 研究方法

1.2.1 交叉频数分析 交叉频数分析适用于统计2个定类变量或1个定类变量与1个定序变量。通过建立由≥2个变量进行交叉分类形成的二维或多维列联表,对行变量与列变量之间的关联性和差异性进行分析(汪明峰 等,2012)。
1.2.2 卡方检验 卡方分析是用来研究2个定类变量是否独立,即是否存在某种关联性的最常用的方法。卡方检验是一种用途很广的计数资料假设检验方法,其目的是比较理论频数和实际频数的吻合程度或拟合优度。如果卡方检验的结果不显著,则不能拒绝原假设,即两变量是相互独立、互不关联的,如果卡方检验的结果显著,则拒绝原假设,即两变量间存在某种关联。
1.2.3 对应分析 对应分析主要用于研究分类变量构成的交叉表,主要适用于有多个类别的分类变量,可以揭示同1个变量各个类别之间的差异,以及不同变量各个类别之间的对应关系。(汪明峰 等,2012)对应分析的作用是用图形的方式表达分类变量之间的关系。

2 居民食品购买行为一般特征

2.1 频率、单次花费、时间及食品类型

2.1.1 月均购物频率 由表2可以看出,实体店购买仍占主导,网购食品频率较低,以每月1~4次为主,99%网购食品者仍会在实体店购买食品,并且在实体店购买频率高于网络购买。分析其原因,一方面,居民出于对食品安全性考虑,倾向于能“体验实物”的传统购物方式;另一方面由于食品为生活必需品,尤其生鲜食品购买率很高,而网络购物需要经过物流运输,不像实体店即买即得。网购食品者在实体店购买食品的频率与不网购食品者相比,其低频率(每月1~4次)比例为58.6%,高于不网购食品者,而高频率(每月5~10次、≥11次)比例则低于不网购食品者,反映了网购食品者在实体店的购买频率减少,网络购物对实体购物具有一定的替代效应。
表2 居民实体店和网络购买食品的频率、单次花费、时间比例

Tab. 2 Percentage of frequency, one-time cost and time for shopping food in physical stores and online

居民及购物渠道 月均购物频率/次 单次花费/元 时间
0 1~4 5~10 ≥11 合计 <20 20~50 50~100 >100 合计 工作日 周末 两者差不多 合计
不网购食品者 实体占比/% 2.6 47.8 29.4 20.2 100 15.5 38.1 32 14.4 100 6.2 32 61.8 100
网购食品者 实体占比/% 1 58.6 23.5 16.9 100 15.4 39.5 32 13.1 100 4.5 43.5 52 100
网络占比/% 0 89.1 9.8 1.1 100 13 40 35.4 11.6 100 5.2 21.9 72.9 100
2.1.2 单次花费 无论是实体店还是网购,网购食品者和不网购食品者,单次购买食品花费都不高,主要集中在20~50元、50~100元(见表2)。食品作为日常生活必需品,购买频率高、价格低,所以单次花费不高。另外居民通过网络或实体店购买食品单次花费在各金额段分布比例相近,可以认为1次网购花费基本上等同于1次实体店购物花费,所以从花费角度也证明了网络购物对实体购物的替代效应。
2.1.3 购物时间 不网购食品者在实体店、网购食品者在实体店和网络购买食品,选择周末和工作日“两者差不多”的比例最高,分别为61.8%、52%和72.9%(见表2)。网购食品者选择周末在实体店购买的比例更高(43.5%),说明网购食品者减少了工作日去实体店购买食品的出行,更多地选择在周末购买。此外,从网购食品者网络购买时间也可看出,工作日与周末购买食品“两者差不多”的比例约为72.9%,时间限制被弱化,这是因为网络购物不受时间、空间限制,随时随地都可以进行,在一定程度上改变了消费者的购物时间。
2.1.4 网络购买食品类型 按照网络购买食品的比例从大到小排序,前3位依次是休闲零食、进口食品、饮料冲饮类(表3),其值为83.6%、40.4%、31.4%。休闲零食一般消费频率高、价格低、标准化程度高,所以居民比较容易接受网络购买。而进口食品方面,由于贸易全球化和中国积极的对外开放政策,近年来广州居民对国外产品的需求迅速增长,而线下销售进口食品的实体店相对较少,食品种类也不多,通常价格也比网上商店高,所以网购渠道更受欢迎。值得注意的是,生鲜类食品网购率很低(6.4%),这与生鲜食品时效性强、不易保存运输、食品安全可靠性较低等特点有关。
表3 居民经常网络购买不同类型食品的比例

Tab.3 Percentage of different foods of residents shopping online

常网购食品类型 频数/次 比例*/%
休闲零食 577 83.6
生鲜食品 44 6.4
粮油调味 53 7.7
饮料冲饮 217 31.4
保健品类 66 9.6
烟酒 21 3
地方特产 115 16.7
进口食品 279 40.4
其他 2 0.3

注:*以690个网购食品者样本为基数,另7个网购食品者样本缺失此数据。

2.2 实体和网络购买的原因

从选择实体店购买的原因来看(图2),由于食品安全性要求高,消费者更希望能亲自感知食品的品质,所以“体验实物”比例最高,达51.4%。其次是“顺便逛逛”为34.7%。网购食品者选择“体验实物”的比例低于不网购食品者,说明网购食品者比较认可网上商店食品的品质,不会过于看重亲自体验。网购食品者选择“顺便逛逛”的比例高于不网购食品者,由此可知当消费者增加网络购物渠道后,去实体店购物更多具有休闲、社交等复合功能,并非单纯购物。
图2 实体店购买食品原因占比

Fig.2 Percentage of reasons for shopping food in physical stores

网购食品者选择网购食品原因为“时间不受限”“价格便宜”的比例分别为58.0%和57.8%(图3)。网络购物时间上的弹性使得购物过程碎片化,大城市生活节奏快,消费者可以充分利用任何零碎的闲暇时间进行购物,故成为吸引居民网络购买食品的重要原因。“可购异地特产”“购物可达性差”这2个原因可视为空间因素,比例分别为40.3%和20.7%,说明网络购物的优势在于不受空间限制,很好地弥补了实体购物的不足。“省时省力”的比例为29.5%,也可视为时间因素。因此时间、空间和价格是广州市居民选择网购食品的3大重要因素。
图3 网上购买食品原因占比

Fig.3 Percentage of reasons for shopping food online

3 居民食品购买行为空间特征

3.1 购买地点和商业业态

3.1.1 购买地点 广州市居民最主要购买食品的地点为居住地周边商店(表4),其次是购物网站(13.8%),商业区最低(3.8%)。网购食品者和不网购食品者的实体购买地点都以居住地周边商店为主,但两者占比差异大,前者比后者少26.2%,商业区占比较小且差异不大,网购食品者有25.2%以购物网站为主。可见部分网购食品者购物地点从居住地周边商店转移到购物网站,说明网购食品对居住地周边商店负面影响较大,对商业区影响很小。
表4 居民最主要购买食品地点的比例

Tab.4 Percentage of the major shopping sites for food %

购买地点 不网购食品者 网购食品者 合计
购物网站 0 25.2 13.8
居住地周边商店 96.7 70.5 82.4
商业区 3.3 4.3 3.8
图4可以发现,购物条件差和一般的居民更倾向于去网站购买食品,购物非常方便和购物条件良好的居民则倾向于居住地周边商店,无论处于哪种购物条件,居民都不倾向于去商业区。说明居民所处实体购物环境对消费者购买食品行为产生影响,信息化时代空间因素的作用仍然存在。
图4 居住地购物条件与购买食品地点对应分析

Fig.4 Correspondence analysis between residential shopping conditions and food shopping place

3.1.2 商业业态 网购食品者购买粮油调味、休闲零食、地方特产3类食品以超市为主;购买生鲜食品以肉菜市场为主,选择购物网站的比例低于其他3类(图5)。粮油调味、生鲜类食品,网购食品者在超市购买的比例较高,而不网购食品者在肉菜市场购买的比例更高;休闲零食类,网购食品者的部分购买活动转移到购物网站(7.9%),而在百货公司购买的比例明显低于不网购食品者;地方特产类,网购食品者在网站购买比例达23.7%,而在超市和百货公司购买的比例分别比不网购食品者低14.2%和6.7%。由此可见,广州市网购食品者总体上保持传统购物的商业业态选择习惯,但休闲零食和地方特产类食品网络购物占比相对较多,超市和百货公司的销售可能会受到负面影响。
图5 居民经常光顾的商业业态的比例

Fig.5 Percentage of commercial formats for shopping food

3.2 不同区位居民网购食品行为特征

表5可见,不同区位居民网购食品频率不存在明显差异(卡方检验,P=0.487>0.05),每月1~4次的低频率网购食品者居多,每月5~10次的较高频率网购食品者按中心区、近郊区、远郊区依次递减。总体上,网购食品频率没有空间差异,这可能是因为广州市居民对网购食品整体接受度不是很高。
表5 不同区位居民网购食品的频率、单次花费和时间比例

Tab.5 Percentage of frequency, time and one-time cost for shopping food online in different locations %

区域类型 月均网购频率/次 单次花费/元 时间
1~4 5~10 ≥11 合计 <20 20~50 50~100 >100 合计 工作日 周末 两者差不多 合计
中心区 88.0 11.2 0.8 100 11.0 33.7 40.1 15.2 100 5.5 19.9 74.6 100
近郊区 89.1 10.1 0.8 100 10.5 49.3 32.4 7.8 100 6.3 17.7 76.0 100
远郊区 90.5 7.5 2.0 100 18.8 35.5 33.5 12.2 100 3.6 29.6 66.8 100
不同区位居民网购食品的单次消费存在明显差异(卡方检验,P=0.001<0.05),<20元低额单次花费比例远郊区最高,20~50元的较高单次花费比例近郊区最高(49.3%);而50~100元和>100元的单次花费比例,中心区最高,近郊区最低。总的来看,网购食品单次花费中心区最高,远郊区次之,近郊区最低。可能是近郊区、远郊区居民整体收入水平低于中心区,其消费能力相对弱一些,而近郊区网购食品的频率又稍高于远郊区,所以导致其单次花费在高额段上要低于远郊区。
不同区位居民网购食品的时间具有明显差异(卡方检验,P=0.029<0.05),远郊区居民在周末网购占比远高于中心区和近郊区。可能由于远郊区部分居民属于职住分离,需要前往中心区和近郊区工作,并且远郊区“最后1公里”物流配送不是很完善,工作日收取快递不便,因而会选择在周末网购食品。
不同实体购物条件下居民网购食品的原因呈现多样化(图6)。最主要原因是“时间不受限”“价格便宜”“可购异地特产”“购物可达性差”。但也存在较为明显的差异(卡方检验,P=0.011<0.05),主要表现在购物条件差的居民选择“购物可达性差”“省时省力”的比例高达48.4%和38.7%,远远高于另外3种购物条件,这说明由于居住地商业配套设施不足,需要耗时费力的远距离购物出行,而网络购物弥补了实体购物的不便,成为吸引这类人群网络购物的重要原因。另外购物条件差的居民选择“价格便宜”比例为67.7%,同样比另外3种购物条件占比高得多,这可能因为其经济水平相对弱些,而网上商品价格优惠,因此网购食品更具吸引力。相比之下,“支付便捷”和“商品信息量大”的影响较弱。总体上,居民网购食品的原因存在空间差异,购物条件差的居民比购物非常方便、良好和一般这3种区位的居民更重视时间、空间和价格因素,购物非常方便、良好和一般的居民网购食品原因差异较小。
图6 不同居住地购物条件居民选择网购食品原因的比例

Fig.6 Percentage of main reasons for residents to shop food online in different shopping conditions

3.3 不同网购食品频率者的实体购物出行时间

网购食品者在网上购买部分食品,同时也会去实体店消费,其购买不同类型食品的购物出行时间总体差异不大(图7),基本上都≤30 min,尤其≤5 min、6~10 min 2个时间段占比最高,购物出行时间较短。但不同网购食品频率的居民的实体购物出行时间有差异,最为明显的是每月网购食品≥11次的居民,出行时间主要集中在6~10 min,其购买粮油调味和休闲零食两类食品≤15 min,购买生鲜食品≤20 min,购买地方特产的时间≤30 min,比其他网购食品频率者出行时间要短。这说明网络购物使得消费者实体购物出行时间缩短,对购物的时间距离接受程度降低。
图7 不同网购食品频率者实体购物出行时间占比

Fig.7 Percentage of shopping travel time of online food shoppers with different frequencies

4 结论与讨论

本文对网络购物高速发展背景下广州市居民购买食品行为进行了深入分析,得出以下结论:
1)居民个人社会经济属性特征会影响网络购买食品的接受度。女性、年轻人、高学历者人群更易接受网购食品,这一结论与Morganosky等(2000)的研究相似。但高收入人群对网购食品接受度低,这一结论与前人研究(Morganosky et al., 2000; White, 2001)不同,这可能是因为中国食品安全问题比美国等西方国家突出,高收入人群对价格不敏感,但对食品的品质要求更高,因此中国高收入人群会更倾向于可亲身体验感受商品的实体店购买。
2)居民对网络购买食品接受度总体不高,仍以传统的实体店购买为主。但从购物频率和单次花费可知网络购买食品对实体购物存在一定的替代效应,这与Suel等(2015)对英国食品杂货类商品网络购物和实体购物关系的研究结论一致。
3)网购食品对居住地周边商店负面影响较大,对商业区影响很小,超市和百货公司的休闲零食、地方特产销售会受到一定负面影响,生鲜类商店所受影响较小。近年来,在实体商业受网络购物影响出现衰退的背景下,广州市的生鲜超市却蓬勃发展,涌现出大量的钱大妈、善待家等连锁生鲜小店,以及盒马鲜生、7-FRESH等电商线下生鲜超市,也印证了网络购物对生鲜类商店影响小。
4)信息时代空间因素的作用仍然存在。不同区位居民网购食品的频率差异不大,但单次花费、时间和购买原因存在空间差异。居住地实体购物条件差的居民更倾向于网购食品,这支持了Anderson等提出的网络购物行为空间差异2种假说中的“效率假说”:当购物不便时,网络购物更容易发生(Anderson et al., 2003; Farag et al., 2006)。空间因素是广州市居民网购食品的重要原因之一,实体购物条件差的居民受该因素影响更大,这也从另一角度支持了“效率假说”。
5)网购食品者的实体购物出行目的与时间发生改变。网购食品者的实体购物出行单纯购物目的减少,休闲目的增加。周末购物出行更多,并且网购食品频率高的居民其购物出行时间缩短,对购物出行时间的接受度降低。
本文重点分析了网络购物影响下广州市居民购买食品行为的空间特征,并探讨部分实体商业所受的影响,这些影响有待进一步实证验证。本文未能对不同类型食品进行细致的研究,因为不同类型食品在商品特性、购买频率、存储条件等方面存在较大差异,消费者购买行为也不同,未来应开展针对不同的各类型食品网购行为的研究,这将有助于制定针对性的商业发展策略和商业空间规划。
1
Ahmed S A and Aguilar S . 2013. Comparison of Canadian and Mexican Students’ Online Shopping Behavior. Latin American Business Review, 14(1):79-106.

2
Anderson W P, Chatterjee L and Lakshmanan T R . 2003. E-commerce, Transportation, and Economic Geography. Growth and Change, 34(4):415-432.

3
Bryła P . 2018. Organic Food Online Shopping in Poland. British Food Journal, 120(5):1015-1027.

4
Corbett J J . 2001. Is Online Grocery Shopping Increasing in Strength?. Journal of Food Distribution Research, 32(1):37-40.

5
Dennis C, Hansen T and Jensen J M . 2009. Shopping Orientation and Online Clothing Purchases: The Role of Gender and Purchase Situation. European Journal of Marketing, 43(9/10):1154-1170.

6
Daim T, Basoglu N, Gunay D, Yildiz C and Gomez F . 2013. Exploring Technology Acceptance for Online Food Services. International Journal of Business Information Systems, 12(4):383-403.

7
杜晓娟, 甄峰 , Cao Jason. 2017. 南京市居民购物行为的影响因素和空间效应——基于四种商品的对比研究. 地理研究, 36(5):957-971.

[ Du Xiaojuan, Zhen Feng and Cao Jason . 2017. Influential Factors and Spatial Effects of Individuals’ Shopping Behavior in Nanjing: A Comparative Study on Four Types of Goods. Geographical Research, 36(5):957-971. ]

8
Edrisi A and Ganjipour H . 2017. The Interaction between E-Shopping and Shopping Trip, Tehra. Proceedings of the Institution of Civil Engineers - Municipal Engineer, 170(4):239-246.

9
Farag S, Weltevreden J W J, Rietbergen T V, Dijst M J and Oort F G V . 2006. E-shopping in the Netherlands: Does Geography Matter? Environment and Planning B: Planning and Design, 33(1):59-74.

10
傅辰昊, 周素红, 闫小培, 柳林 . 2018. 广州市零售商业中心消费活动时变模式及其影响因素. 地理科学, 38(1):20-30.

[ Fu Chenhao, Zhou Suhong, Yan Xiaopei and Liu Lin . 2018. Temporal Variation Patterns and Influencing Factors of Consuming Activity in Retailing Centers: A Case Study of Guangzhou, China. Scientia Geographica Sinica, 38(1):20-30. ]

11
Ganapathi R . 2015. A Study on Factors Affecting Online Shopping Behavior of Consumers in Chennai. Journal of Management Research and Analysis, 2(2):123-126.

12
Girard T, Korgaonkar P and Silverblatt R . 2003. Relationship of Type of Product, Shopping Orientations, and Demographics with Preference for Shopping on the Internet. Journal of Business & Psychology, 18(1):101-120.

13
国家统计局广州调查队城镇住户处. 2018. 网购消费需求与供给应对分析.(2018-08-28)[2018-12-05].

[ Urban Households’ Office of Guangzhou Survey Team, National Bureau of Statistics. 2018. Analysis on the Demand and Supply of Online Purchase.(2018-08-28)[2018-12-05].

14
Hasanov J and Khalid H . 2015. The Impact of Website Quality on Online Purchase Intention of Organic Food in Malaysia: A Web Qual Model Approach. Procedia Computer Science, 72:382-389.

15
Hiser J, Nayga R M J and Capps O J . 1999. An Exploratory Analysis of Familiarity and Willingness to Use Online Food Shopping Services in a Local Area of Texas. Journal of Food Distribution Research, 30(1):78-90.

16
冯其予 . 2019. 去年全国网上零售额超九万亿元农村电商迅猛发展.(2019-02-22)[2019-03-20]. 经济日报,

[ Feng Qiyu. 2019. The National Online Retail Sales Exceeded 9 Trillion Yuan, and Rural E-commerce Developed Rapidly Last Year. (2019-02-22) [2019-03-20]. Economic Daily,

17
Kapoor N, Kumar Maurya M and Kamalvanshi V . 2017. Consumer’s Perception Towards Online Shopping of Food Products: An Empirical Research. Social Science Electronic Publishing, 5(12):25-30.

18
Lennon S J, Ha Y, Johnson K K P, Jasper C R, Damhorst M L and Lyons N . 2009. Rural Consumers’ Online Shopping for Food and Fiber Products as a Form of Outshopping. Clothing and Textiles Research Journal, 27(1):3-30.

19
Li Dekui and Zhou Fan . 2017. Study on Food Online Shopping Behavior of Citizen Based on Food-Related Lifestyle Theory. Qingdao: 3 rd International Conference on Social Science and Development.

20
Liang A R and Lim W M . 2011. Exploring the Online Buying Behavior of Specialty Food Shoppers. International Journal of Hospitality Management, 30(4):855-865.

DOI

21
Morganosky M A and Cude B J . 2000. Consumer Response to Online Grocery Shopping. International Journal of Retail & Distribution Management, 28(1):17-26.

22
Morganosky M A and Cude B J . 2001. Consumer Responses to Online Food Retailing. Journal of Food Distribution Research, 32(1):5-17.

23
Mokhtarian P L . 2004. A Conceptual Analysis of The Transportation Impacts of B2C E-Commerce. Transportation, 31(3):257-284.

DOI

24
Muruganantham G and Bhakat R S . 2013. An Empirical Study of Impulse Buying Behavior in Online Bookstores. International Journal of Online Marketing, 3(3):1-17.

25
Nelson P J . 1970. Information and Consumer Behavior. Journal of Political Economy, 78(2):311-329.

26
欧玫姗 . 2009. 澎湖地区居民之生活型态与网络购物行为研究. 澎湖:国立澎湖科技大学.

[ Ou Meishan . 2009. The Study on The Lifestyles and the Internet Shopping Behaviors of the Inhabitants in Penghu Area. Penghu: National Penghu University. ]

27
Pauzi S, Thoo A C, Tan L C, Muharam F M and Talib N A . 2017. Factors Influencing Consumers Intention for Online Grocery Shopping-A Proposed Framework. IOP Conference Series: Materials Science and Engineering, 215:1-12.

28
Ren F and Kwan M . 2009. The Impact of Geographic Context on E-Shopping Behavior. Environment and Planning B: Planning and Design, 36(2):262-278.

29
Robertson G, Murphy J and Purchase S . 2005. Distance to Market: Propinquity across In-store and Online Food Retailing. Electronic Markets, 15(3):235-245.

30
Shin J and Lee S . 2019. A Study on the Effect of Online Activation Business Transaction Factors of Fresh Food Shopping Mall on E-Customer Relationship Quality and E-Customer Loyalty. The East Asian Journal of Business Management, 7(1):1-16.

31
Suel E, Le Vine S and Polak J . 2015. Empirical Application of Expenditure Diary Instrument to Quantify Relationships between In-Store and Online Grocery Shopping. Transportation Research Record: Journal of the Transportation Research Board, 2496:45-54.

32
孙智群, 柴彦威, 王冬根 . 2009. 深圳市民网上购物行为的空间特征. 城市发展研究, 16(6):106-112.

[ Sun Zhiqun, Chai Yanwei and Wang Donggen . 2009. The Spatial Characteristics of E-shopping Behavior of Shenzhen Residents. Urban Studies, 16(6):106-112. ]

33
Tang W and Mokhtarian P L . 2009. Impact of Product Type and Other Variables on Store and Internet Purchase Intentions: Clothing Versus Books. Washington D C: Transportation Research Board 88 th Annual Meeting.

34
汪明峰, 卢姗, 邱娟 . 2010. 网上购物对城市零售业空间的影响:以书店为例. 经济地理, 30(11):1835-1840.

[ Wang Mingfeng, Lu Shan and Qiu Juan . 2010. The Impact of Online Shopping on Urban Retail Space: A Case Study of Book Store. Economic Geography, 30(11):1835-1840. ]

35
汪明峰, 卢姗 . 2012. 替代抑或补充:网上购物与传统购物出行的关系研究. 人文地理, 27(3):44-49.

[ Wang Mingfeng and Lu Shan . 2012. Substitution or Complementarity: Online Shopping and Its Relationship with Traditional Shopping Behavior. Human Geography, 27(3):44-49. ]

36
汪明峰, 卢姗, 袁贺 . 2013. 网上购物对不同区位消费者行为的影响——市区和郊区的比较. 城市规划, 37(11):84-88,95.

[ Wang Mingfeng, Lu Shan and Yuan He . 2013. Influences of Online Shopping on Consumer Behaviors at Different Shopping Locations: A Comparative Study on City Center and Suburb. City Planning Review, 37(11):84-88, 95. ]

37
翁艺丹, 千庆兰, 陈颖彪, 韩富状 . 2015. 广州人口空间均衡特征与经济关联研究初探. 广州大学学报(自然科学版), 14(6):84-91.

[ Weng Yidan, Qian Qinglan, Chen Yinbiao and Han Fuzhuang . 2015. A Preliminary Study on the Spatial Equilibrium of Guangzhou’s Population and Its Relationship with Economy. Journal of Guangzhou University (Natural Science Edition), 14(6):84-91. ]

38
Weltevreden J W J and Rietbergen T V . 2007. E-shopping versus City Centre Shopping: The Role of Perceived City Centre Attractiveness. Tijdschrift voor Economische en Sociale Geografie, 98(1):68-85.

39
White G K . 2001. Online Specialty Food Consumers in 2000: Who They Are and What They Buy. Journal of Food Distribution Research, 32(2):39-52.

40
席广亮, 甄峰, 汪侠, 秦萧 . 2014. 南京市居民网络消费的影响因素及空间特征. 地理研究, 33(2):284-295.

[ Xi Guangliang, Zhen Feng, Wang Xia and Qin Xiao . 2014. Study on the Influencing Factors and Spatial Characteristics of Residents’ Online Consumption in Nanjing. Geographical Research, 33(2):284-295. ]

41
杨浩雄, 王浩 . 2018. 生鲜食品网络购买决策的关键因素研究. 管理现代化, 38(4):64-66.

[ Yang Haoxiong and Wang Hao . 2018. Study on Key Factors of Fresh Food Online Purchasing Decision. Modernization of Management, 38(4):64-66. ]

42
杨进广 . 2013. 网上购物感知风险研究——以网购食品为例. 成都:西南交通大学.

[ Yang Jinguang . 2013. Online Shopping Perceived Risk Research: As the Net to Food. Chengdu: Southwest Jiaotong University. ]

43
易智康 . 2015. B2C电子商务对广州天河IT商业空间的影响研究. 广州:华南理工大学.

[ Yi Zhikang . 2015. The Impact of E-business on IT Commercial District in Guangzhou Tianhe. Guangzhou: South China University of Technology. ]

44
余安琦, 刘杨晨, 缪琪琪 . 2018. 基于描述性统计分析的网络食品购买行为与风险感知. 中国商论,( 22):60-62.

[ Yu Anqi, Liu Yangchen and Mu Qiqi . 2018. Internet Food Purchase Behavior and Risk Perception Based on Descriptive Statistical Analysis. Chinese Commerce, ( 22):60-62. ]

45
张小英, 巫细波 . 2016. 广州购物中心时空演变及对城市商业空间结构的影响研究. 地理科学, 36(2):231-238.

[ Zhang Xiaoying and Wu Xibo . 2016. Spatial-Temporal Evolution of Malls in Guangzhou City and Its Impact on Urban Commercial Spatial Structure. Scientia Geographica Sinica, 36(2):231-238. ]

46
张永明, 甄峰 . 2017 a.城市居民网络与实体购物互动模式及空间分异——以南京为例. 经济地理, 37(1):15-22.

[ Zhang Yongming and Zhen Feng . 2017 a. The Interaction Mode between Online Shopping and Store Shopping of Urban Resident and Spatial Differentiation:A Case Study of Nanjing. Economic Geography, 37(1):15-22. ]

47
张永明, 甄峰, 曹新宇, 翟青, 章雨晴 . 2017b. 基于区位和商品类型的居民购物过程分解比较——以南京为例. 人文地理, 32(1):109-115.

[ Zhang Yongming, Zhen Feng, Jason Cao, Zhai Qing and Zhang Yuqing . 2017b. A Comparative Study on Residents’ Shopping Process by Differentiating Location and Types of Goods: A Case Study of Nanjing City. Human Geography, 32(1):109-115. ]

48
张红霞, 杨渊 . 2017. 消费者网购食品安全信心及其影响因素分析. 调研世界,( 10):17-22.

[ Zhang Hongxia and Yang Yuan . 2017. Consumer’s Confidence in Online Food Safety and Its Influencing Factors. The World of Survey and Research, ( 10):17-22. ]

49
章雨晴, 甄峰, 张永明 . 2016. 南京市居民网络购物行为特征——以书籍和衣服为例. 地理科学进展, 35(4):476-486.

[ Zhang Yuqing, Zhen Feng and Zhang Yongming . 2016. Characteristics of E-Shopping Behavior of Nanjing Residents: A Case of Books and Clothes. Progress in Geography, 35(4):476-486. ]

50
中国互联网络信息中心. 2019. 第43次《中国互联网络发展状况统计报告》.(2019-02-28)[2019-04-06].http://www.cnnic.net.cn/hlwfzyj/hlwxzbg/hlwtjbg/201902/t20190228_70645.htm

[ China Internet Network Information Center. 2019. The 43rd Statistical Report on the Development of Internet in China (2019-02-28)[ 2019-04-06]. http://www.cnnic.net.cn/hlwfzyj/hlwxzbg/hlwtjbg/201902/t20190228_70645.htm.

51
中国商务部电子商务和信息化司. 2017. 中国电子商务报告(2016).(2017-06-14)[2019-02-15].http://dzsws.mofcom.gov.cn/article/dzsw/tjjc/201706/20170602591881.shtml

[ Department of Electronic Commerce and Informatization, Ministry of Commerce of the People’s Republic of China. 2017. China E-commerce Report(2016). (2017-06-14)[2019-02-15]. http://dzsws.mofcom.gov.cn/article/dzsw/tjjc/201706/20170602591881.shtml

Outlines

/